SOD – Frightening Genetics

tanoak killed by SOD; photo by Joseph O’Brien, via Bugwood

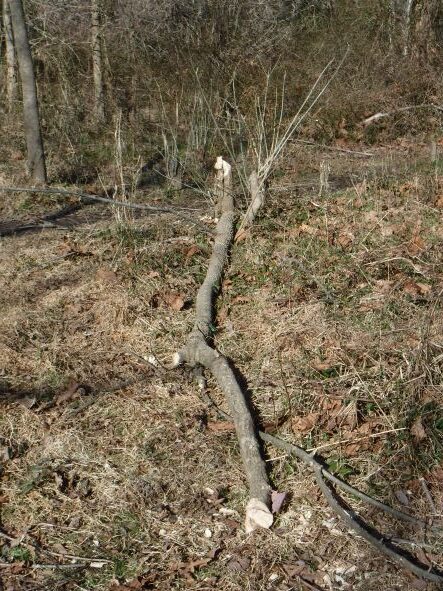
I am belatedly catching up with developments regarding sudden oak death (SOD; Phytophthora ramorum). The situation is worsening, with three of the four existing strains now established in U.S. forests. Nursery outbreaks remain disturbingly frequent.

This information comes primarily from the California Oak Mortality Task Force’s (COMTF) newsletters posted since October; dates of specific newsletters are shown in brackets.

Alarming presence of variants & hybridization

The long-feared risk of hybridization among strains has occurred. Canadian authorities carrying out inspections of a British Columbia nursery found a hybrid of European (EU1) and North American (NA2) clonal lineages. These hybrids are viable, can infect plants and produce spores for not only long-term survival but also propagation. So far the hybrid has been found in a single nursery; it has not spread to natural forests. The pathogen is considered eradicated in that nursery, so it is hoped it cannot reproduce further. [December 2021 newsletter, summarizing research by R. Hamelin et al.]

Noted British forest pathologist Clive Brasier warned in 2008 about the risk of hybrids evolving in nurseries which harbor multiple strains of related pathogens. (See full citation at end of the blog.)

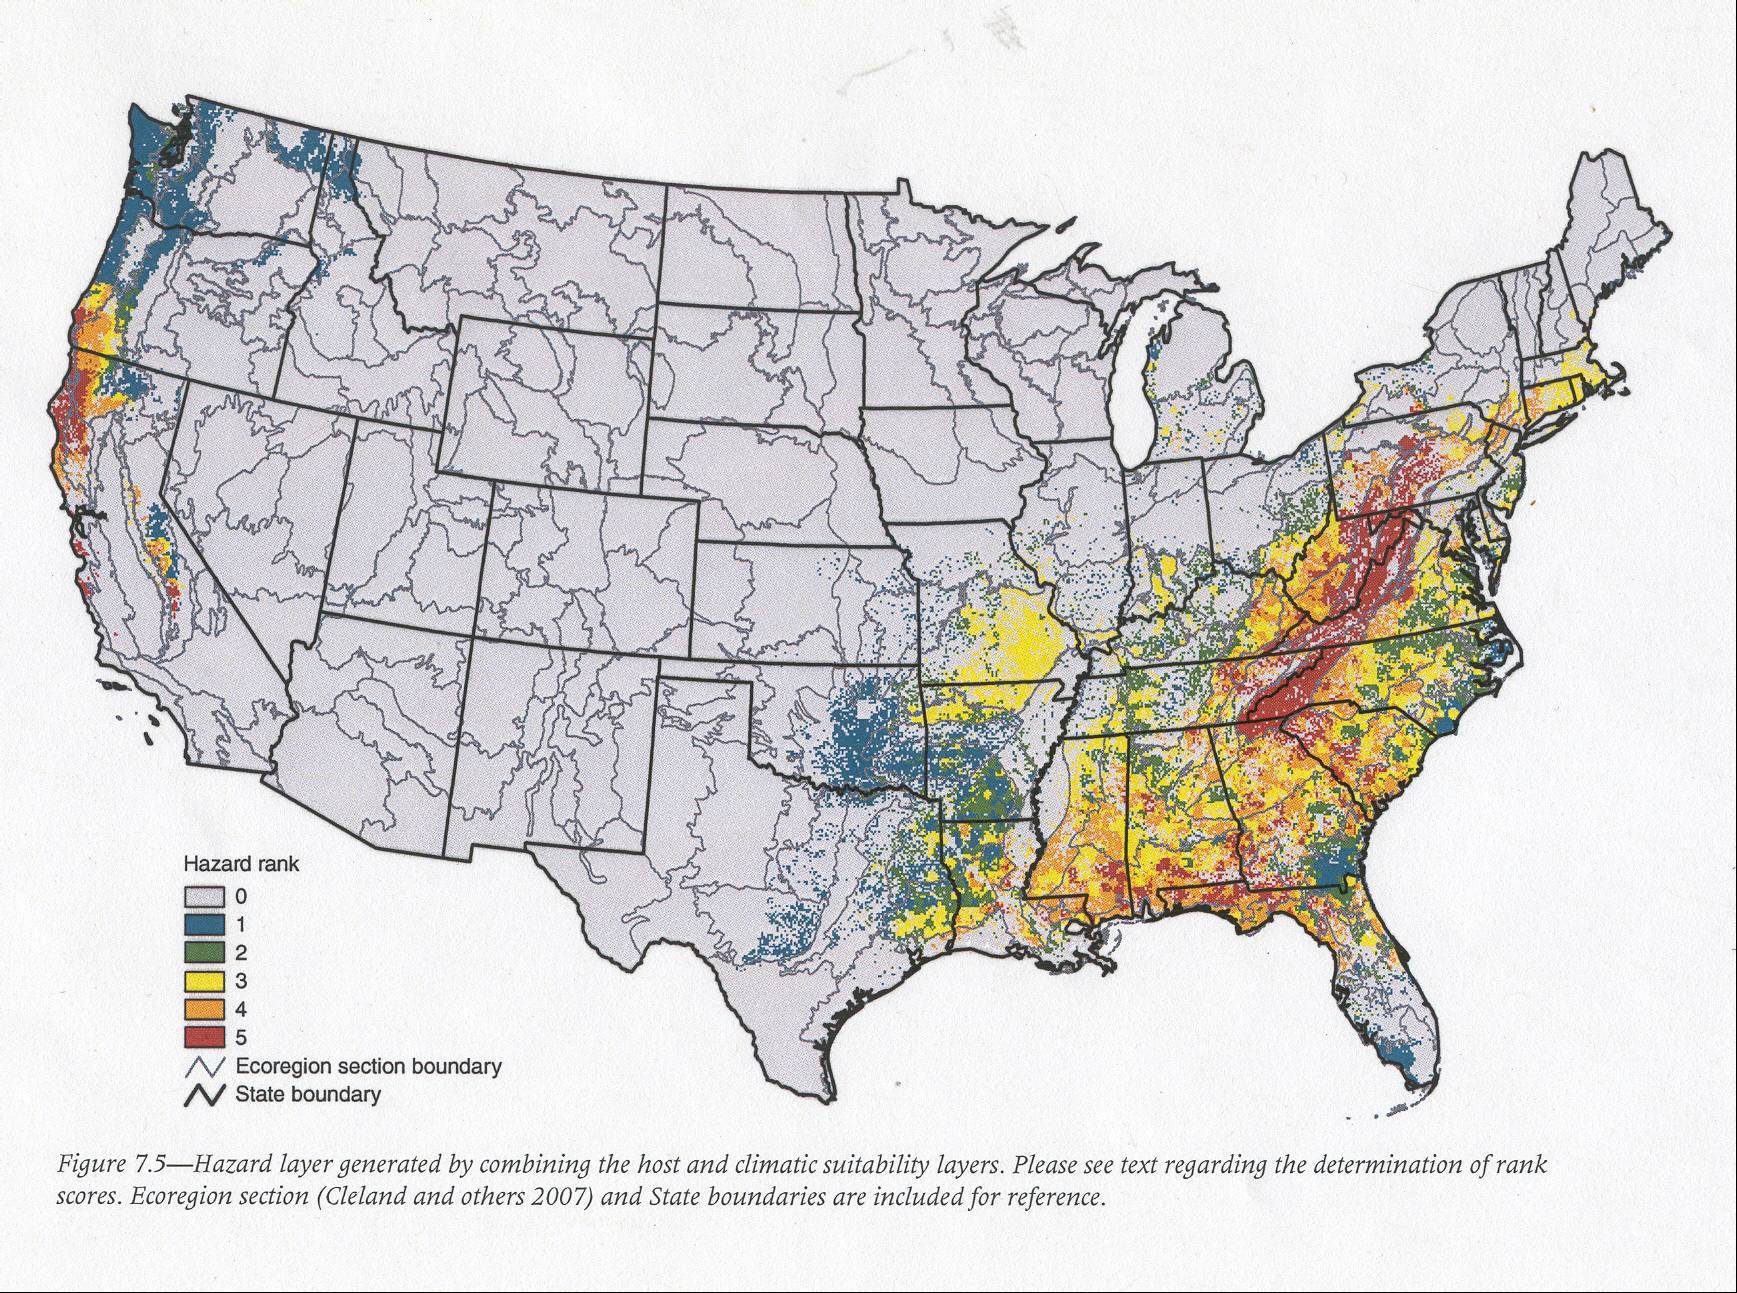
The threat is clear: three of the four known variants are already established in forests of the Pacific Northwest – NA1, NA2, and EU1. (For an explanation of P. ramorum strains and mating types, go here.)

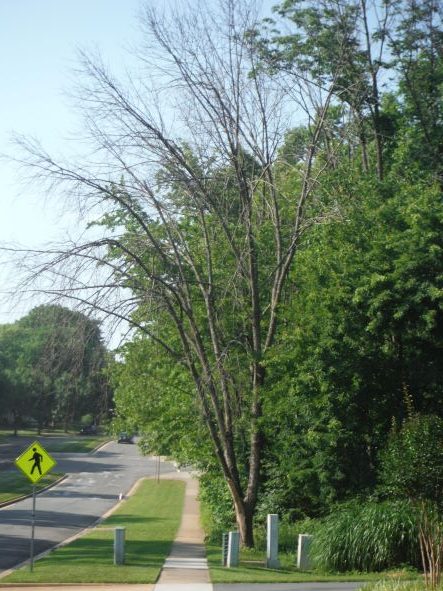
In Oregon, the EU1 strain was detected in a dying tanoak (Notholithocarpus densiflorus) tree in the forests of Curry County in 2015. Genetic analysis revealed that the forest EU1 isolates were nearly identical to EU1 isolates collected in 2012 from a nearby nursery during routine monitoring. This detection was considered to be evidence that multiple distinct P. ramorum introductions had occurred. The scientists expressed concern that the presence of this strain – which is of the A1 mating type while the widely established NA1 population of the pathogen in the forest is of the A2 mating type — makes the potential for sexual recombination more likely. Therefore, the state prioritized eradication of the EU1 forest infestation [Grünwald et al. 2016]. (For an explanation of P. ramorum strains and mating types, go here.)

The NA2 strain was detected in 2021, 33 km north of the closest known P. ramorum infestation. Because Oregonians genotype all detections on the leading front of the infection, they completed Koch’s postulates and found this surprising result [February 2022]. NA2 is thought to be more aggressive than the NA1 lineage [February 2022]. Surveys and sampling quickly determined that the outbreak is well established — 154 positive detections [February 2022] across more than 500 acres [October 2021]. Oregon Department of Forestry immediately began treatments; the goal is to prevent overlap with existing NA1 and EU1 populations. [April 2022; summarizing research by Peterson et al.] Given the number of infected trees and the new variant, Oregon pathologists believe this to be a separate introduction to Oregon forests that has been spreading in the area for at least four years [February 2022].

Scientists [April 2022; summarizing research by Peterson et al.] again note evidence of repeated introductions of novel lineages into the western US native plant communities; this region is highly vulnerable to Phytophthora establishment, justifying continued monitoring for P. ramorum not only in nurseries but also in forests.

SOD in Oregon; photo by Oregon Department of Forestry

The EU1 strain is also present in northern California, specifically in Del Norte County. It was detected there in 2020. Despite removal of infected and nearby host trees (tanoaks) and treatment with herbicide to prevent resprouting, the EU1 strain was again detected on tanoaks in 2021. The detected strain is genetically consistent with the EU1 outbreak in Oregon forests. Oddly, the usual strain found in North American forests, the NA1 strain, was not detected in Del Norte Co. in 2021 [February 2022].

One encouraging research finding [April 2022; summarizing research by Daniels, Navarro, and LeBoldus] is that established treatment measures have had significant impact on both the NA1 & EU1 lineages. They found on average 33% fewer positive samples at treated sites where NA1 is established; 43% reduction in P. ramorum prevalence at EU1 sites. Prevalence of P. ramorum in soil was not affected by treatment.

SOD Spread in Forests

In California, the incidence of new Phytophthora ramorum infections fell in 2021 to a historic low – estimated 97,000 dead trees across 16,000 acres, compared to ~885,000 dead trees across 92,000 acres in 2019 [April 2022]. It is agreed that the reason is the wave of mortality sparked by the very wet 2016-2017 winter has subsided and has been followed by several years of drought [February 2022].

data showing decline in new SOD detections in California in 2021 (no data collected in 2020)

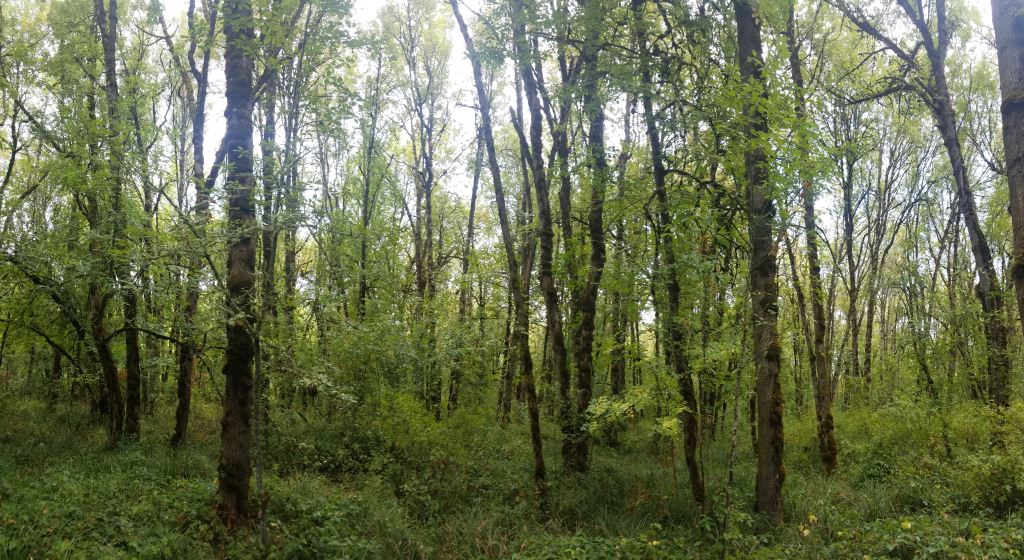
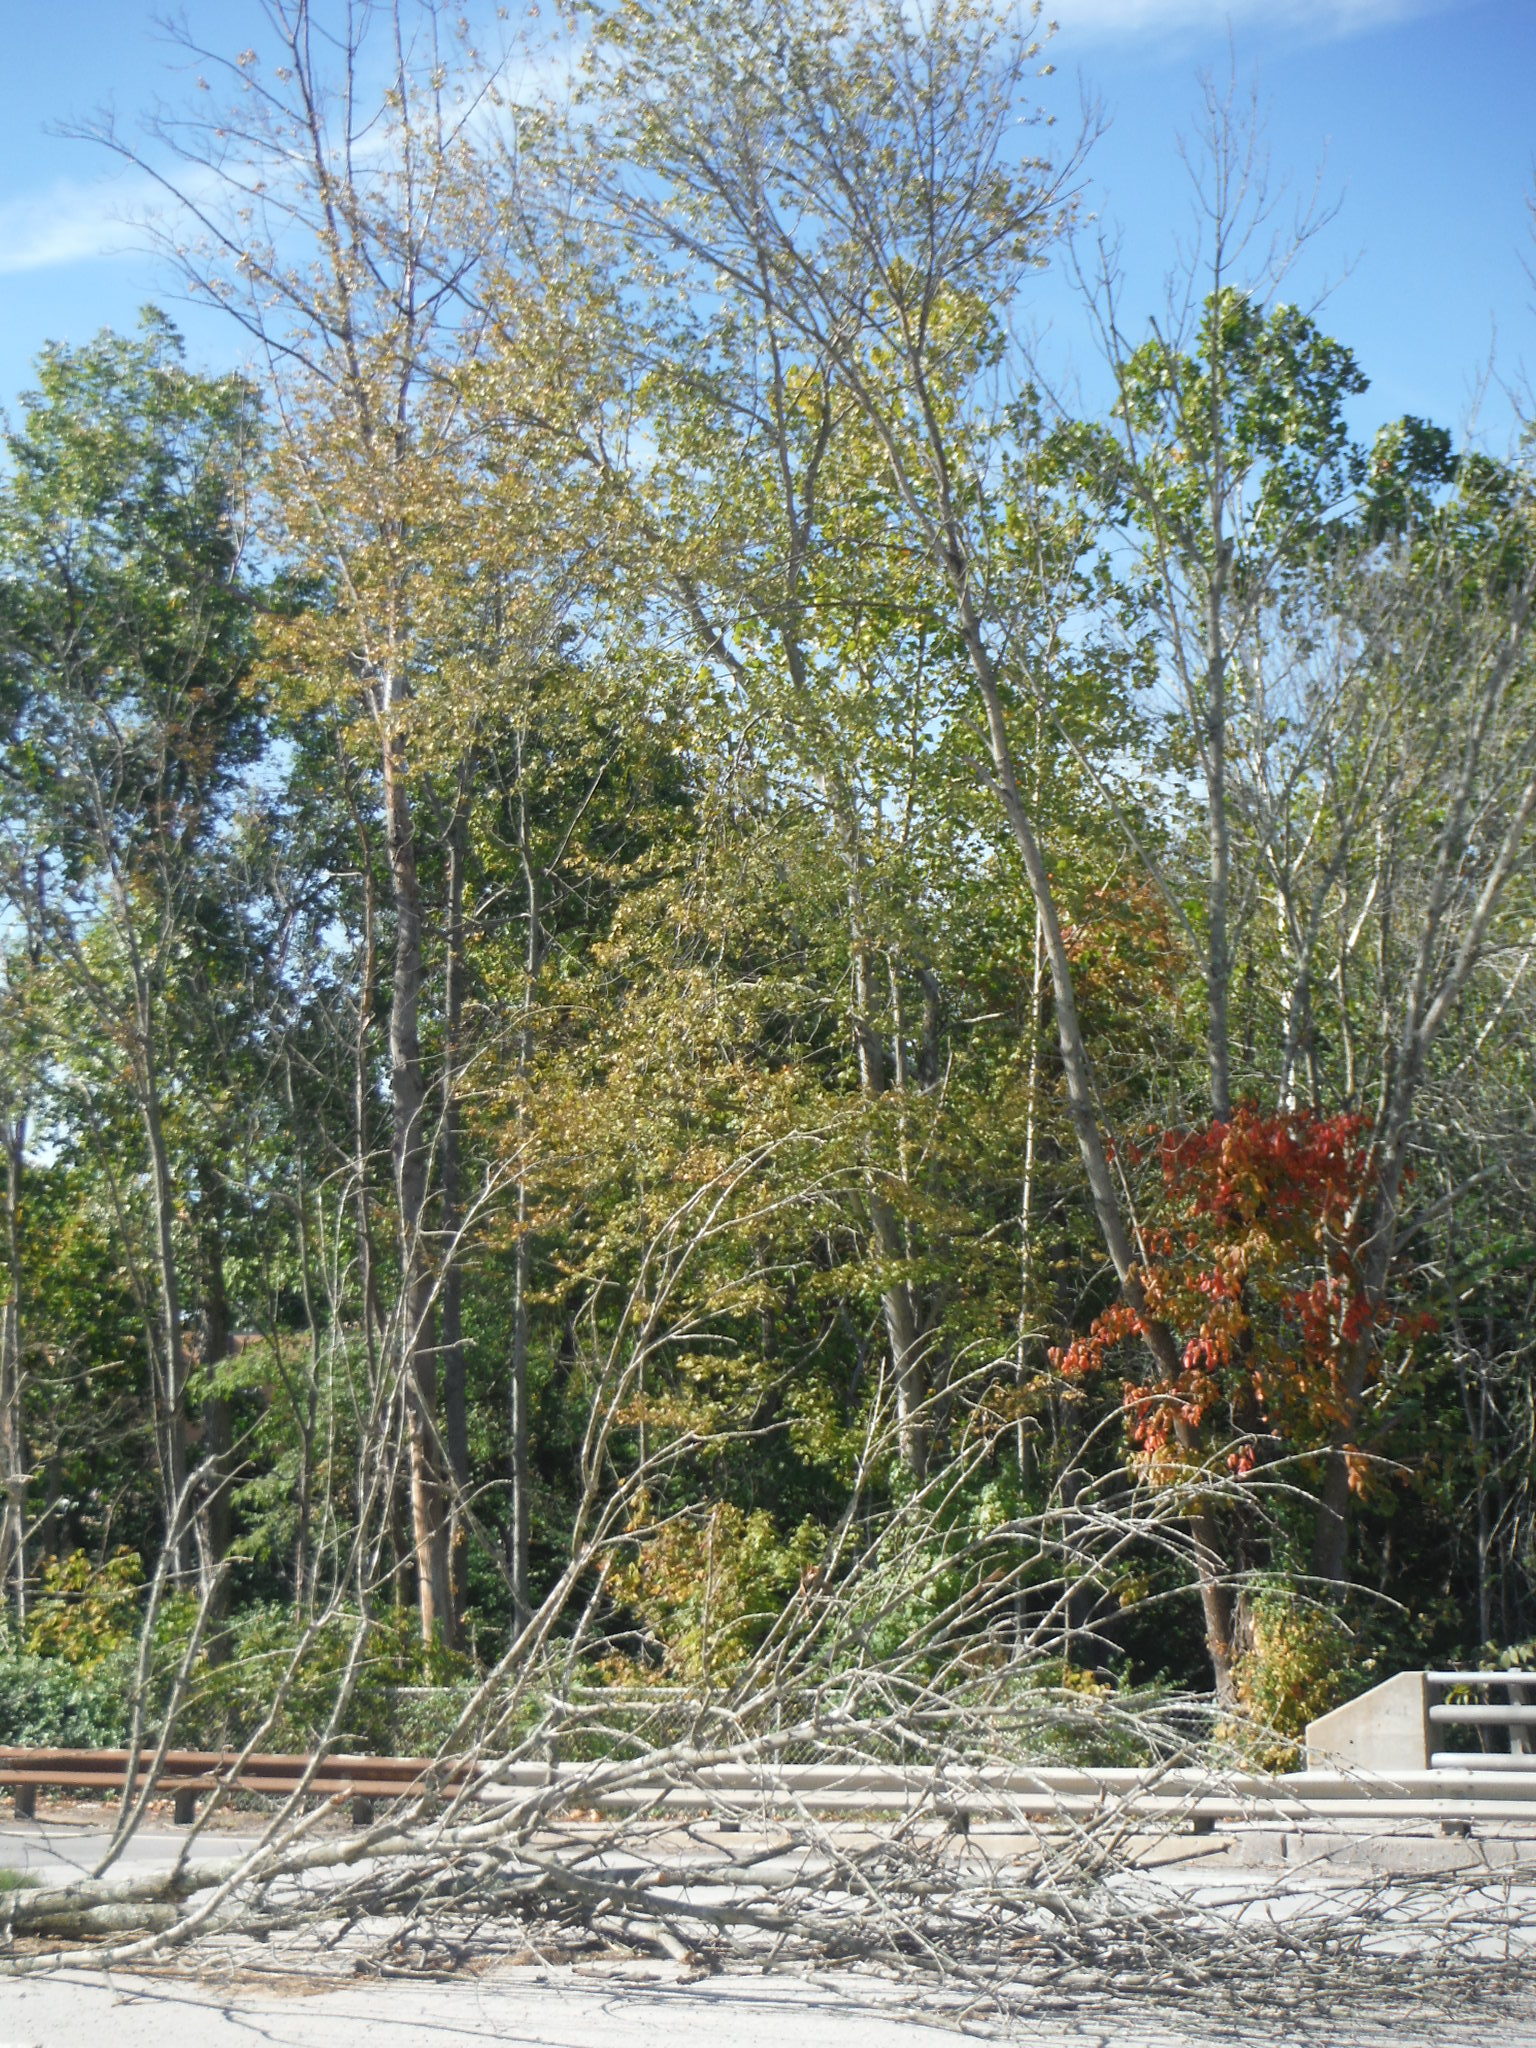
In Oregon, however, SOD continues to spread. In 2010, the OR SOD Program had conceded that eradication was no longer feasible. Instead, authorities created a Generally Infested Area (GIA) where removal of infested tanoaks was now optional (not mandated) on private and state-owned lands. Since then, SOD has continued to spread and intensify within the designated zone. The GIA has been expanded eight times since its establishment in 2012; it now it covers 123 sq. mi. There has also been an immediate increase in tanoak mortality [December 2021].

In 2021, two new infestations were detected outside the GIA. One outbreak is on the Rogue River-Siskiyou National Forest along the Rogue River, 6 miles north of any previously known infestation. The second is just outside Port Orford [February 2022], 33 km north of the closest known infestation. This second infestation is composed of the NA2 variant [see above]. The Oregon Department of Agriculture (ODA) established emergency quarantines at these sites and began eradication efforts at both sites. The Oregon legislature appropriated $1.7 million to Oregon Department of Forestry to carry out an integrated pest management program to slow spread of the disease [February 2022].

Scientific research indicates that this situation might get worse. While it has long been recognized that California bay laurel (= Oregon myrtle) (Umbellularia californica) and tanoak are the principal hosts supporting sporulation and spread, it has now been determined that many other native species in the forest can support sporulation. Chlamydospore production was highest on bigleaf maple (Acer macrophyllum)and hairyCeanothus (Ceanothus oliganthus). All the other hosts produced significantly fewer spores than tanoak and myrtle [October 2021; summarizing research by Rosenthal, Fajardo, and Rizzo]

Furthermore, studies that aggregate observations of disease on all hosts, not paying attention to their varying levels of susceptibility, might lead scientists to misinterpret whether the botanic diversity slows spread of the pathogen [October 2021 summarizing research by Rosenthal, Simler-Williamson, and Rizzo].

Monitoring to detect any possible spread to the East

SOD risk map based on climate & presence of host species; USFS

The USDA Forest Service continues its Cooperative Sudden Oak Death Early Detection Stream Survey in the East. In 2021, 12 states participated – Alabama, Florida, Georgia, Illinois, Maryland, Mississippi, North Carolina, Pennsylvania, South Carolina, Texas, West Virginia, and Wisconsin. Samples were collected from 79 streams in the spring. Two streams were positive, both in Alabama. Both are associated with nurseries that were positive for P. ramorum more than a decade ago [October 2021].

Continued infestations in the nurseries

USDA Animal and Plant Health Inspection Service (APHIS) reported that in 2021, the agency supported compliance activities, diagnostics, and surveys in nurseries in 22 states. P. ramorum was detected at 17 establishments. Eight were new; nine had been positive previously. These included seven nurseries that ship intrastate – all had been positive previously. Six were already under compliance agreements. Also positive were three big box stores – none previously infected; and six nurseries that sell only within one state – five new. Infections at the big box outlets and half the intrastate nurseries were detected as a result of trace-forwards from other nurseries.

P. ramorum was detected in 300 samples in 2021 – 144 from plants in the genus Viburnum; 106 from Rhodendron (including azalea); and much lower numbers from other genera.

APHIS funds states for annual nursery surveys, compliance activities, and diagnostics through the: Plant Protection Act Section 7721 and the Cooperative Agricultural Pest Survey (CAPS) program. Table 4 lists states receiving survey funds. APHIS also supported compliance and diagnostic activities in California, Louisiana, Oklahoma, Oregon, Pennsylvania, Washington, and several states through Florida.

APHIS’ report – which provides few additional  details about the nursery  detections – can be found here.

California:

The California Department of Food and Agriculture (CDFA) reported that three of the eight nurseries regulated under either the federal or state sudden oak death program tested positive in 2021. This was down from five positive nurseries in 2020 [February 2022]. (In the past, numbers of nurseries testing positive have declined during droughts, risen during wet years.) At one interstate-shipping nursery 145 positive Viburnum tinus plants were detected by regulators in December 2021. Apparently the detection efforts were prompted by a trace-back from a nursery in an (unnamed) other state [April 2022].

Oregon:

Oregon continues to struggle with the presence of Phytopththora ramorum in the state’s nurseries. Early in 2021 the situation looked good. Three of eight interstate shippers and two intrastate shippers “passed” their sixth consecutive inspection with no P. ramorum detected so they were released from state and federal program inspection requirements. A fourth interstate-shipping nursery had ceased operating. By the end of the year, however, circumstances had deteriorated. One of the four interstate shippers still under regulatory scrutiny appeared to be badly infested. After routine autumn monitoring detected an infected plant, subsequent delimitation samplings detected 30 additional positive foliar samples and a large number (24) of samples were inconclusive. By spring 2022 six nurseries had to be inspected following trace-forwards from out-of-state nurseries. No P. ramorum was detected in five of these nurseries; the sixth had one positive foliar sample, so it is now under more stringent regulatory supervision [April 2022].

Washington:

Washington has only one interstate shipping nursery that is regulated under APHIS’ program; it tested negative in autumn 2021 [December 2021]. Meanwhile, USDA & Washington Department of Agriculture (WSDA) decided to deregulate the Kitsap County Botanical Garden where P. ramorum had been detected in 2015. Since then, more than 5,000 samples have been collected; 99.1% have tested negative. The last positive plant sample was collected in February 2016. Under a compliance agreement, the botanical garden will continue the best management practices deemed successful in eradicating the pathogen [December 2021]. However, water at the site continues to test positive [February 2022]. These water detections – in Washington and Alabama (above) – raise troubling questions.

Meanwhile, in late winter [April 2022], WSDA had to conduct two trace-forward investigations on plants that shipped from (unnamed) out-of-state nurseries. As of the April newsletter, 13 samples from four locations were all negative.

A stubborn problem has been the persistence of SOD infections in nurseries after the Confirmed Nursery Protocol has been carried out. Research indicates the reason might be that the pathogen is still there in the form of soilborne inoculum in buried, infested leaf debris [December 2021 newsletter; summarizing research by Peterson, Grünwald, and Parke].

Another native tree identified as host

photo by Miguel Vieira; via Wikimedia

Dieback on golden chinquapin, Chrysolepis chrysophylla, a slow growing, evergreen tree native to the U.S. west coast has been confirmed as caused by Phytophthora ramorum. The detection was in a part of Marin County, California heavily infested by P. ramorum since early in the epidemic. Affected trees were large overstory trees. Unlike other hosts in the Fagaceae, there were no external bole cankers [April 2022 newsletter; summarizing research by Rooney-Latham, Blomquist, Soriano, and Pastalka].

SOURCES

Brasier, C.M. 2008. The biosecurity threat to the UK and global environment from international trade in plants. Plant Pathology (2008) 57, 792-808

Grunwald, N.J., M.M. Larsen, Z.N. Kamvar, P.W. Reeser, A. Kanaskie, J. Laine and R. Wiese. 2016. First Report of the EU1 Clonal Lineage of Phytophthora ramorum on Tanoak in an Oregon Forest. Disease Notes. May 2016, Vol. 100, No. 5, p. 1024

Posted by Faith Campbell

We welcome comments that supplement or correct factual information, suggest new approaches, or promote thoughtful consideration. We post comments that disagree with us — but not those we judge to be not civil or inflammatory.

For a detailed discussion of the policies and practices that have allowed these pests to enter and spread – and that do not promote effective restoration strategies – review the Fading Forests report at http://treeimprovement.utk.edu/FadingForests.htm

Harvest + Tree-Killing Pests = Threat to Forest Composion

EAB-killed ash in Ontario; photo by Michael Hunger

Lately I have become aware of articles discussing how silviculturists and timber managers in the East are responding to the threat from introduced pests.

As Holt et al. (2022; full citation at end of blog) point out, private landowners control 56% of U.S. forestland – and 80% in the East. Their collective decisions about managing those forests are one of two factors that largely determine the composition and structure of the forested landscape and the ecosystem services those woodlands provide. The second determining factor is invasive pests. If an invasive pest prompts many landowners across the East to harvest their timber, the collective impact will be enormous. In this way, invasive species carry a double threat: direct mortality of one or more tree species or genera; and stimulation of removal of the host species from the forest by land managers trying to maximize or protect their current and future monetary investment.

Projections suggest that the number of non-native woodborers established in North America will increase three- or four-fold by 2050. If these prove true (see Leung et al. 2016), the impact on eastern North America forests and associated ecosystem services would be profound.

Holt et al. explore how private landowners have responded to an actual invasive species, the emerald ash borer (EAB). They analyze the influence of EAB’s presence on:

(1) annual probability that a landowner would decide to harvest timber on his/her own lands;

(2) intensity of any such harvest (percentage of trees cut); and

(3) diameter of harvested trees.

They examined harvesting of both the host (ash) and non-host species that co-occur.

Using data from U.S. Forest Service permanent inventory plots, they compared harvest levels in counties in which EAB was detected before 2007 to harvest levels in counties that were infected after 2012. To simplify, they omitted counties in which EAB was detected during the period 2007–2012. They excluded plots that did not contain any ash trees; and plots owned by federal or state agencies. They also excluded trees with diameters less than 12.7 cm (5 inches) dbh.

Ash harvests were apparently less widespread than non-ash harvests. Ash trees were harvested on 6% of the USFS Forest Inventory and Analysis (FIA) plots compared to 9% of plots for harvests of non-ash trees. However, a higher proportion of ash basal area was removed in these harvests — 63% of ash basal area versus 32% of non-ash basal area (remember, ash trees were present in all plots).  

The presence of EAB resulted in

  • an increased amount of biomass harvested – by approximately 25% of basal area;
  • harvests contained greater quantities of ash, relative to non-ash species.
  • harvested trees in EAB-infested areas had smaller diameters, on average; this was true of both ash and non-ash species.

Two demographic variables were analyzed. Higher median household income resulted in a lower probability of non-ash harvest. Human population density had no significant effect.

Holt et al. say their findings indicate that a wave of ash removals will follow EAB spread with a potential to alter forest development trajectories and change structural legacies, with consequences for ecosystem services and biodiversity. They consider tree species that co-occur with ash, and that are preferred timber species, are the most likely to be removed in excessive numbers as a result of EAB-induced harvest.

Holt et al. note that ash removals were perhaps underestimated by the study because landowners might have cut their ash before EAB actually was detected in their county.

Managing the Northern Forest – Emphasis on reducing the beech component

Meantime, two other groups are suggesting how forest managers should respond to current challenges, including invasive pests. Both suggest steps to reverse – or at least slow – trends under which American beech (Fagus grandifolia) is becoming more dominant. (Given beech’s ecological importance, this stance bothers me!  I don’t quarrel that many timber-oriented people don’t want more beech.) Neither of these studies considers the possible impact of beech leaf disease and beech leaf miner.  I recently posted a blog link reporting Reed et al.’s (2022) analysis of interactions between BBD and BLD.

Rogers et al. (2022), the first group, note that successful silviculture is the art and science of managing forests intended to achieve human defined goals. Usually this means assuring the “desired” species composition and structure. However, to succeed, silviculture must also consider site conditions, including competing vegetation and changing climates.

They focus on the northern hardwood forest – also called the beech-birch-maple forest. It is broadly defined by the dominance of sugar maple (Acer saccharum), yellow birch (Betula alleghaniensis), and American beech. The northern hardwood forest occupies about 20 M ha across northern United States and southern Canada. From a traditional management perspective, maple and birch are the desired species; American beech is widely considered undesirable.

Unfortunately, from the timber point of view, Rogers et al. expect the abundance of sugar maple and yellow birch to decrease and American beech to increase. Important factors in this trend are soil types; deer numbers and preference for tree species other than beech; and high number of root sprouts stimulated by beech bark disease (BBD). Rogers et al. call for modification of traditional silvicultural approaches in the region. They call specifically for “adaptation planting” (also called “assisted migration”). They note that increased canopy openings – e.g., “irregular shelterwood system” — are important for establishing shade intolerant and mid-tolerant species, among them white ash (Fraxinus americana). They do mention the threat from emerald ash borer.

In an earlier blog I noted that the second group, Clark and D’Amato(2021), called for silvicultural management of New England forests (part of the same northern hardwood forest). Their goal was to maximize carbon sequestration. They advised management to promote retention of eastern white pine (Pinus strobus) and slow takeover by American beech and eastern hemlock (Tsuga canadensis). They say these species will fare poorly in warmer climates. Of course, all these species face non-native pests. See above for beech; hemlock is being decimated by hemlock woolly adelgid. Eastern white pine has apparently survived its own non-native pest, white pine blister rust.

I hope these pest-related hindrances to traditional timber-focused forestry will help convince the U.S. Department of Agriculture and Congressional agriculture and natural resource committees that non-native pests are a significant threat. Clearly past documentation of impacts to biological diversity and native ecosystems have not prompted them to adopt adequate protective measures or to respond effectively to established invaders. See earlier blogs, my recent article, and the Fading Forests reports (link at end of blog) for suggestions on what actions should be taken.

SOURCES

Clark, P.W. and A.W. D’Amato. 2021. Long-term development of transition hardwood and Pinus strobus – Quercus mixedwood forests with implications for future adaptation and mitigation potential. Forest Ecology and Management 501 (2021) 119654

Holt, J.R., J.R. Smetzer, M.E. Borsuk, D. Laflower, D.A. Orwig, J.R. Thompson. 2022. EAB intensifies harvest regimes on private land. Ecological Applications. 2022;32:e2508.

Leung, B., M.R. Springborn, J.A. Turner, E.G. Brockerhoff. 2014. Pathway-level risk analysis: the net present value of an invasive species policy in the US. The Ecological Society of America. Frontiers of Ecology.org

Rogers, N.S., AW. D’Amato, C.C. Kern, S. B`edardd. 2022.  Northern hardwood silviculture at a crossroads: Sustaining a valuable resource under future change

Posted by Faith Campbell

We welcome comments that supplement or correct factual information, suggest new approaches, or promote thoughtful consideration. We post comments that disagree with us — but not those we judge to be not civil or inflammatory.

For a detailed discussion of the policies and practices that have allowed these pests to enter and spread – and that do not promote effective restoration strategies – review the Fading Forests report at http://treeimprovement.utk.edu/FadingForests.htm

Spring wildflowers – why is one valley invaded while neighboring one is not?

I post here photos from two creek valleys in northern Virginia.

The Accotink creek valley is completely overrun by invasive plants … the herbaceous layer is made up of lesser celandine (Ficaria verna Huds; Ranunculus ficaria L.) and – in some places — Leucojum.

Neighboring Pohick creek valley still supports native hebaceous plants – skunk cabbage, spring beauties, trout lillies.

They both flow through wealthier suburbs in Fairfax County.

?????

P.S. In a ditch connecting to Pohick creek I have found this aquatic plant:

Plant is rooted, but leaves float on the water surface. In March the leaves were wide with scalloped edges; by April they are longer – lanceolate? I have seen it nowhere else. Anyone know what it is? Local authorities say it is not water chestnut (Trapa).

Posted by Faith Campbell

We welcome comments that supplement or correct factual information, suggest new approaches, or promote thoughtful consideration. We post comments that disagree with us — but not those we judge to be not civil or inflammatory.

For a detailed discussion of the policies and practices that have allowed these pests to enter and spread – and that do not promote effective restoration strategies – review the Fading Forests report at http://treeimprovement.utk.edu/FadingForests.htm

Plants Depend on Animals – and They are Disappearing

black berry eating hawthorn berries; photo by Paul D. Vitucci

Articles by Evan Fricke and colleagues remind us to look more broadly at bioinvasion to consider the impact on ecosystem function and evolution. They focus on animal interactions with plants in the shared environment, especially animals’ role as seed dispersers.

The authors also remind us that natural barriers explain why there are different species in different areas and thus how evolution and speciation follow different paths in different places. Think of Galapagos finches evolving in isolation from a few ancestors that somehow made it over the ocean from mainland South America.

These points are made in two recent articles.

In the first, Fricke and Svenning 2020 (full citation at end of this blog) note that about half of all plant species depend on animals to disperse their seeds. Animal seed dispersal is influenced by several drivers of global change, including local or generalized extinction (= defaunation); bioinvasion; and habitat fragmentation. The decline of large vertebrates has a particularly important role in these interactions.

Their study focused on fleshy-fruited plants that are dispersed by animals. (The study does not include nuts, e.g., acorns, which are presumably subject to some of the same pressures.) They expect evolution of the affected plants and animals to proceed differently as a result of the new partnerships, but they did not study any such interactions.

Their study covered animal seed-dispersal interactions with plants at 410 locations. The data encompassed 24,455 unique animal-plant pairs involving 1,631 animal and 3,208 plant species. Three quarters of the animals were birds; most of the rest were mammals, primarily bats and primates. Only 1% were in other animal groups – lizards, tortoises, or fish.

fruit bats on Luzon, Philippines; photo by Francesco Vernonesi; Flickr.com

They found that introduced plants and animals are twice as likely as native species to interact with introduced partners. The resulting interactions are likely to amplify biotic homogenization in future ecosystems. Already, introduced species have largely replaced missing native frugivore species in some places. In fact, mutualisms in which either or both the plant and animal is an introduced species are now about seven times higher than decades ago.

These mutual-benefit interactions of introduced species are even more prevalent in areas where human modification of the environment is greater. The proportion of introduced species and of novel interactions caused by introduced plant or animal species was higher for oceanic island systems than for continental bioregions. This finding adds a new dimension to the already recognized heightened susceptibility of remote islands to invasion and their loss of native species. Continental bioregions’ networks typically had few introduced animals and a greater prevalence of intro plants than animals.

Fricke and colleagues think plant-frugivore networks are likely to increasingly favor a relatively few introduced generalists over many native species, reducing the uniqueness of future biotas. The result might be to reduce resilience of terrestrial ecosystems by, first, allowing perturbations to propagate more quickly; and, second, by exposing disparate ecosystems to similar drivers. They called for giving higher priority to managing increasing ecological homogenization.

In the second article, Fricke, Ordonez, Rogers, and Svenning (2022) note that climate change requires many plant species to shift their populations hundreds of meters to tens of kilometers per year to track their climatic niche. Earth is also experiencing the formation of novel communities as species introductions and shifting ranges result in co-occurrence of species that do not share co-evolutionary history. They conclude that the novel mutualistic interaction networks will influence whether certain plant species persist and spread.

These authors examined four scenarios to assess how current long-distance dispersal has been affected by past defaunation and invasion and how it is threatened by species endangerment. These scenarios are as follows:

1st scenario (current scenario) = natural and introduced ranges of extant species today.

2nd scenario (natural scenario) = mammal and bird ranges as they would be if unaffected by extinctions, range contractions, or introductions.

3rd scenario (extinction scenario) = those bird and mammal species listed as vulnerable or endangered by the IUCN go extinct.

4th scenario (extirpation of introduced species scenario) = introduced species are extirpated.

Fricke and colleagues estimate that extinction of at least local populations of seed-dispersing mammals and birds has already reduced the capacity of plants to track climate change by 60% globally. The effect is strongest in temperate regions and regions with little topographic complexity. Two examples are eastern North America and Europe. These regions face a double threat: rapid climate change and loss of large mammals that provided long-distance dispersal.

The extinction scenario is most evident in Southeast Asia and Madagascar. The remaining animal seed dispersers are already threatened or endangered. Fricke and colleagues project that future loss of vulnerable and endangered species from their current ranges would result in a further reduction of 15% in the capacity of plants to track climate change.

The contrary situation is found on islands which have few native mammals. Introduced species are now important long-distance seed dispersers. In some cases, the introduced animals are dispersing invasive plant seeds, e.g., on Hawai`i feral hogs are spreading the invasive plant strawberry guava (Psidium cattleianum).

strawberry guava on Maui; photo by Forest and Kim Starr

People’s actions have resulted in ecoregions disproportionately losing the species that provide long-distance seed dispersal function, i.e., large mammals. In other words, human activities have caused not only rapid climate change—requiring broad-scale range shifts by plants—but also defaunation of the birds and mammals needed by plants to do so. Habitat fragmentation and other land-use changes will likely amplify existing constraints on plant range shifts.

Fricke and colleagues say their findings emphasize the importance of not only promoting habitat connectivity to maximize the functional potential of current seed dispersers but also restoring biotic connectivity through the recovery of large-bodied animals to increase the resilience of vegetation communities under climate change.

SOURCES

Fricke, E. C., & Svenning, J. C. (2020). Accelerating homogenization of the global plant–frugivore meta-network. Nature585(7823), 74-78. https://www.nature.com/articles/s41586-020-2640-y

Fricke, E. C., Ordonez, A., Rogers, H. S., & Svenning, J. C. (2022). The effects of defaunation on plants’ capacity to track climate change. Science375(6577), 210-214. https://www.science.org/doi/full/10.1126/science.abk3510

Posted by Faith Campbell

We welcome comments that supplement or correct factual information, suggest new approaches, or promote thoughtful consideration. We post comments that disagree with us — but not those we judge to be not civil or inflammatory.

For a detailed discussion of the policies and practices that have allowed these pests to enter and spread – and that do not promote effective restoration strategies – review the Fading Forests report at http://treeimprovement.utk.edu/FadingForests.htm

APHIS – 50 years + plant pest detection month

beech leaf disease – Not one of the plant pests that APHIS is regulating! Photo by Jennifer Koch, USFS

APHIS has reminded us that 2022 is the agency’s 50th year. In its press release, APHIS claims several accomplishments over this period:

  • Eradicating plant pests like European grapevine moth and plum pox from the country, while reducing the impact of others plant diseases, including boll weevil and Mediterranean and Mexican fruit flies;
  • Eradicating serious animal diseases, including highly pathogenic avian influenza, virulent Newcastle disease, and pseudorabies, from the country’s herds and flocks, while reducing the prevalence of other animal diseases like bovine tuberculosis and brucellosis;
  • Improving care for laboratory animals, exhibited animals and other animals;
  • Ensuring genetically engineered plants do not pose a risk to plant health, while keeping up with the ever-changing technology in this field;
  • Reducing the impact of wildlife damage on agriculture and natural resources; and
  • Ensuring safe trade of agriculture commodities across the globe

APHIS also launched a new page on its website to share a series of visual timelines of its history and important milestones.

APHIS also states that USDA) has declared April 2022 to be Invasive Plant Pest and Disease Awareness Month (IPPDAM). The link Invasive Plant Pest and Disease Awareness Month connects you to APHIS’ webpage. Secretary Vilsack asks people to be alert. He noted particularly the risk that pests will hitch a ride on untreated firewood, outdoor gear and vehicles, and soil, seeds, homegrown produce, and plants.

The notice urges people to:

  • Familiarize yourself with the invasive pests that are in your area, and their symptoms. [Faith says – also look for pests not “here” yet – early detection!]
  • Look for signs of new invasive plant pests and diseases and report them to your local Extension officeState department of agriculture or your USDA State Plant Health Director’s office.
  • When returning from travel overseas, declare all agricultural items to U.S. Customs and Border Protection so they can ensure your items won’t harm U.S. agriculture or the environment.
  • Don’t move untreated firewood. Buy local or use certified heat-treated firewood, or responsibly gather it on site where permitted.
  • Source your plants and seeds responsibly. When ordering online, don’t assume items available from foreign retailers are legal to import into the United States. Learn how to safely and legally order plants and seeds online.
  • Don’t mail homegrown plants, fruits and vegetables. You may live in an area under quarantine for a harmful invasive plant pest. You could inadvertently mail a pest.
  • When in doubt, contact your local USDA State Plant Health Director’s office to find out what you need to do before buying seeds or plants online from an international vendor or before mailing your homegrown agricultural goods.

West Coast Responding to EAB

nearly pure stand of Oregon ash in Ankeny National Wildlife Refuge, Oregon; photo by Wyatt Williams, Oregon Department of Forestry

While Michiganders document the impacts of the emerald ash borer (EAB) there, conservationists on the West Coast are jump-starting efforts to save their regional species, Oregon ash (Fraxinus latifolia). Earlier field tests in the Midwest showed that EAB will attack Oregon ash (press release) – something West Coast state would like to counter as early and effectively as possible.

Oregon ash is a wide-ranging species, occurring from California to Washington and possibly into British Columbia. The species has not been studied extensively (it is not a timber species!), but it is clearly an imponearlrtant component of riparian forests. In wetter parts of the Willamette Valley, ash is the predominant tree species. See the photo of the riparian forest in the Ankeny National Wildlife Refuge; this forest is nearly 100% Oregon ash (ODA/ODF EAB Response Plan).

As is true in the Midwest, ash provides important food and habitat resources along creeks and rivers where seasonally high water-tables can exclude nearly all other tree species. Standing and fallen dead ash biomass can alter soil chemistry and affect rates of decomposition, nutrient, and water cycling, i.e., nutrient resource availability for the remaining trees. Gaps in tree canopy can increase soil erosion, stormwater runoff and elevated stream temperatures. In dense stands of Oregon ash, understory vegetation is often sparse, consisting primarily of sedges. The authors of the Response Plan anticipate invasion by non-native plants into canopy gaps caused by the loss of ash trees as a result of an EAB invasion. In Michigan, though, it is the sedges that dominate these gaps.

The Oregon Department of Forestry, the state Department of Agriculture, and other entities have actively participated in “don’t move firewood” campaigns for at least a decade. The Departments of Forestry and Agriculture also led a team that prepared the EAB Response Plan in 2018 (full citation at the end of this blog). It lays out in considerable detail the roles of both government agencies and non-governmental stakeholders. Oregon’s quarantine is broad, covering all insects not on an approved list (Williams, pers. comm.)

California has inspected incoming firewood for years. In April 2021 – after APHIS terminated the federal quarantine on EAB — California Department of Food and Agriculture established a state quarantine on the beetle and articles that could transport it into the state. In doing so, CDFA noted that commercially grown olive trees might also be at risk to EAB.

Washington State operates a statewide trapping program for invasive insects. There has also been significant attention to non-native insect threats to urban forests. These have included a study in 2016 led by the Washington Invasive Species Council (WISC). It involved a partnership of WISC with the Washington Department of Natural Resources Urban and Community Forestry Program as well as and statewide stakeholder meetings [Bush, pers. comm.].

Of these various state-wide initiatives, the institutions in Oregon appear to be most pro-active. The Tualatin Soil and Water Conservation District provided $10,000 to fund some of the genetics work and testing for EAB resistance. Other funding came from the USDA Forest Service Forest Health Protection unit of State and Private Forestry (not from USFS’ Research Program). As described by USFS geneticist Richard Sneizko in an article in the publication TreeLine (full citation at end of blog), participants hope to find at least some level of genetic resistance to EAB. Any such resistance might be deployed in several ways: 1) promoting reproduction by resistant trees to enhance their numbers before EAB gets to Oregon; 2) using seeds from resistant trees for restoration of natural areas; or 3) cross-breeding resistant trees to build genetically diverse stocks of resistant trees for future restoration.

Participants think it is vitally important to work from seeds collected over much of the range of Oregon ash – first, to search for probably very rare resistant trees; and second, to preserve the full diversity of the tree species’ genome so that restored ash will be adapted to the wide variety of conditions in which ash grow.

Participants in this effort include the forest genetics/tree improvement community – specifically, the USDA Forest Service Dorena Genetic Resource Center (located in Cottage Grove, Oregon) and Washington State University at Puyallup Research & Extension Center. Also engaged is the public gardens community, specifically the Huntington Botanical Gardens in San Marino, Los Angeles County.  The garden is collecting seed of Oregon and other western ashes from California and Washington State.

The first step in assessing resistance is collecting seed from ash trees across the range of Oregon ash. This began in 2019. Carried out by, inter alia, some USFS and Interior’s Bureau of Land Management units, Oregon State University, citizen scientists [Sniezko] and the Oregon Department of Forestry [press release & Sniezko pers. comm.] Also, some seeds were collected in Washington State in 2020. Additional collections in Oregon are scheduled for 2022.

The collected seeds have been evaluated for vitality and stored by the USFS Dorena Center and at the USFS National Seed Lab (Macon, GA).

Oregon ash planting at Dorena; photo by Emily Boes

The USFS Dorena Center and Washington State University have begun germinating and growing some of the seedlings for various tests of possible resistance. There is concern that the 2021 drought might have killed some of the seedlings in Oregon; those in Washington are not affected. The initial seedlings are mostly from Oregon but there is space to add additional families from a wider geographical area. Experimenters plan to collect data annually on bud break, yearly growth, and any diseases or pests that develop on the trees. (Chastagner pers. comm.)

The next step is systematic testing whether some of the ash show genetic resistance to EAB. Richard Sneizko has sent seedlings of 17 ash families to USFS colleague Dr. Jennifer Koch. She operates a breeding facility in northern Ohio where they can be tested for resistance. Testing is expected to begin this year. [Tree Line]

The Dorena Center is also helping a researcher at Penn State University, Dr. Jill Hamilton, to set up a landscape genomics project. She will evaluate the genetic variability in the species by using leaf samples from about 20 trees from many populations across the Oregon ash’s range (California to British Columbia).  This potentially includes a collection from the Dorena population of ash in late Spring 2022. [Sniezko]

These various ash plantings can also be “sentinel” plantings to assist in early detection of newly arriving EAB. [Tree Line]

SOURCES

Bush J. Executive Coordinator | Washington Invasive Species Council

ODF and ODA Emerald Ash Borer Readiness and Response Plan. 2018. 

ODF press release Feb 24, 2022

Treeline Newsletter May 13, 2021. Richard Sniezko. Is There a Future for Oregon Ash? Forest Genetics to the Rescue? Genetic & Emerald Ash Borer Resistance Projects https://www.nnrg.org/wp-content/uploads/2022/02/Treeline_newsletter-June-2021.pdf

The newsletter is issued by Bonneville Environmental Foundation for a consortium of conservation agencies

Sniezko pers comm Feb 2022  22-2/24

A video explaining the campaign to save Oregon ash is at https://youtu.be/uZmfLrxEA7g or https://youtu.be/S8y-XK285S8

Posted by Faith Campbell

We welcome comments that supplement or correct factual information, suggest new approaches, or promote thoughtful consideration. We post comments that disagree with us — but not those we judge to be not civil or inflammatory.

For a detailed discussion of the policies and practices that have allowed these pests to enter and spread – and that do not promote effective restoration strategies – review the Fading Forests report at http://treeimprovement.utk.edu/FadingForests.htm

In Michigan: Devastating News for Black Ash; Merely Bad News for Green Ash

results of EAB infestation; photo by Nate Siegert, USFS

A series of studies by Patrick J. Engelken, M. Eric Benbow, Deborah G. McCullough, Nate Siegert, Randall Kolka, Melissa Youngquist and others examine the status of ash (Fraxinus spp.) in the aftermath of the emerald ash borer (EAB) invasion. Initial studies documented the crash of biomass supporting EAB numbers when the large ash trees died (Siegert, Engelken, McCullough. 2021; full citation at end of blog.) More recent studies have focused on bogs and forests in the riparian areas where ash were especially numerous and arguably ecologically most important. I posted a blog about black ash bogs earlier.

I will focus here on the studies in riparian areas of southern and northwest Michigan. Information about impacts in forests of southern Michigan are from Engelken, Benbow and McCullough (2020); information about impacts in northwest Michigan are from Engelken and McCullough (2020). Full citations for both are at the end of the blog.

All study areas had high ash densities before EAB’s arrival. One study (Engelken and McCullough 2020) found ash densities high in the immediate riparian areas (in one case, a strip reaching 100 meters from the streambank) but scattered in surrounding forests.

In all these study areas, populations of mature (reproductive age) ash crashed within 10-15 years after EAB invasion:

  • In northeast Michigan, EAB carrying capacity was reduced by 94% – 99%; total ash basal area was reduced by 87 – 97.7% (Siegert, Engelken, McCullough. 2021);
  • In southern Michigan, more than 85% of the basal area of green (F. pennsylvanica) and black ash (F. nigra) had been killed by 2020. An estimated 96% of the overstory ash phloem area had died, thus radically reducing EAB carrying capacity (Engelken, Benbow and McCullough 2020);
  • In northwest Michigan, more than 95% of the overstory ash have been killed. (Engelken and McCullough 2020).

The worst impact has been on black ash– which plays such an important ecological role in riparian areas and wetlands and has enormous importance in Native American cultures. In all these study areas, there is no stump sprouting by black ash (Siegert, Engelken, McCullough. 2021; Engelken, Benbow and McCullough 2020; Engelken and McCullough 2020). In three watersheds of northwest Michigan where black ash constituted up to a quarter of the overstory species before the EAB invasion, scientists found no black ash recruits, only eight saplings, and a single seedling.

Green ash (F. pennsylvanica) has survived in much higher numbers – so far. However, this species’ ability to grow into reproductive size is still uncertain. In northwest Michigan, green ash saplings are abundant in canopy gaps created by EAB-caused mortality of mature ash. These saplings had established before the EAB invasion so some call them the “orphaned cohort”.  However, there are few seedlings of any woody plant species in these gaps because sedges form such dense mats.

Green ash reproduction faces many challenges before persistence of the species can be considered assured.  First, populations of EAB – now reduced by the lack of mature ash to support them – might resurge when young ash grow to larger sizes. It is not yet clear the extent to which introduced biocontrol agents and native predators, e.g., woodpeckers, will protect these trees as they grow to reproductive size. Here, again, green ash has an advantage over black ash. While green ash produce seed at a relatively young age, black ash don’t produce seed until they reach 30–40 years. Even then, they produce seeds only sporadically, with intervals of five or more years.

A second challenge is the lack of seed sources – at least until and unless young trees are able to reach reproductive size.

A third challenge is competition for resources from other plants. The canopy gaps eliminate competition for light for the taller plants, i.e., the existing ash saplings. However, the sapling cohort is not supported by a seedling cohort. There are very few seedlings of all woody plant species (including invasive species!). Seed germination is suppressed by the dense mats of wetland-adapted sedges and possibly the higher water tables (which resulted from reduced evapotranspiration following mortality of the mature trees).

Competition for resources is also a factor in the forests outside the immediate riparian zone. There, ash seedlings sprout, but shade created by lateral ingrowth suppresses their growth. In southern Michigan, Engelken, Benbow and McCullough (2020) note that the forests are apparently transitioning from red oak dominated forests to red maple and black cherry dominated forests. This transition is apparently intensified by forest mesophication resulting from reduced fire frequency, decreasing light availability in forest understories and increasing soil moisture content.

Fourth, while stump sprouting of green ash was noted in southern Michigan, in the northwestern forests all the sprouts died. I have already noted the absence of stump sprouting by black ash at all sites.

Beaver & Green Ash in Northern Virginia

photos of beaver feeding on ash saplings in northern Virginia; photos by F.T. Campbell

In spring 2022 I noticed along one stream in northern Virginia that beavers had cut down green ash saplings; McCullough and Siegert report that this does not appear to be a problem in their study areas.

By December 2022, the beaver-cut trees tried to recover: see the sprouts from a stump [below]. (I think deer or rabbits ate the tips of the sprouts.)

The beavers also continued feeding on the ash — the tree photographed in the spring when it was half-chewed through has now been felled and its branches removed [see below].

Ecosystem Impacts, Especially on Streams

Across much of the upper Midwest, massive ash mortality is causing widespread changes in forest systems.

Riparian forests, i.e., areas adjacent to waterways where periodic inundation occurs, are functionally linked to the aquatic systems. Loss of such a significant proportion of the overstory changes the transfer of energy to adjacent waterways that takes the form of inputs of nutrients from leaf litter and coarse woody debris. Intact forests also stabilize stream banks and maintain channel depth by preventing erosion. Forests moderate temperature of the water. Finally, forests with “coarse woody debris” increase habitat structure. These impacts might be especially important along first order streams, (defined as perennial streams that have no permanently flowing tributaries). These streams are too small to buffer the impacts of major tree loss. The scientists say they are uncertain whether these changes continue to affect larger streams downstream.

Unshaded streams have higher water temperatures that can affect populations of fish, in particular salmonids, by delaying migration, reducing egg viability and increasing egg mortality. Higher temperatures can also alter primary productivity of aquatic algae, potentially increasing eutrophication (Engelken and McCullough 2020).

The scientists expect increasing abundance of coarse woody debris in the forests and streams of northwest Michigan as the 75% of dead ash that are still standing fall. Such debris provides nutrients and habitat for an array of plants and animals, thereby influencing the abundance, activity and species compositions of several ground dwelling insects and seedling establishment. In streams, coarse woody debris provides complex habitat and refuges. It also retains organic matter. Recreationists do find that debris impedes boating.

Loss of ash specifically 

As described by Engelken, Benbow and McCullough (2020), and in my earlier blog, ash leaf litter – particularly black ash leaf litter – is highly nutritious. Ash leaf litter has efficient turnover rates and contributes important soil nutrients such as nitrogen, organic carbon and exchangeable cations. Invertebrate communities in headwater streams feed largely on coarse organic material such as leaf litter (Engelken and McCullough 2020). Consequently, loss of the annual influx of ash leaf litter will likely have adverse effects on nutrient availability in riparian forests and adjacent streams.

SOURCES

Engelken, P.J., M.E. Benbow, D.G. McCullough. 2020. Legacy effects of emerald ash borer on riparian forest vegetation and structure.  Forest Ecology and Management 457 (2020) 117684

Engelken, P.J. and D.G. McCullough. 2020. Riparian Forest Conditions Along Three Northern Michigan Rivers Following Emerald Ash Borer Invasion. Canadian Journal of Forest Research.

Siegert, N.W., P.J. Engelken, D.G. McCullough. 2021 Changes in demography and carrying capacity of green ash and black ash ten years after emerald ash borer invasion of two ash-dominant forests. Forest Ecology and Management Vol 494, August 2021

Posted by Faith Campbell

We welcome comments that supplement or correct factual information, suggest new approaches, or promote thoughtful consideration. We post comments that disagree with us — but not those we judge to be not civil or inflammatory.

For a detailed discussion of the policies and practices that have allowed these pests to enter and spread – and that do not promote effective restoration strategies – review the Fading Forests report at http://treeimprovement.utk.edu/FadingForests.htm

What Do Invasive Species Cost?

brown tree snake Boiga irregularis; via Wikimedia; one of the species on which the most money is spent on preventive efforts

In recent years a group of scientists have attempted to determine how much invasive species are costing worldwide. See Daigne et al. 2020 here.

Some of these scientists have now gone further in evaluating these data. Cuthbert et al. (2022) [full citation at end of blog] see management of steadily increasing numbers of invasive, alien species as a major societal challenge for the 21st Century. They undertook their study of invasive species-related costs and expenditures because rising numbers and impacts of bioinvasions are placing growing pressure on the management of ecological and economic systems and they expect this burden to continue to rise (citing Seebens et al., 2021; full citation at end of blog).

They relied on a database of economic costs (InvaCost; see “methods” section of Cuthbert et al.) It is the best there is but Cuthbert et al. note several gaps:

  • Only 83 countries reported management costs; of those, only 24 reported costs specifically associated with pre-invasion (prevention) efforts.
  • Data comparing regional costs do not incorporate consideration of varying purchasing power of the reporting countries’ currencies.  
  • Data available are patchy so global management costs are probably substantially underestimated. For example, forest insects and pathogens account for less than 1% of the records in the InvaCost database, but constitute 25% of total annual costs ($43.4 billion) (Williams et al., in prep.) .

Still, their findings fit widespread expectations.  

These data point to a total cost associated with invasive species – including both realized damage and management costs – of about $1.5 trillion since 1960.  North America and Oceania spent by far the greatest amount of all global money countering bioinvasions. North America spent 54% of the total expenditure of $95.3 billion; Oceania spent 30%. The remaining regions each spent less than $5 billion.

Cuthbert et al. set out to compare management expenditures to losses/damage; to compare management expenditures pre-invasion (prevention) to post-invasion (control); and to determine potential savings if management had been more timely.

Economic Data Show Global Efforts Could Be – But Aren’t — Cost-Effective

The authors conclude that countries are making insufficient investments in invasive species management — particularly preventive management. This failure is demonstrated by the fact thatreported management expenditures ($95.3 billion) are only 8% of total damage costs from invasions ($1.13 trillion). While both cost or losses and management expenditures have risen over time, even in recent decades, losses were more than ten times larger than reported management expenditures. This discrepancy was true across all regions except the Antarctic-Subantarctic. The discrepancy was especially noteworthy in Asia, where damages were 77-times higher than management expenditures.

Furthermore, only a tiny fraction of overall management spending goes to prevention. Of the $95.3 billion in total spending on management, only $2.8 billion – less than 3%  – has been spent on pre-invasion management. Again, this pattern is true for all geographic regions except the Antarctic-Subantarctic. The divergence is greatest in Africa, where post-introduction control is funded at more than 1400 times preventive efforts. It is also significant for Asia and South America.

Even in North America – where preventative actions were most generously funded – post-introduction management is funded at 16 times that of prevention.

Cuthbert et al. worry particularly about the low level of funding for prevention in the Global South. They note that these conservation managers operate under severe budgetary constraints. At least some of the bioinvasion-caused losses suffered by resources under their stewardship could have been avoided if the invaders’ introduction and establishment had been successfully prevented.

While in the body of the article Cuthbert et al. seem uncertain about why funding for preventive actions is so low, in their conclusions they offer a convincing (to me) explanation. They note that people are intrinsically inclined to react when impact becomes apparent. It is therefore difficult to motivate proactive investment when impacts are seemingly absent in the short-term, incurred by other sectors, or in different regions, and when other demands on limited funds may seem more pressing. Plus efficient proactive management will prevent any impact, paradoxically undermining evidence of the value of this action!

Aedes aegypti mosquito; one of the species on which the most money is spent for post-introduction control; photo by James Gathany; via Flickr

Delay Costs Money

The reports contained in the InvaCost database indicate that management is delayed an average of 11 years after damage was first been reported. Cuthbert et al. estimate that these delays have caused an additional cost of about $1.2 trillion worldwide. Each $1 of management was estimated to reduce damage by $53.5 in this study. This finding, they argue, supports the value of timely invasive species management.

They point out that the Supplementary Materials contain many examples of bioinvasions that entail large and sustained late-stage expenditures that would have been avoided had management interventions begun earlier.

Although Cuthbert et al. are not as clear as I would wish, they seem to recognize also that stakeholders’ varying perceptions of whether an introduced species is causing a detrimental “impact” might also complicate reporting – not just whether any management action is taken

Cuthbert et al. are encouraged by two recent trends: growing investments in preventative actions and research, and shrinking delays in initiating management. However, these hopeful trends are unequal among the geographic regions.

Which Taxonomic Groups Get the Most Money?

About 42% of management costs ($39.9 billion) were spent on diverse or unspecified taxonomic groups. Of the costs that were taxonomically defined, 58% ($32.1 billion) was spent on invertebrates [see above re: forest pests]; 27% ($14.8 billion) on plants; 12% ($6.7 billion) on vertebrates; and 3% ($1.8 billion) on “other” taxa, i.e. fungi, chromists, and pathogens. For all of these defined taxonomic groups, post-invasion management dominated over pre-invasion management.  

When considering the invaded habitats, 69% of overall management spending was on terrestrial species ($66.1 billion); 7% on semi-aquatic species ($6.7 billion); 2% on aquatic species ($2.0 billion); the remainder was “diverse/unspecified”. For pre-invasion management (prevention programs), terrestrial species were still highest ($840.4 million). However, a relatively large share of investments was allocated to aquatic invaders ($624.2 million).

Considering costs attributed to individual species, the top 10 targetted for preventive efforts were four insects, three mammals, two reptiles, and one alga. Top expenditures for post-invasion investments went to eight insects [including Asian longhorned beetle], one mammal, and one bird.

Asian longhorned beetle

Just two of the costliest species were in both categories: insects red imported fire ant(Solenopsis invicta) and Mediterranean fruitfly (Ceratitis capitate). None of the species with the highest pre-invasion investment was among the top 10 costliest invaders in terms of damages. However, note the lack of data on fungi, chromists, and pathogens. (I wrote about this problem in an earlier blog.)

Discussion and Recommendations

Cuthbert et al. conclude that damage costs and post-invasion spending are probably growing substantially faster than pre-invasion investment. Therefore, they call for a stronger commitment to enhancing biosecurity and for more reliance on regional efforts rather than ones by individual countries. Their examples of opportunities come from Europe.

Drawing parallels to climate action, the authors also call for greater emphasis on during decision-making to act collectively and proactively to solve a growing global and inter-generational problem.

Cuthbert et al. focus many of their recommendations on improving reporting. One point I found particularly interesting: given the uneven and rapidly changing nature of invasive species data, they think it likely that future invasions could involve a new suite of geographic origins, pathways or vectors, taxonomic groups, and habitats. These could require different management approaches than those in use today.

As regards data and reporting, Cuthbert et al. recommend:

1) reducing bias in cost data by increasing funding for reporting of underreported taxa and regions;

2) addressing ambiguities in data by adopting a harmonized framework for reporting expenditures. For example, agriculture and public health officials refer to “pest species” without differentiating introduced from native species. (An earlier blog also discussed the challenge arising from  these fields’ different purposes and cultures.)

3) urging colleagues to try harder to collect and integrate cost information, especially across sectors;

4) urging countries to report separately costs and expenditures associated with different categories, i.e., prevention separately from post-invasion management; damage separately from management efforts; and.

5) creating a formal repository for information about the efficacy of management expenditures.

While the InvaCost database is incomplete (a result of poor accounting by the countries, not lack of effort by the compilers!), analysis of these data points to some obvious ways to improve global efforts to contain bioinvasion. I hope countries will adjust their efforts based on these findings.

SOURCE

Cuthbert, R.N., C. Diagne, E.J. Hudgins, A. Turbelin, D.A. Ahmed, C. Albert, T.W. Bodey, E. Briski, F. Essl, P. J. Haubrock, R.E. Gozlan, N. Kirichenko, M. Kourantidou, A.M. Kramer, F. Courchamp. 2022. Bioinvasion costs reveal insufficient proactive management worldwide. Science of The Total Environment Volume 819, 1 May 2022, 153404

Seebens, H. S. Bacher, T.M. Blackburn, C. Capinha, W. Dawson, S. Dullinger, P. Genovesi, P.E. Hulme, M.van Kleunen, I. Kühn, J.M. Jeschke, B. Lenzner, A.M. Liebhold, Z. Pattison, J. Perg, P. Pyšek, M. Winter, F. Essl. 2021. Projecting the continental accumulation of alien species through to 2050. Glob Change Biol. 2021;27:970-982.

Williams, G.M., M.D. Ginzel, Z. Ma, D.C. Adams, F.T. Campbell, G.M. Lovett, M. Belén Pildain, K.F. Raffa, K.J.K. Gandhi, A. Santini, R.A. Sniezko, M.J. Wingfield, and P. Bonello 2022. The Global Forest Health Crisis: A Public Good Social Dilemma in Need of International Collective Action. submitted

Posted by Faith Campbell

We welcome comments that supplement or correct factual information, suggest new approaches, or promote thoughtful consideration. We post comments that disagree with us — but not those we judge to be not civil or inflammatory.

For a detailed discussion of the policies and practices that have allowed these pests to enter and spread – and that do not promote effective restoration strategies – review the Fading Forests report at http://treeimprovement.utk.edu/FadingForests.htm

Global Loss of Floristic Uniqueness

Hakalau Forest, Hawai“i; nearly 90% of Hawaiian flora is unique to the Islands

A recent article by Yang et al. 2021 (full citation at the end of this blog) seeks to determine the extent to which introduced plants reduce the uniqueness of regional floras. They analyzed data from 658 regions covering about 65.7% of the Earth’s ice-free land surface and about 62.3% of the planet’s known plant species.

They found strong homogenization of plant species’ taxonomic and phylogenetic diversity results from introductions of plant species to ecosystems beyond their native range. Homogenization caused by regional extinctions of native floral species occurs much less frequently.

There are two aspects of a region’s floral uniqueness. One is the number of species that it shares with other regions. This is taxonomic uniqueness. The other is the distinctiveness of the evolutionary history of the region. When several species are endemic to a region’s flora, and lack close relatives in other regions, that equals phylogenetic uniqueness.

The effect of a species introduction differs depending on which of these aspects one focuses on. Thus, naturalization of a species closely related to native species (e.g., a congeneric species) will have less impact on the phylogenetic floristic uniqueness of the region than naturalization by a distantly related species. Taxonomic uniqueness, however, will be affected to the same degree, irrespective of the phylogenetic distance between the naturalized and native species.

Yang et al. found strong homogenization of plant diversity. They found that species introductions increased the taxonomic similarity in 90.7% of all regional pairs and phylogenetic similarity in 77.2% of all region pairs. Most homogenization results from introductions of plant species to ecosystems beyond their native range. Homogenization caused by regional extinctions of native floral species occurs much less frequently.

This loss of regional biotic uniqueness or distinctiveness changes biotic interactions and species assemblages. These, in turn, have ecological and evolutionary consequences at larger scales and higher levels.

The degree of homogenization between regions’ floras depends on three factors:

1) The distance between the donor and recipient regions. Since nearby regions share more species, an introduction from a more distant origin is more likely to be a novel species and so contribute to homogenization of “donor” and “receiving” floras.

2) Climatic similarity, especially temperature. A plant species introduced from a climatically similar but geographically distant place is more likely to establish than a species from a different climatic zone. As a result, the recipient area’s flora is changed to more closely resemble the flora of the donor region with which it shares climatic conditions – regardless of the distance between them.

3) The level of exchange of goods and people between two regions. The higher the rate of exchange between two regions, the greater the chance that a species will be introduced and become established. Yang et al. used the existence of current or past administrative relationships (e.g., colonial relationship) between two regions as a proxy for intensity of trade and transport between donor and recipient regions. They found that floras of regions with current or past administrative links have taxonomically become more similar to each other than the floras of regions with no such links.

flora of the Cape Floral Kingdom – South Africa; photo from Michael Wingfield

Establishment of introduced species can increase floristic similarity of the donor and recipient regions (= floristic homogenization) when the species is native to one of the two regions and naturalizes in the other, or when it is not native to both regions and naturalizes in both. On the other hand, a species introduction can decrease the floristic similarity of the two regions (i.e., enhance floristic differentiation) when the species is not native to both regions but naturalized in only one.  

Homogenization hotspots differed slightly depending on whether one focused on taxonomic or phylogenetic aspects.

The regions with the greatest average increase in taxonomic similarity with other regions due to naturalized alien species were New Zealand, portions of Australia, and many oceanic islands. The Australasian situation probably reflects its long biogeographic isolation from other parts of the globe and its highly unique native flora. As a result, nearly all non-native plants introduced to Australasia strongly increase levels of its floristic similarity to the rest of the world. Oceanic islands have species-poor floras with large proportions of unique endemics. They have also received high numbers of naturalized alien plants.

Hotspots of phylogenetic homogenization on continents are the same as those for taxonomic homogenization, but this is not true for islands. Yang et al. think this is because islands’ native floras were established by natural colonization from nearby continental floras so – despite subsequent speciation – they retain their phylogenetic relationship to the donor areas’ floras.  

Yang et al. concede that they lacked high-quality data on native and naturalized alien species lists for a third of Earth’s ice-free terrestrial surface, especially Africa, Eastern Europe, and tropical Asia. They believe, however, that data from these regions are unlikely to change the overall finding.  (Scientists are beginning to compile lists of forest pests in Africa). link to blog

Yang et al. note that introduction and naturalization of alien species are likely to increase in the future, thusaccelerating floristic homogenization. The ecological, evolutionary and socioeconomic consequences are largely unknown.They call for stronger biosecurity regulations of trade and transport and other measures to protect native vegetation.

SOURCE

Yang, Q., P. Weigelt, T.S. Fristoe, Z. Zhang, H. Kreft, A. Stein, H. Seebens, W. Dawson, F. Essl, C. König, B. Lenzner, J. Pergl, R. Pouteau, P. Pyšek, M. Winter, A.L. Ebel, N. Fuentes, E.L.H. Giehl, J. Kartesz, P. Krestov, T. Kukk, M. Nishino, A. Kupriyanov, J.L. Villaseñor, J.J. Wieringa, A. Zeddam, E. Zykova  and M. van Kleunen. 2021. The global loss of floristic uniqueness. NATURE COMMUNICATIONS (2021) 12:7290. https://doi.org/10.1038/s41467-021-27603-y

Posted by Faith Campbell

We welcome comments that supplement or correct factual information, suggest new approaches, or promote thoughtful consideration. We post comments that disagree with us — but not those we judge to be not civil or inflammatory.

For a detailed discussion of the policies and practices that have allowed these pests to enter and spread – and that do not promote effective restoration strategies – review the Fading Forests report at http://treeimprovement.utk.edu/FadingForests.htm

Urban Forests at Risk: Thousands of Communities, Millions of Trees, & Tens of Millions of Dollars

EAB-killed ash tree lying on highway in Fairfax County, Virginia; photo by F.T. Campbell

A recent study (Hudgins, Koch, Ambrose & Leung 2022; full citation at end of blog) projects that, by 2050, 1.4 million street trees in urban areas and communities will be killed by introduced insect pests. This represents 2.1- 2.5% of all urban street trees. Nearly all of this mortality will occur in a quarter of the 30,000 communities evaluated. Additional urban trees – in parks, other plantings, on homeowners’ properties, and in urban woodlands – are also expected to die.

Loss of these trees will undercut all the ecosystem services provided by urban trees.

The principal cause of mortality will be the emerald ash borer (EAB). Already, an estimated 230,000 ash trees have been killed by EAB. The authors predict that 6,747 communities not yet affected by the EAB will suffer the highest losses between now and 2060. Most of these communities are in a 350,000 square mile area of the northeast and central states. However, the risk is far wider, reaching as far as Seattle.

This ash tree has been standing – dead – since 2016. When will it fall?

In the top ‘hotspot cities’ projected mortality is in the range of 5,000–25,000 street trees. These include Milwaukee; the Chicago area (Chicago / Aurora / Naperville / Arlington Heights); Cleveland; and Indianapolis.  As in previous studies, the highest insect impacts are in the Northeast. Pests impacting this region – in addition to the emerald ash borer – include the spongy moth (formerly called gypsy moth) and hemlock woolly adelgid.

Because insect-killed trees must be treated or removed to minimize the risk to human life and property, the pest risk represents an economic as well as ecological threat. Removing and replacing just the street trees is projected to cost cities $30 million per year. Considering the cities I mentioned above, Milwaukee faces costs estimated at $13 million; Warwick, RI $2.5 million; Baltimore $1.7; Richmond and Virginia Beach $7.3 million and $700,000 respectively; and three New Jersey cities (Jersey City, Elizabeth City, and Patterson) $1.6 million combined.

USDA APHIS ended the federal quarantine for EAB in 2021. Therefore these cities and states are on their own to protect themselves from not only this and other damaging insects but also their extraordinarily high economic costs.

The study evaluated the risk to 48 genera of trees in about 30,000 communities. The most widely planted genera are maples (Acer spp.) and oaks (Quercus spp.). Consequently, they will die in largest numbers. An estimated 26.5 million maples and 5.9 million oaks are at risk, primarily in the East. As noted above, EAB is expected to kill 99% of ash trees in 6,747 communities across the country. In the Southwest, there are 3.4 million pines (Pinus spp.); the threat to them is not woodborers, but scale insects (San Jose scale [Quadraspidiotus perniciosus] and calico scale [Eulecanium cerasorum]).

As we know, urban forests are easily invaded because they are close to ports of entry and are often composed primarily of highly susceptible species. Hudgins, Koch, Ambrose and Leung analyzed the potential risk associated with introduction of a new woodboring insect from Asia – which they point out is the source of most imported goods. They determined that if such an introduced pest were to attack maples or oaks, it could kill 6.1 million trees and cost American cities $4.9 billion over 30 years. The risk would be highest if this pest were introduced via a port in the South.

In an earlier blog I reported that the U.S. is currently importing about 20 million shipping containers filled with goods from Asia per year. I have often blogged about the pest risk associated with wood packaging accompanying these imports. The number of containers from Asia entering Southeastern ports rose by more than 10% from December to January.

Hudgins, Koch, Ambrose & Leung combined four sources of information to produce these estimates:

  • a model of spread for 57 species of introduced insect pests already determined to cause significant damage to trees;
  • the distribution of genera of urban street trees across 30,000 US communities;
  • a model of host mortality in response to each insect-host combination; and
  • the cost of removing and replacing dead trees, linked to tree size (dbh).

They excluded several categories of pests. One of the most damaging, Asian longhorned beetle, was excluded because scientists have already developed control methods to limit its spread. Also excluded were species present in the U.S. for less than five years; species with no known economic impacts; and species for which no hosts in natural North American forests have been identified. Also excluded – although the authors do not mention this – are species that did not qualify for inclusion in the Aukema et al. study (see reference at end of this blog) because they have been introduced from nearby portions of North America, e.g., goldspotted oak borer. Finally, the study does not include pathogens. Some pathogens have caused huge losses of urban trees in the past, e.g., Dutch elm disease; some are causing losses now, e.g., sudden oak death. The authors do mention the Fusarium disease vectored by polyphagous (and Kuroshio) shot hole borers in southern California.

elm-lined street; photo from USFS

Consequently, the study’s estimate of 1.4 million street trees dead and costs of $30 million per year are underestimates.

The study has generated considerable media interest, including in the Washington Post.

SOURCES

Aukema, J.E., D.G. McCullough, B. Von Holle, A.M. Liebhold, K. Britton, & S.J. Frankel. 2010. Historical Accumulation of Nonindigenous Forest Pests in the Continental United States. Bioscience. December 2010 / Vol. 60 No. 11

Hudgins, E.J., F.H. Koch, M.J. Ambrose, B. Leung. 2022. Hotspots of pest-induced US urban tree death, 2020–2050. Journal of Applied Ecology 2022;00:1-11 DOI: 10.1111/1365-2664.14141

Posted by Faith Campbell

We welcome comments that supplement or correct factual information, suggest new approaches, or promote thoughtful consideration. We post comments that disagree with us — but not those we judge to be not civil or inflammatory.

For a detailed discussion of the policies and practices that have allowed these pests to enter and spread – and that do not promote effective restoration strategies – review the Fading Forests report at http://treeimprovement.utk.edu/FadingForests.htm