U.S. phytosanitary policy is set by politicians – the Secretary of Agriculture, trade officials, and members of the House and Senate. Elected or appointed state officials determine how aggressively trees are protected in their jurisdictions. To fix the problems, those politicians need to hear from those of us who know about the pest risk associated with wood packaging and other imports.
Politics is how our country makes important decisions. And in politics, the squeaky wheel gets the grease.
Election seasons provide opportunities to raise issues. Politicians pay more attention to constituents’ concerns when they are courting our votes.
Further, if new people take up positions in January (whether elected or appointed), they will be more open to learning about issues new to them than were the people who have occupied an office for some time.
These messages need to be repeated periodically. Proctor and Gamble does not make its profits by asking us to buy their toothpaste once a year. We cannot duplicate a major corporation’s advertising budget – but we can speak up!
Tell your member of Congress and senators that you are worried that our trees are still being put at risk by insects arriving in wood packaging or diseases being spread by shipments of plants. Ask them to urge theUSDA Secretary to take action to curtail introductions of additional tree-killing pests.
Ask your friends and neighbors to join you in communicating these concerns to their Congressional representatives and senators.
If you are a member of an association – a scientific or professional society, an environmental advocacy group, a homeowners’ association – ask your association and fellow members to join you in communicating these concerns to their Congressional representatives and senators.
Write letters to the editors of your local newspaper or TV news station.
What should we say?
Our goal should be to hold foreign suppliers responsible for complying with ISPM#15. Here are five pieces of a comprehensive approach. It is best to advocate for all. However, if you feel more comfortable focusing on one or two specific actions, please do so!
1) One approach is to penalize violators. APHIS should:
Fine an importer for each new shipment found to be out of compliance with ISPM#15 in those cases where the foreign supplier of that shipment has a record of repeated violations.
Prohibit imports in packaging made from solid wood (boards, 4 x 4s, etc.) from foreign suppliers that have a record of repeated violations.
Allow continued imports from those same suppliers as long as they are contained in other types of packaging materials, including plastic, metals, fiberboards.
APHIS has the authority to take these action under the “emergency action” provision (Sec. 5.7) of the World Trade Organization Agreement on Sanitary and Phytosanitary Standards. (See a lengthy discussion of the SPS agreement in Chapter III of Fading Forests II, available here.) http://treeimprovement.utk.edu/FadingForests.htm
USDA and CBP should take other steps to help importers comply with ISPM#15.
USDA should also step up efforts to help U.S. importers to determine – and then use – those foreign suppliers of wood packaging and dunnage have good compliance records.
APHIS should join the DHS CBP in providing incentives to importers to join an expanded Customs-Trade Partnership Against Terrorism program (C-TPAT) that would require participants to assume full responsibility for ensuring that their packaging complies with IPPC standards.
The Government should strengthen underlying regulations.
Once a new president is elected, urge him to instruct the Office of Management and Budget to allow APHIS to finalize regulations – proposed more than five years ago! – that would apply ISPM#15 to wood packaging used in trade between the US and Canada. (Canada has been ready to adopt this measure for several years.)
USDA needs to understand the “approach rate” of pests in wood packaging in order to identify and fix weaknesses in its policies. To reach this understanding, APHIS should authorize Robert Haack to repeat the study documented in Haack et al. (2014). Furthermore, APHIS should collaborate with foreign counterparts to determine the relative importance of possible causes of the persistent pest presence problem – fraud, accidental misapplication of treatments, or other failures of treatment. Once the study has been completed, APHIS and its colleagues should work through the IPPC to fix the problems.
There are also recommendations of the Tree-Smart Trade program at www.tree-smart-trade.org Tree-Smart also has a Twitter account: @treeSMARTtrade
Posted by Faith Campbell
We welcome comments that supplement or correct factual information, suggest new approaches, or promote thoughtful consideration. We post comments that disagree with us — but not those we judge to be not civil or inflammatory.
For a detailed discussion of the policies and practices that have allowed these pests to enter and spread – and that do not promote effective restoration strategies – review the Fading Forests report at http://treeimprovement.utk.edu/FadingForests.htm
I first blogged about wood packaging in July 2015 – it was my first blog! I have written 15 times about wood packaging since. To see the series, visit www.nivemnic.us, scroll down below “archives” to “categories”, click on “wood packaging”.
For five years, I have called upon USDA to act. It’s long past time to replace decade-old policies that have failed to prevent introductions. More recently, I have begun calling for revising the international phytosanitary system, too.
As I’ve demonstrated in my blogs – and documented by Aukema et al. 2011 and others—wood-boring beetles have been among the most damaging tree-killing pests introduced to the U.S. Local governments, homeowners, and businesses spend billions of dollars each year to manage dying and dead trees. Landowners bear added costs in reduced property values. The ecosystem impacts are substantial, but still poorly quantified.
International efforts – i.e., ISPM#15 – have apparently reduced the rate at which wood-borer pests approach our shores. However, the reduction has not been sufficient to prevent a tripling of the number of non-native wood-borers established in U.S. by 2050 (Leung et al. 2014) — as I have demonstrated over and over.
Also, I have documented again and again the continued presence of wood-borers in incoming wood packaging and resulting introductions (visit the “wood packaging” category in the blog archives).
Part of the blame for inadequate protection from pests might arise from the specific requirements of current international standards (see Nadel et al. 2016 and Krishnankutty et al. 2020b). But I think most of the blame falls on APHIS’ choice to be forgiving, rather than strict, in enforcing its own regulations that implement the international standard.
There is widespread evidence of exporters’ failures to implement international standards. The evidence is clear: we cannot rely on exporters to meet either international standards or importing country’s phytosanitary requirements. The same countries – and even individual exporting businesses! – fail to comply with ISPM#15 year after year (Haack et al. 2014; APHIS interception database). APHIS has not taken effective action to end imports from these scofflaws.
U.S. phytosanitary policy is set by politicians. Politicians pay more attention to constituents’ concerns during election seasons – so NOW is the time to press for changes! I will discuss how to do this in an accompanying second blog.
U.S. imports have decreased significantly in recent years, especially from the two countries with the worst records of non-compliance with ISPM#15 (Mexico and China). But economic collapse is not a long-term strategy for reducing pest risk.
Quantifying Pest Risk for Wood Packaging: We Don’t Know
Here’s my best estimate of the pest risk associated with wood packaging. Remember, though, that key data remain missing.
Haack et al. published a landmark analysis of pest approach rates in 2014, using data from 2009. However, they did not include imports from China, Mexico, or Canada. Given the history of interceptions, it is probable that a recalculation of the approach rate that included China and Mexico would raise the estimate. It is more difficult to provide a more accurate estimate re: Canada, because CBP rarely inspects those shipments. (The U.S. and Canada do not require each other to treat wood packaging.)
As of mid-October 2019, CBP said it received 11 million containers at seaports annually (CBP website). If 75% of those incoming sea-borne containers have wood packaging (per Meissner et al. 2009), that equals 8,250,000 containers. If 0.1% of those containers with wood packaging is infested (per Haack et al. 2014), we are receiving 8,250 infested shipping containers via maritime shipping – even now, when imports have decreased substantially. This is more than 22 infested containers every day.
As of a decade ago, Chinese shipments were only half as likely to be enclosed in wood packaging as are shipments from other exporters. Perhaps this reflects a greater reliance on air shipments – air shipments globally are half as likely as maritime shipments to be encased in packaging made of wood (Meissner et al. 2009). Despite the lower proportion of wood packaging use, shipments from China still rank second (to Mexico) in the number of shipments detected as infested. In part, the data reflect inspection priorities: due to the great damage caused by Asian insects to North American trees and their record of poor compliance, CBP targets shipments from China for more intense scrutiny. Still, the high number of detections reflects continuing non-compliance by Chinese exporters. And remember: first, the U.S. and Canada began requiring treatment of wood packaging from China at the end of 1998 – 21 years ago! And second, APHIS almost never penalizes importers for poor compliance.
Understanding the pest risk from Mexico and Canada is important, because they are our second and third largest trading partners. As of October 2019, the numbers of shipping containers arriving overland (by truck or rail) from these countries annually were 13.7 million (CBP website). No one has estimated the proportion of these containers that contain wood packaging. If it is the same proportion as in maritime shipments, the approach rate would be another 10,275 infested containers per year – or 28 per day.
The total of maritime and land-based shipments that are probably infested (excluding air shipments) – would be 18,525 containers annually or 50 per day.
If I am right that shipments from China and Mexico have a higher pest-infestation rate than the 0.1% global estimate developed by Haack et al. (2014), the pest approach rate is probably higher than the 18,525 containers given above.
(I noted in my previous blog that insect species arriving from our neighbors pose a lower risk than the species from Asia or Europe – although the risk is not “0”. I addressed the Mexican woodborers in the previous blog. The risk from Canada could arise from non-native woodborers established in that country but not yet in the U.S. e.g., brown spruce longhorned beetle. Another risk is that shipments from off-shore origins might be transshipped through Canada and escape inspection because they are claimed to have been re-packaged there – as CBP staff have told me.)
The point is, we don’t know how many pests are reaching the U.S. daily. The current approach rate might be significantly higher or lower than Haack and colleagues estimated a decade ago due to
Exclusion of China, Mexico, and Canada from the original study.
Changes in the treatment requirements of ISPM#15.
Another decade of experience – which might have led to better compliance (however, see below).
Despite my urging, APHIS has not agreed to a study to update Haack’s estimate.
It is also true that shipping containers provide shelter for a vast range of hitchhiking organisms in addition to insects in the wood, e.g., other insects’ eggs attached to the sides of the container, snails, weed seeds, even vertebrates.
Enforcement: One Agency Steps Up
When ISPM#15 was adopted, APHIS expected that importers would clean up their supply chains in order to avoid the lost income and costly delays that result from CBP interception of a non-compliant shipment. However, the data clearly show that this disincentive to violate ISPM#15 is insufficient to prompt companies to fix the problem. We need to find a more efficacious approach.
Clearly, enforcement in the form of penalties had been rare before 2017. CBP staff reported that as of January 2017 (before the agency strengthened its own enforcement effort), only about 30 of the nearly 21,000 non-compliant import shipments had received a financial penalty. CBP staff cited two reasons for the low penalty rate: 1) USDA policy requires that an importer be caught five times in a year with non-compliant wood packaging before imposing a fine; and 2) APHIS had not designated wood packaging as a high-risk commodity. After CBP initiated more aggressive enforcement in November 2017, enforcement actions rose by 400% (John Sagle, CBP. pers. comm) – although from a very low starting point!
Data on CBP interceptions in 2019 (Harriger) show decreases in the number of non-compliant shipments from earlier years in all categories: a 19% decrease below the 2010-2018 average of shipments intercepted; a 13% decrease in number of shipments intercepted because the wood packaging lacked the ISPM#15 mark; a decrease of 6% in the number of shipments intercepted that had a quarantine pest. Still, percentages based on absolute numbers don’t tell the whole story. They can be affected by inspection effort and other variables. So while these decreases are encouraging, it is still too early to determine the impact of CBP’s enforcement upgrade.
Unfortunately, there has not yet been the substantive/overall change needed in federal policy. At a minimum, APHIS continues to allow importers five violations per twelve month period.
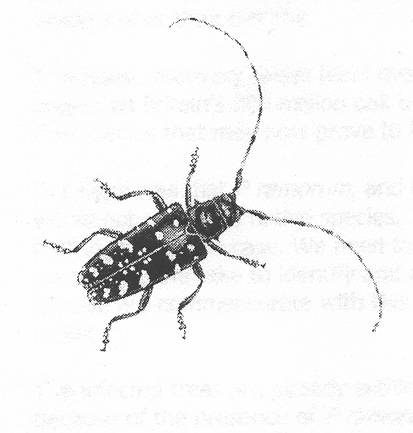
While the cities that import the most goods – especially from Asia – would seem to be at particular risk, experience shows that pests can be introduced anywhere. This is demonstrated by establishment of the Asian longhorned beetle in semi-rural Clermont County, Ohio and the velvet longhorned beetle in Utah (Krishnankutty, et al. 2020a).
“Treated” Wood Still Transports Pests
According to interception data provided to me by CBP (Harriger), 97% of pest-infested shipments detected over a period of 6 years (FYs 2010 – 2015) bore the stamp indicating they’d been treated in compliance with ISPM#15. These shipments came from all importing countries. Unfortunately, CBP has not provided the necessary breakdown of its data in more recent years to calculate this proportion.
Krishnankutty et al. (2020b) analyzed wood packaging from 42 countries intercepted by CBP over six years (April 2012 – January 2018). They found that 87% of the infested wood packaging included in this study bore the ISPM mark. This is a lower non-compliance rate than that shown by CBP data, but still too high.
European scientists carried out an intensive survey of wood packaging associated with shipments of stone from China to the 28 European Union countries during 2013-2016. They also found that 97.5% of consignments that harbored pests bore the ISPM#15 mark (Eyre et al. 2018). The problem did not decrease over time.
The possible causes of this problem are long-known. What effort is APHIS making to determine their relative importance? Is it fraud? Is it accidental misapplication of the treatments? Is it that the treatments do not work as well as necessary?
By comparing Haack’s estimate with the CBP data, I estimate that CBP is detecting and halting the importation of 4 – 8% of the shipments that actually contain pest-infested wood. Wu et al. (2020) concurred that the majority of infesting larvae would probably not be intercepted – despite CBP’s best efforts – and would be transported to the cargo’s intended destinations.
Since CBP inspects only about 2% of incoming shipments, this detection rate demonstrates the value of CBP’s program to target likely violators. It deserves praise. But it is obviously too low a “catch” rate to provide an adequate level of protection for our forests. I do not believe that increasing the inspection workforce and effort will result in substantial improvement in this rate. Instead, we need action to curtail imports of wood packaging from countries and exporters with records of non-compliance.
What Federal Agencies Are Doing to Better Prevent Introductions
Other than CBP’s welcome newly rigorous enforcement policy, most actions have focused on educating exporters, importers, shippers, customs brokers, and exporting countries’ phytosanitary agencies.
Since upgrading its enforcement actions, CBP has expanded its long-standing educational efforts. APHIS co-sponsored workshops for agricultural agencies and exporters in Asia and the Americas earlier in the decade.
APHIS also planned to host international symposia on wood packaging issues as part of events recognizing 2020 as the International Year of Plant Health. These symposia have been postponed by travel and other restrictions arising from the coronavirus pandemic.
Posted by Faith Campbell
We welcome comments that supplement or correct factual information, suggest new approaches, or promote thoughtful consideration. We post comments that disagree with us — but not those we judge to be not civil or inflammatory.
For a detailed discussion of the policies and practices that have allowed these pests to enter and spread – and that do not promote effective restoration strategies – review the Fading Forests report at http://treeimprovement.utk.edu/FadingForests.htm
SOURCES
Aukema, J.E., B. Leung, K. Kovacs, C. Chivers, K. O. Britton, J. Englin, S.J. Frankel, R. G. Haight, T. P. Holmes, A. Liebhold, D.G. McCullough, B. Von Holle.. 2011. Economic Impacts of Non-Native Forest Insects in the Continental United States PLoS One September 2011 (Volume 6 Issue 9)
Eyre, D., R. Macarthur, R.A. Haack, Y. Lu, and H. Krehan. 2018. Variation in Inspection Efficacy by Member States of SWPM Entering EU. Journal of Economic Entomology, 111(2), 2018, 707–715)
Haack, R. A. 2006. Exotic bark- and wood-boring Coleoptera in the United States: recent establishments and interceptions. Can. J. For. Res. 36: 269–288.
Haack, R.A., F. Herard, J. Sun, J.J. Burgeon. 2009. Managing Invasive Populations of Asian Longhorned Beetle and Citrus Longhorned Beetle: A Worldwide Perspective. Annu. Rev. Entomol. 2010. 55:521-46.
Haack, R. A., K. O. Britton, E. G. Brockerhoff, J. F. Cavey, L. J. Garrett, M. Kimberley, F. Lowenstein, A. Nuding, L. J. Olson, J. Turner, and K. N. Vasilaky. 2014. Effectiveness of the international phytosanitary standard ISPM no. 15 on reducing wood borer infestation rates in wood packaging material entering the United States. Plos One 9:e96611.
Krishnankutty, S.M., K. Bigsby, J. Hastings, Y. Takeuchi, Y. Wu, S.W. Lingafelter, H. Nadel, S.W. Myers, and A.M. Ray. 2020a. Predicting Establishment Potential of an Invasive Wood-Boring Beetle, Trichoferus campestris (Coleoptera) in the United States. Annals of the Entomological Society of America, XX(X), 2020, 1–12
Krishnankutty, S., H. Nadel, A.M. Taylor, M.C. Wiemann, Y. Wu, S.W. Lingafelter, S.W. Myers, and A.M. Ray. 2020b. Identification of Tree Genera Used in the Construction of Solid Wood-Packaging Materials That Arrived at U.S. Ports Infested With Live Wood-Boring Insects. Commodity Treatment and Quarantine Entomology
Leung, B., M.R. Springborn, J.A. Turner, E.G. Brockerhoff. 2014. Pathway-level risk analysis: the net present value of an invasive species policy in the US. The Ecological Society of America. Frontiers of Ecology.org
Meissner, H., A. Lemay, C. Bertone, K. Schwartzburg, L. Ferguson, L. Newton. 2009. Evaluation of Pathways for Exotic Plant Pest Movement into and within the Greater Caribbean Region. Caribbean Invasive Species Working Group (CISWG) and USDA APHIS Plant Epidemiology and Risk Analysis Laboratory
Nadel, H. S. Meyers, J. Molongoski, Y. Wu, S. Lingafelter, A. Ray, S. Krishnankutty, A. Taylor. 2017. Identification of Port Interceptions in Wood Packing Material Cumulative Progress Report, April 2012 – June 2017
Oregon Department of Agriculture, Plant Protection & Conservation Programs. 2019. Annual Report 2019.
USDA APHIS interception database – pers. comm. January 2017.
Wu, Y., S.M. Krishnankutty, K.A. Vieira, B. Wang. 2020. Invasion of Trichoferus campestris (Coleoptera: Cerambycidae) into the United States characterized by high levels of genetic diversity and recurrent intros. Biological Invasions Volume 22, pages1309–1323(2020)
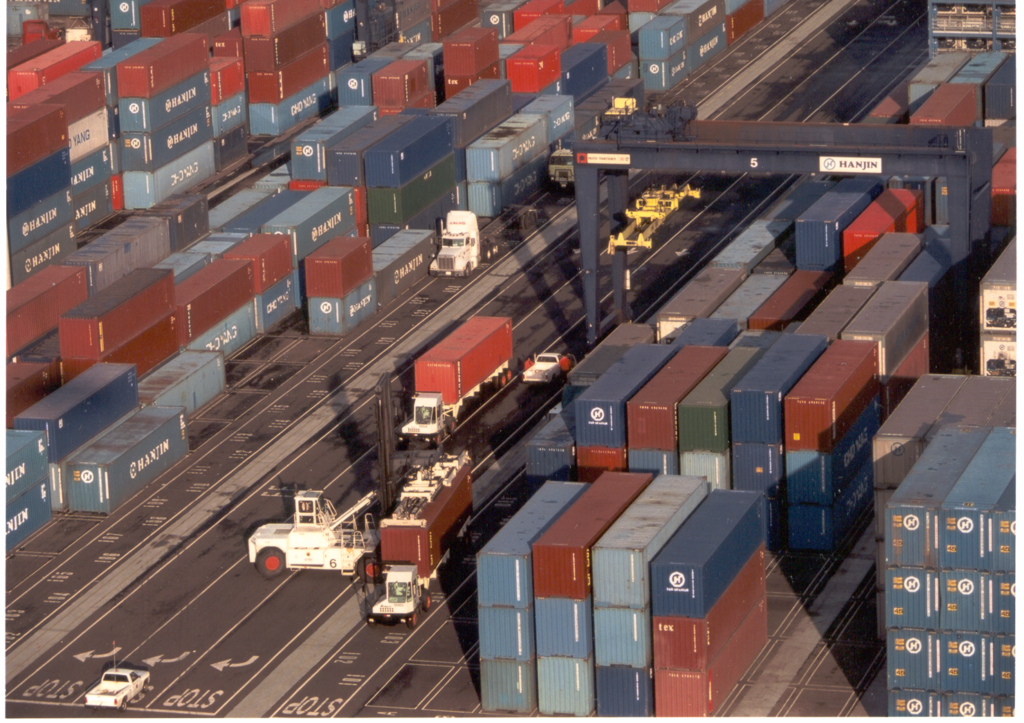
A shipping container being off-loaded in Long Beach
In 2018, China supplied 21.2% of all U.S. imports of goods. Import volumes had been rising rapidly: 427% since China joined WTO in 2001 (17 years!).
However, volumes of U.S. imports from China dropped significantly following imposition of tariffs in the second half of 2019. See a graph published in the Washington Post. U.S. Census Bureau data show U.S. imports from China declined 16% in 2019 compared to 2018 (from $539 billion to $452 billion). The Post graph shows imports from China have begun to rise again in 2020, although they are still far below levels in 2016-2018.
What might this imply for imports of pests?
2019 Imports from China
Heavy goods – are the ones most likely to be packaged in wooden crates or on wooden pallets that can transport pests. These include metal and stone products (including tile); machinery (such as automobile parts and farm equipment); electronics; bulk food shipments; and finished wood articles
Many goods imported from China are heavy so their packaging might facilitate pest invasions. Unfortunately, the various websites combine types of imports in different categories, so it is difficult to compare data from the various years. Worse, while I easily found data for 2019 and 2020, I could not find 2018 data (it must be there somewhere!). Still, six of the top eleven categories in 2019 appear to fall into the “heavy” categories.
Also, China is the third largest supplier of agricultural imports, primarily processed fruits and vegetables, including juices (together, about $1.5 billion), snack foods ($222 million), spices ($167) million, and fresh vegetables ($160 million).
Trade from Hong Kong is reported separately, but it is not a significant amount – $6.3 billion in 2018; and is declining. Electrical machinery is the largest category, at $980 million.
2020 Imports from China
Import volumes declined substantially during the first five months of 2020, compared to the same period in 2019:
Cell phones & related equipment fell 18.53%
Computers fell 4.86%
Miscellaneous textile rose 300%
Motor vehicle parts fell 26%
Seats excluding medical and dental fell 32.5%
The principal sea ports receiving goods from China during the period January – May 2020 were
Los Angeles $35.27 billion – fell 31.9%
Long Beach $10.61 billion – fell 22%
Newark $9.21 billion – fell 28%
Savannah $8.38 billion
Oakland $4.94 billion
Houston $4.29 billion
Pest Implications
These reduced volume of imports would seem to promise a reduced pest risk. Other factors point in the same direction.
Mode of transport is also significant, that is, air freight versus sea or land transport. In the first five months of 2020, https://ustr.gov/countries-regions/china-mongolia-taiwan/peoples-republic-china a quarter of U.S. imports from China, or $36 billion, entered through just four airports: Chicago’s O’Hare, Los Angeles, Anchorage, and JFK in New York. It is also encouraging that the volumes shipped by air apparently rose. The data show that at O’Hare imports rose 8.4%; at Los Angeles they rose 22%. The website does not provide data for Anchorage or New York. This could be a temporary fluke, for example, if importers were trying to acquire supplies quickly, before new tariffs took effect.
A larger proportion of goods shipped by air might result in a lower approach rate for wood-boring insects, since airborne goods are probably less likely to be packaged in wood. More than a decade ago, Meissner et al. (2009) found that only a third of air shipments (from all countries) were packaged in wood, compared to three-quarters of maritime shipments. I wonder if this is the reason that they found that shipments from China were only half as likely to be enclosed in wood packaging as were shipments from other exporting countries.
Even if China is cutting its imports in quantity, significant problems with quality persist. China consistently ranks second (to Mexico) in the number of shipments containing wood packaging that does not comply with international and U.S. regulations. Over the period 2011-2016, shipments from China constituted 11% of shipments detected by the Bureau of Customs and Border Protection as non-compliant (APHIS database / pers. comm).
So the pest risk persists. Remember that in 1986 – about the time the Asian longhorned beetle and the emerald ash borer were introduced from China – the U.S. imported only $3.8 billion worth of goods from that country. Of course, the U.S. did not require treatment of wood packaging from China until January 1999. My previous blogs have frequently documented the continuing presence of pests in wood packaging from China. To see the series, visit www.nivemnic.us, scroll down below archives to “categories”, click on “wood packaging”.
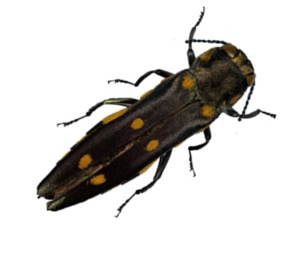
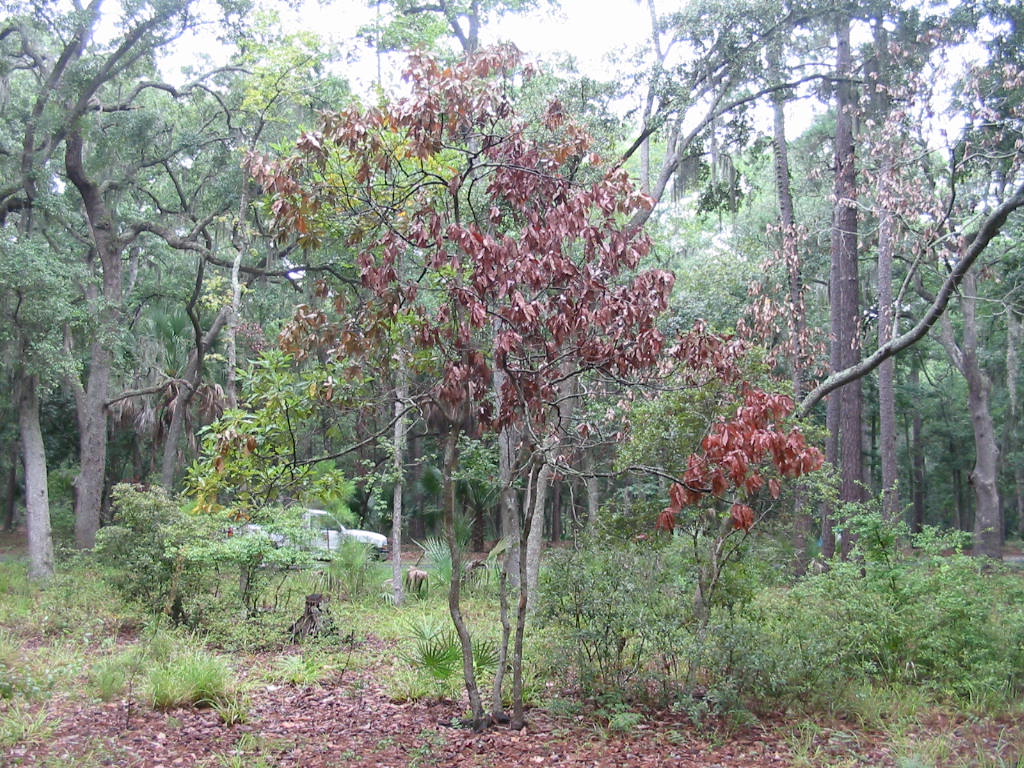
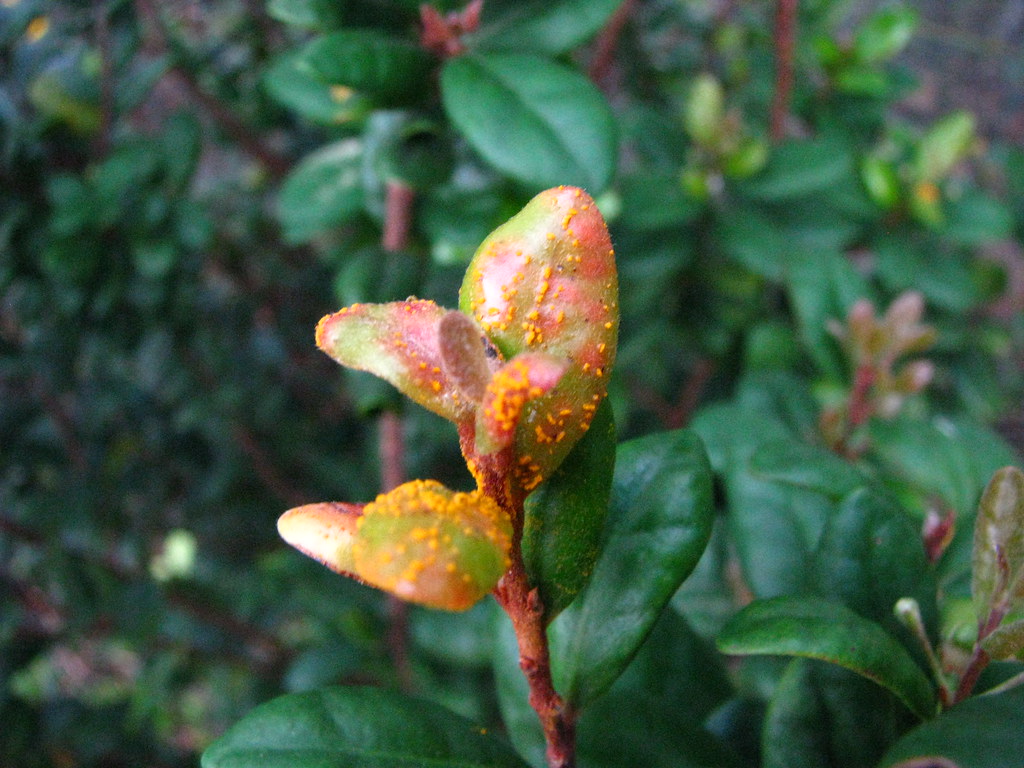
goldspotted oak borer
Because Mexico has an even worse record of compliance with wood packaging regulations than does China, it is good news that U.S. imports from there fell even more precipitously (see graph here). Pests that might be introduced in wood from Mexico generally pose less of a risk, but the risk is not zero! Three woodborers from Mexico – goldspotted oak borer, soapberry borer, and walnut twig beetle – have proved lethal to naïve species growing in the U.S. Each is described here.
Conclusion
Although the presumably temporary collapse of global trade might provide a respite from pest introductions, it is not a long-term strategy. Furthermore, resulting decreases in user fees will reduce the CBP’s inspection staff. I call again for revision of the international phytosanitary system to focus on preventing the movement of plant pests. The designation of 2020 as the International Year of Plant Health means now is the appropriate time to initiate such action.
Posted by Faith Campbell
We welcome comments that supplement or correct factual information, suggest new approaches, or promote thoughtful consideration. We post comments that disagree with us — but not those we judge to be not civil or inflammatory.
For a detailed discussion of the policies and practices that have allowed these pests to enter and spread – and that do not promote effective restoration strategies – review the Fading Forests report at http://treeimprovement.utk.edu/FadingForests.htm
SOURCES
Haack, R.A., F. Herard, and J. Sun, and J.J. Turgeon. 2010. Managing Invasive populations of Asian longhorned beetle and citrus longhorned beetle: a worldwide perspective. Annual Review of Entomology 55: 521-546.
Meissner, H., A. Lemay, C. Bertone, K. Schwartzburg, L. Ferguson, L. Newton. 2009. Evaluation of Pathways for Exotic Plant Pest Movement into and within the Greater Caribbean Region. Caribbean Invasive Species Working Group (CISWG) and USDA APHIS Plant Epidemiology and Risk Analysis Laboratory
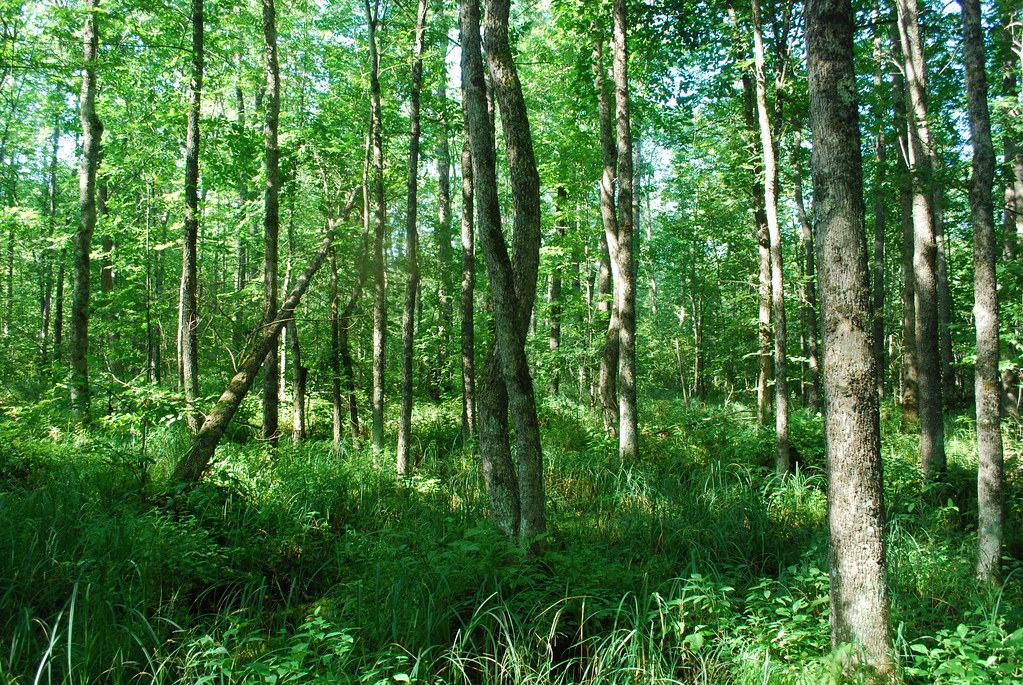
Ash forest in Michigan killed by emerald ash borer photo by Nate Siegert
As I reported in December, the USDA Forest Service Forest Health Management program has been issuing reports on the status of pest invasions, based on annual national Insect and Disease Surveys (IDS). This survey is carried out by low-level aerial surveys of statistically valid geographic units. (For a discussion of quadrat establishment, see the Introduction to the 2019 report here.
Here I compare the pest situation as it appeared in two recent years, based on these surveys: 2017 and 2018.
Of course, two years is too short a time to see trends. The second report provides USFS scientists attempt to provide context by analyzing 20 years of data (Chapter 6 of the 2019 report).
These reports are important sources of data on the status of non-native pests in our forests, but I raise several caveats that necessitate our continuing to rely on additional sources, some of which I have cited in previous blogs. I will address these in greater detail below. But in brief, these caveats are:
1) Major pests – both in extent and damage caused – are not adequately included (see below).
2) The survey technique resulted in delays in detecting mortality. It cannot be used as an early detection tool.
3) There is little analysis of the statistics cited.
Why Stakeholders Cannot Rely on These Two Survey Reports Alone
I hope stakeholders, analysts, and decision-makers will utilize the full range of reports and other data to evaluate the presence and impacts of various invasive pests and pathogens. Even the reports’ authors advise decision-makers to use other forest health indicators in addition to this report. It is not the “fault” of the authors that these reports cannot serve all needs. However, we all need to be aware this caveat.
1. Important Pests Not Adequately Included.
Many of the most damaging non-native pests caused extensive damage before these surveys were initiated. These include white pine blister rust, chestnut blight, Dutch elm disease, butternut canker, Port-Orford cedar root disease, European gypsy moth, and balsam woolly adelgid on Fraser fir. [For further discussion, see pest write-ups here and my earlier blogs reviewing 30 years of engagement and survey data from Shenandoah National Park.]
2. Major Damaging Pests Are Poorly Captured by the Survey Method.Morin found that non-native pests had caused a five percent increase in mortality nation-wide – as measured by tree volume. Three of the species suffering the highest rates of this “exacerbated mortality” are redbay, ash, and hemlock. The current studies’ authors concede all three are poorly detected by the survey methods. The aerial survey techniques are ill-suited to detect mortality of tree species that grow scattered throughout a diverse forest. Other seriously damaging pests that are poorly detected by aerial surveys are Dutch elm disease, white pine blister rust, and thousand cankers disease. Again, see the species write-ups here to be reminded about how great the pest’s impact are. Also review my earlier blog reviewing 30 years of my engagement with the issue and survey data from Shenandoah National Park.
dead redbay in woods photo by F.T. Campbell
Given these caveats above, what do these studies show us?
Areas surveyed.
Since 1999, the annual Insect and Disease Survey (IDS) has covered on average 266,655,000 ha, although the area varied from a maximum of 320,712,000 ha (in 2007) to a minimum of 202,170,000 ha (in 2017), then increased to 211,34,000 ha in 2018. For reasons not clear to me, the proportion of forested area in the lower 48 states surveyed actually declined from 2017 to 2018 – from 55.1% to 46.6%. In Alaska, the 2017 surveys covered about 7.3% of the total forested area but 12.7% of the forested area in 2018. In Hawai`i, the survey covered about 80.1% of the forested area in 2017, but only 69.4% of the State’s total tree canopy area in 2018.
Tree-Killing Insects and Pathogens Found.
The 2017 survey identified 63 mortality-causing agents and complexes that cumulatively affected 3.27 million ha in the lower 48 states – about 1.3% of the total 252 million ha of forested land in these states. Of these agents of tree mortality, 23 were detected killing trees on areas totaling larger than 5,000 ha each.
The 2018 survey identified seven fewer mortality-causing agents – only 56. These agents were detected on about 2.13 million ha across the lower 48 (slightly less than the combined land area of New Jersey and Rhode Island), or about 0.8% of the total forested area. Of the total, 22 agents were detected killing trees on areas totaling larger than 5,000 ha each.
The more recent report does not discuss these declines from the 2017 findings or whether they might be related to the smaller percentages of forested areas covered by the aerial survey in 2018.
In both 2017 and 2018, as well as in the 20-year trend analysis (Chapter 6 of the report published in 2020), overall mortality is greatest in the West due to the impact of several native western bark beetles. Overall mortality rates in other regions was considered low, despite severe impacts of some non-native species.
The 2017 survey found that the emerald ash borer (EAB) was the most widespread single agent, causing measurable tree mortality on 1.42 million ha. In 2018, the area of EAB damage was reduced by 76% — to just 338,000 ha. (Still, the latter figure represented 15.8% of the total area displaying mortality). These figures were probably underestimates – especially in areas outside North Central Region – because EAB is one of the pests poorly detected by the aerial survey technique – at least when ash are growing scattered in a diverse forest ecosystem. Although the USFS report doesn’t say so, this decline probably reflected the collapse of dead ash trees and reduction in numbers of still-alive but vulnerable ash trees as the EAB invasion wave matured.
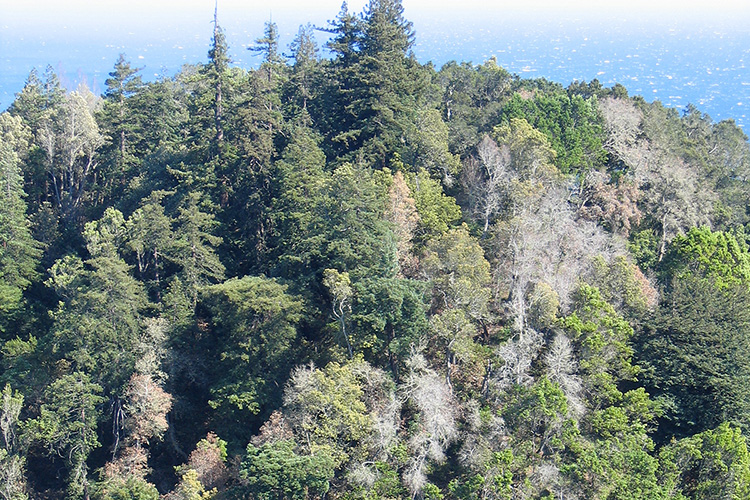
The reports document a huge increase in mortality attributed to the sudden oak death pathogen between 2017 and 2018. (SOD is the only widespread non-native agent of mortality on the West coast.) The area affected increased nearly seven-fold – from 6,335 ha in the 2017 survey to 42,771 ha in the 2018 survey. This equated to causing mortality on 3.9% of the total Regional mortality area. This finding parallels finding reported by the California Oak Mortality Task Force. Note that SOD-related mortality was not detected by the aerial surveys until 2008 – 13 year or more after scientists working on the ground detected the presence of the then-unknown pathogen in the forests of California.
tanoak killed by Phytophthora ramorum on Big Sur peninsula photo by Matteo Garbelotto
Another alarming increase detected in 2018 was that of balsam woolly adelgid (BWA) in the Interior West. BWA-caused mortality was evident on 44,000 ha – 8.4% of the total area with mortality. BWA impacts were especially severe in central Idaho. There are several native pests in the same area. (See BWA write-up here.) BWA was first detected in Idaho in 1983 – 35 years earlier.
Geographic Hot Spots
The EAB caused the principal hot spots in the East. In the USFS North Central Region, 91% of the area suffering tree mortality in 2017 was attributed to the EAB. The EAB was also causing mortality across 10,346 ha (16% of the total areas suffering mortality) in the Northeast (especially Connecticut) and more than 5,000 ha in the South (especially Kentucky). (See my December blog for a discussion of the puzzling situation in several Great Plains ecoregions, where mortality was attributed largely to drought rather than either EAB or Dutch elm disease.)
Another mortality agent in the Northeastern Region was the European gypsy moth. In 2018, it was responsible for tree death on 31% of the total 70,000 ha affected area.
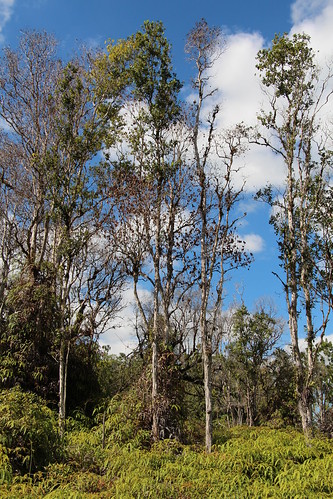
Another hot spot was in Hawai`i. In 2017, about 37,000 ha of mortality was detected. By 2018, the dead zone had increased to 46,000 ha – despite a 12% decrease in the area surveyed. In both years, the data collectors officially called the cause unknown. The reports’ authors stated that the probable cause was they rapid ‘ōhi‘a death fungi. (I ask why the surveyors did not state the cause since rapid ‘ōhi‘a death was identified on the Big Island in 2014.)
rapid ‘ōhi‘a death photo by J.B. Friday
Other non-native pests that affected more than 5,000 ha in the lower 48 states in 2017 were the BWA outbreak in the Northeast (20,758 ha, primarily in Maine); beech bark disease (12,222 ha, primarily in the North Central Region), and oak wilt (9,573 ha, primarily in the North Central Region and Texas).
In the Southern Region, mortality agents were detected on 1% or less of the forested area in 2017. In 2018, EAB-caused mortality was detected on 9.7% of the total 13,000 ha area experiencing mortality. An earlier gypsy moth outbreak had apparently calmed. I remind you that the report authors have conceded that laurel wilt and hemlock woolly adelgid are poorly detected by the survey technique.
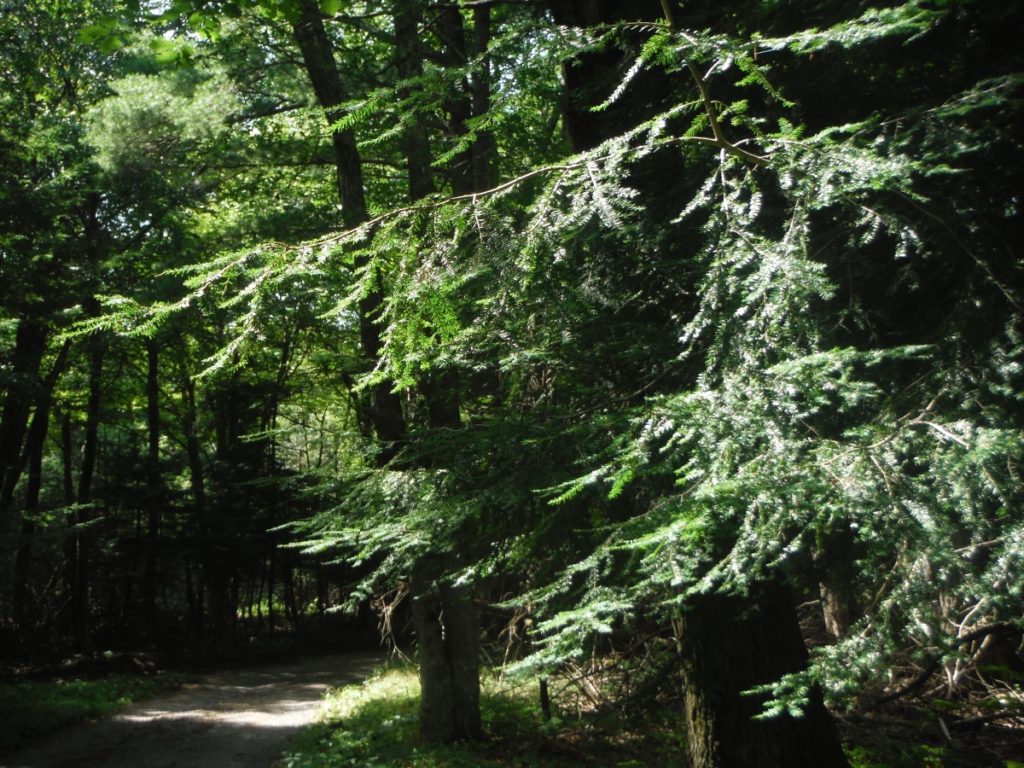
eastern hemlock in Shenandoah National Park (Virgina)
DEFOLIATORS
The 2017 survey detected defoliation caused by 50 agents and complexes across the lower 48. These impacted 2.3 million ha. The 2018 survey identified six more defoliation agents and complexes (56), but they affected a much smaller area – about 1.72 million ha.
Unsurprisingly, the most widespread was the European gypsy moth. The data demonstrated the gypsy moth’s boom/bust cycle. In 2017, gypsy moth impacts were detected on 39% of the total forested area of the lower 48 states (913,000 ha) in 2017. By 2018, the total area affected by the gyspy moth had fallen to 156,000 ha.
In both years, gypsy moth defoliation was particularly severe in the Northeast Region. In 2018, a second non-native species, browntail moth (Euproctis chrysorrhoea) was also causing severe defoliation in the region, primarily in Maine.
In the South, the European gypsy moth affected only 5.8% of the total area of defoliation; native defoliators predominated.
The report does not discuss the relationship between gypsy-moth caused defoliation and mortality. True, there must be repeated defoliations to cause tree mortality.
Other non-native defoliation agents affecting more than 5,000 ha in the lower 48 in 2017 were the larch casebearer (25,891 ha in the North Central Region and another 7,400 ha in the West Coast Region); and winter moth (12,760 ha in the Northeast Region). Is the decline of winter moth in 2018 data related to introduction of a biocontrol agent?
In 2018, the Larch casebearer (Coleophora laricella) continued to be a significant defoliator, affected 3.1% of the North Central Region’s total defoliated area. A new agent, the balsam woolly adelgid (BWA), was detected defoliating firs in the West Coast Region. The affected area was 15,000 ha – 5% of the total affected area Again, there was no discussion of as to whether defoliation precedes mortality. Admittedly, the progression of BWA damage in firs is extremely complicated.
Alaskan forests suffered widespread defoliation, mostly by native species. The survey detected an unknown canker on quaking aspen (Populus tremuloides).
Twenty Years of Data: Trends
In addition to reporting on the 2018 survey, the more recent report contains an analysis (in Chapter 6) of data over 20 years. The analysis is intended to be used in analyses required under the Resource Protection Act (RPA). The RPA analysis uses the same set of Insect and Disease Survey data, although it groups them in four rather than five regions.
The authors grouped the annual data into four five-year windows (1996-2001; 2002-2006; 2007–2011; 2012-2016).
An overview comprising all mortality agents across the nation found a major “spurt” in area exposed to mortality-causing agents in 2002-2006. The 14.2 million ha was 4.5 times greater than the 3.1 million ha affected in the preceding 1997-2001 period. This was attributed, in part, to a sampling change. The mortality footprint fell slowly in later periods – to 9.9 million ha in 2007-2011 and 6.9 million ha in 2012-2016. Other than during the 2002-2006 period, mortality was relatively low in the Northern Region – despite EAB – especially when compared to high mortality in the Rocky Mountain and Pacific Coast Regions attributed to bark beetles.
The mortality area attributed to pathogens was also highest in 2002-2006. This was due to three pests: a root diseases-bark beetle complex killing subalpine fir, oak wilt, and beech bark disease.
Very little disease mortality was reported in the South during any of the five-year periods – an alarming failure given damage to redbay by laurel wilt. The lapse is more confusing because past IDS reports have listed redbay as heavily damaged (see USDA FS FHTET 2014).
The Pacific states saw a modest increase over time. The sudden oak death infestation was first detected by the IDS survey in 2008 – approximately 13years after it was detected on the ground.
Over the 20 years, non-native species caused mortality on an average of 500,000 ha in each five-year period except 2002-2006 (described above). The proportion of the total mortality footprint associated with non-native species was14.8% in 1997-2001, 34.4% in 2002-2006, 3.6% in 2007-2011 & 7.4% in 2012-2016.
Only in the Northern Region was a large proportion of the mortality footprint consistently attributed to non-native species – 35.1% in 1997-2011 to 98.5% in 2002-2006. The suite of species changed over time. In the first period (1997-2001), the principal species were beech bark disease, European gypsy moth, oak wilt, and hemlock woolly adelgid. During two periods – 2002-2006 and 2007-2011 – those present earlier were joined by BWA, EAB, and Dutch elm disease. By the final period – 2012-2016 – the principal agents were EAB and red pine scale.
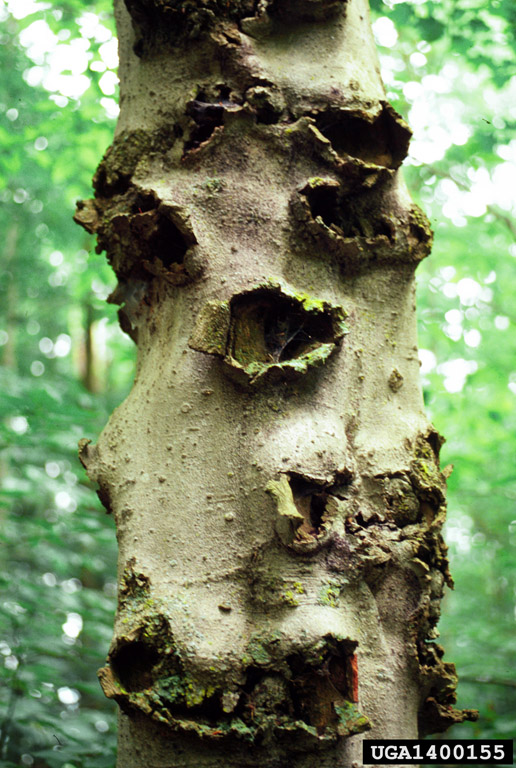
beech bark disease Photo by Linda Haugen courtesy of Bugwood
Non-native mortality agents detected in the South included hemlock woolly agelgid and oak wilt. HWA affected 71.8% of the affected area in 2006 – 2012, 21.9% in 2012-2016. EAB was first detected by the aerial survey in 2016.
In the two western regions, non-native agents had low footprints. The highest impacts were associated with BWA and white pine blister rust in the Rocky Mountain Region, Port-Orford cedar root disease and SOD in the Pacific Region, with the addition of BWA in some years and ROD in 2015 and 2016.
Generally, woodborers have caused the highest mortality levels, seconded by pathogens. Only in the 2002-2006 period did another insect feeding guild exceed 10% of total mortality area – when BWA (a sap feeder) reached 18.7% of detected mortality – on balsam fir in Maine.
In the Western regions, the disease white pine blister rust was second to the subalpine fir mortality complex. Even this ranking fails to reflect widespread mortality of lower-elevation five-needle pines in previous decades.
In the Northern Region, a disease – beech bark disease – was most important in the first five-year period. It was replaced by a wood-boring beetle – EAB. I have noted the importance of the BWA (a sap-feeder) infestation during 2002-2006.
In the Southern Region, native bark beetles usually predominated. There were outbreaks of the foliage-feeding European gypsy moth in2007-2011 and hemlock woolly adelgid (sap-feeder) in 2012-2016.
The authors of the report note that the South might be underrepresented for several reasons – but without mentioning the severe impacts on the understory trees redbay and more recently sassafras.
SOURCES
Bailey, R.G.. 1995. Descriptions of the ecoregions of the United States. 2d ed. Miscellaneous Publication No. 1391. Washington, D.C.: U.S. Department of Agriculture Forest Service. 108 p.
Fei, S., R.S. Morin, C.M. Oswalt, and A.M. 2019. Biomass losses resulting from insect and disease invasions in United States forests
Guo, Q., S. Feib, K.M. Potter, A.M. Liebhold, and J. Wenf. 2019. Tree diversity regulates forest pest invasion. PNAS. www.pnas.org/cgi/doi/10.1073/pnas.1821039116
Morin, R.S., K.W. Gottschalk, M.E. Ostry, A.M. Liebhold. 2018. Regional patterns of declining butternut (Juglans cinerea L.) suggest site characteristics for restoration. Ecology and Evolution.2018;8:546-559
Morin, R. A. Liebhold, S. Pugh, and S. Fie. 2019. Current Status of Hosts and Future Risk of EAB Across the Range of Ash: Online Tools for Broad-Scale Impact Assessment. Presentation at the 81st Northeastern Forest Pest Council, West Chester, PA, March 14, 2019
Potter, K.M., B.S. Crane, W.W. Hargrove. 2017. A US national prioritization framework for tree species vulnerability to climate change. New Forests (2017) 48:275–300 DOI 10.1007/s11056-017-9569-5
Potter, K.M., M.E. Escanferla, R.M. Jetton, and G. Man. 2019a. Important Insect and Disease Threats to United States Tree Species and Geographic Patterns of Their Potential Impacts. Forests. 2019 10 304.
Potter, K.M., M.E. Escanferla, R.M. Jetton, G. Man, and B.S. Crane. 2019b. Prioritizing the conservation needs of United States tree species: Evaluating vulnerability to forest insect and disease threats. Global Ecology and Conservation. (2019)
USDA Forest Service. Forest Health Monitoring: National Status, Trends, and Analysis 2018. General Technical Report SRS-239. June 2019. Editors Kevin M. Potter Barbara L. Conkling
USDA Forest Service. Forest Health Technology Enterprise Team. 2014. 2013-2027 National Insect and Disease Forest Risk Assessment. FHTET-14-01
Posted by Faith Campbell
We welcome comments that supplement or correct factual information, suggest new approaches, or promote thoughtful consideration. We post comments that disagree with us — but not those we judge to be not civil or inflammatory.
For a detailed discussion of the policies and practices that have allowed these pests to enter and spread – and that do not promote effective restoration strategies – review the Fading Forests report at http://treeimprovement.utk.edu/FadingForests.htm
The U.N. Food and Agriculture Organization has declared 2020 to be the International Year of Plant Health. APHIS, U.N. FAO, and others planned celebratory events — most now postponed.
The designation prompts consideration of whether the current global phytosanitary system – created in 1995 – is succeeding in preventing movement of invasive plant pests and invasive plants. Join me in this evaluation!
I focus on evaluating the most widespread invasive pests killing trees – and the pathways on which they travel. Some of the most damaging tree pests, of course, were moved around the world decades ago. But too many have been transported after the modern plant health system was developed in the mid-20th Century with the adoption of the original International Plant Protection Convention (IPPC) in 1951.
Of course, this is also the period when trade volume exploded, resulting in new source countries, new products, and new technologies that facilitated newly rapid movement of goods and accompanying pests. See my earlier blog here and the book by Marc Levinson, The Box: How the Shipping Container Made the World Smaller and the World Economy Bigger. It iswell-documented that rising trade volumes, new trade connections, new products have and will continue to exacerbate unintended movement of species (Seebens et al., 2018).
The phytosanitary regime was massively revised in the mid-1990s through adoption of the World Trade Organization and the Agreement on Sanitary and Phytosanitary Standards (SPS Agreement). Two principal changes were to constrain individual countries’ freedom to establish their own phytosanitary regulations and to require evidence of risk rather than allowing action on the basis of “if in doubt, keep it out”. I have written a critique of the new system in Fading Forests II. See Chapter 3, available here.
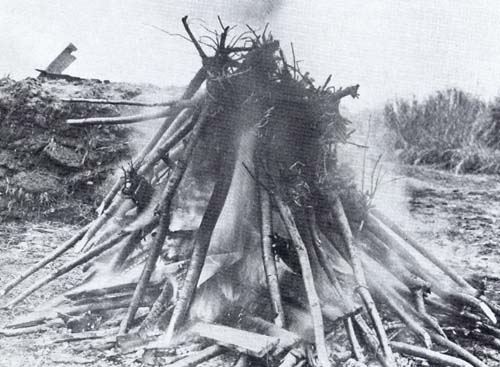
USDA officials burn infested cherry trees – gifts from Japan Washington, D.C. 1912
Has the new regime allowed spread of pests, as I predicted in my critique?
Of course, the explosion of global trade has made prevention of species introductions far more difficult. So the rising numbers of introductions cannot be blamed entirely on the SPS Agreement. Still, it is vital to review pest status in order to see whether the SPS Agreement is succeeding in protecting Earth’s flora. Here, I am looking at only one type of bioinvader. Many more types need to be evaluated, even among plants and plant pests. Nor do I pretend that my list is comprehensive even in the category I focus on – tree-killing insects, nematodes, and pathogens.
My definition of “global invader” is an insect, pathogen, or nematode that has been moved from its known or probable place of origin to at least two novel continents or widespread island groups.
Before the SPS Agreement
Of course, many highly damaging forest insects and pathogens spread widely before the eruption of global trade in the second half of the 20th Century. Examples include several pathogens:
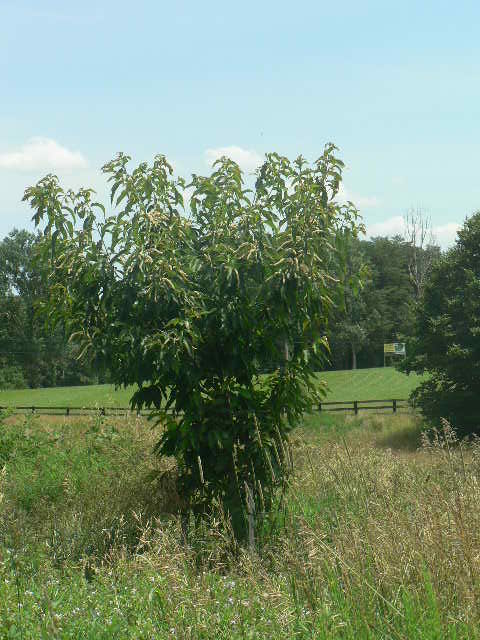
American chestnut bred to be resistant to blight photo by F.T. Campbell
Phytophthora cinnamomi – Europe, North America, Oceania, South America
Cryphonectria parasitica – Europe and North America; Oceania probably much later
Dutch elm disease causal agents Ophiostoma ulmi & novo-ulmi (the vectors are sometimes native insects) – Europe, North America, Oceania;
And some insects:
Hylastes ater – Oceania, South America, Africa
Scolytus multistriatus (Dutch elm disease vector) – North America 1909; later to Oceania; mid-20th Century to Africa
There have also been initial introductions of some organisms that would become “global” later:
Phytophthora lateralis – North America before 1950
During the period 1950 – 1995 –when trade began exploding and countries were adopting their own phytosanitary regulations as allowed under the original IPPC – the following pests were introduced “globally”:
P. ramorum in Big Sur, California photo by Matteo Garbelotto
Phytophthora ramorum was introduced from Southeast Asia to Europe and North America.
Hylurgus ligniperda – Oceania, South America, Africa, Asia after 1950; North America before 1995
Phoracantha recurva – detected in various geographies after 1995, but almost certainly introduced to North America, South America, Europe, Africa, and Oceania before that date
Palm pests – red palm weevil (Rhynchophorus ferrugineus) to most areas of the Old World and Oceania where palms grow; coconut rhinoceros beetle (Oryctes rhinoceros) around Africa, Mauritius, Reunion; Oceania;
Again, there were initial introductions of numerous insects in wood packaging and on “plants for planting” that would expand to “global” ranges after 1995:
Anoplophora glabripennis
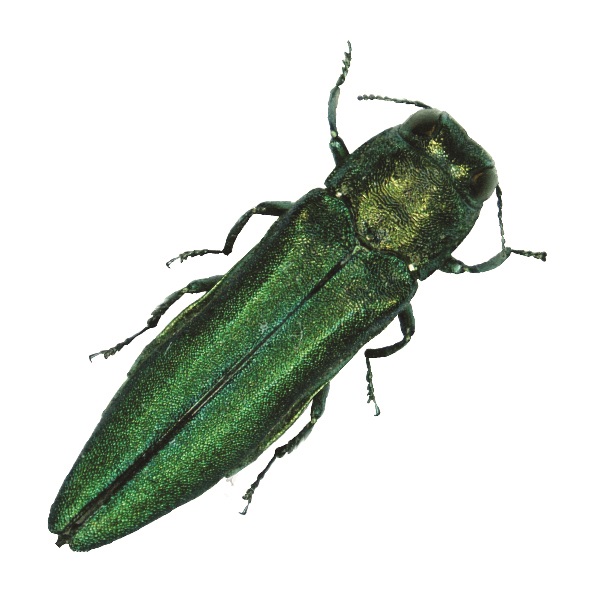
To North America: Anoplophora glabripennis;, Agrilus planipennis; Austropuccinia psidii; Phoracantha recurve; Glycaspis brimblecombei
To Asia: Pine wood nematode Bursaphelenchus xylophilus
To Oceania, South America – Sirex noctillio;
After the SPS Agreement
There has been an apparent explosion of spread since adoption of SPS Agreement in 1995. No doubt these introductions were made possible by the concurrent explosion of trade volumes and more pest-friendly shipping practices (e.g., use of shipping containers and more rapid transportation). The principal vector appears to be plants for planting. About 50% of new plant pathogen invasions are associated with plants for planting (Jimu et al. 2016). Wood packaging is a strong second vector.
Tree-killing pests of which I am aware that have apparently spread globally after 1995 include:
Insects
Aulacaspis ysumatsui – North America, Caribbean, Pacific Ocean islands, Oceania, Africa, Europe, various islands off Southeast Asia that are probably outside original range
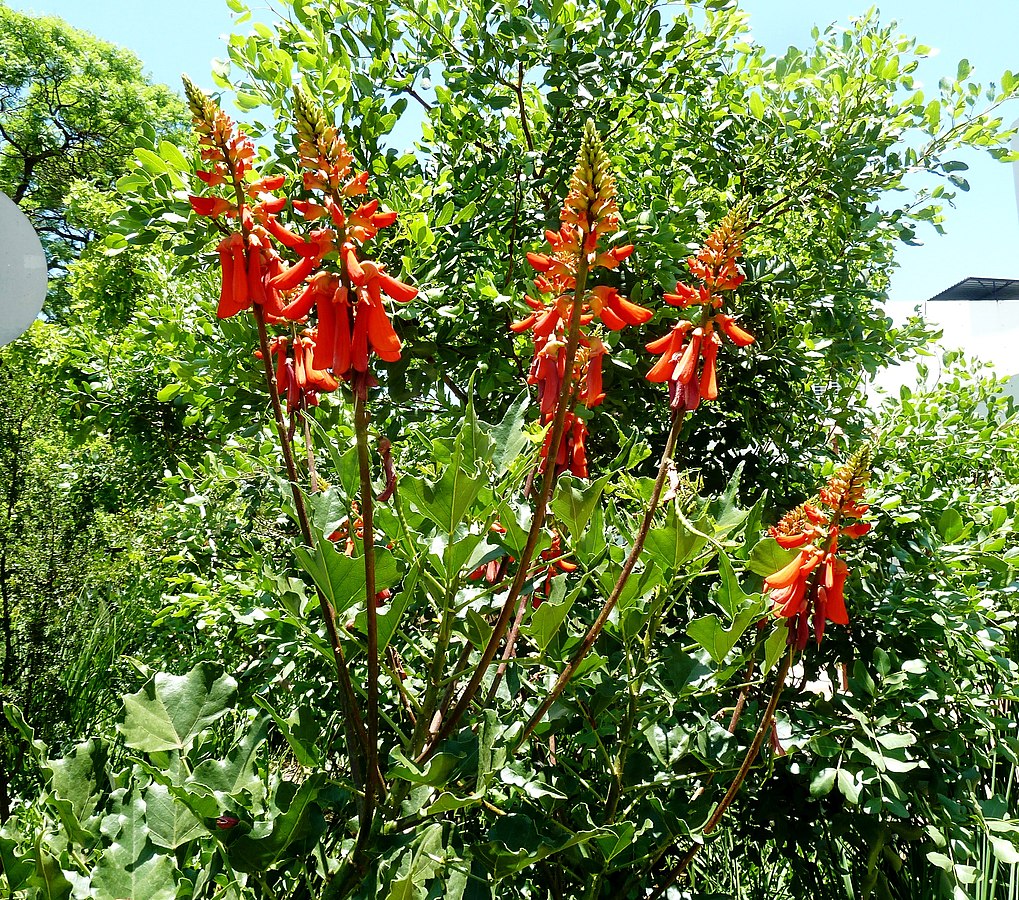
Erythrina humeana in the Manie van der Schijff Botanical Garden, Pretoria vulnerable to Euwallacea / Fusarium complex
Quadrastichus erythrinae – North America, Southeast Asia, islands in the Indian and Pacific oceans
Euwallacea fornicatus complex, esp. Euwallacea whitfordiodendrus and E. kuroshio and their Fusarium symbionts Fusarium euwallaceae, Graphium euwallaceae, & Paracremonium pembeum – North America, Africa
Several insects that attack Eucalyptus have been widely introduced to areas where plantations of these species have been planted, e.g.,
Blue gum chalcid wasp or eucalyptus gall wasp Leptocybe invasa – throughout Africa, the Middle East, Asia, the Pacific Region, Europe, South America, Mexico, and the United States [CABI]
Red gum lerp psyllid (Glycaspis brimblecombei) Europe 2009 [EPPO]
Eucalyptus snout beetles Gonipterus spp complex à two species introduced to five continents (Schroder et al. 2019).
Eucalyptus gall wasp(Ophelimus maskelli) – Mediterranean Region, the Middle East, South Africa, Europe, U.S., New Zealand [CABI]
Continued spread of species that had been introduced to a single new continent before 1995:
Pine wood nematode Bursaphelenchus xylophilus – to Europe
Phytophthora lateralis – to Europe and South America
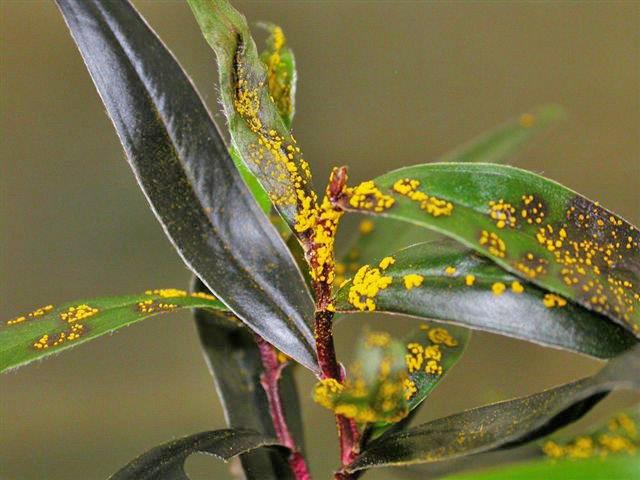
Myrtle rust Austropuccinia psidii – to Pacific oceanic islands and Oceania
Anoplophora glabripennis and A. chinensis – to Europe
Sirex noctillio – to North America
Agrilus planipennis – to Russia and western Europe
Red palm weevil (Rhynchophorus ferrugineus) – to North America (California- eradicated)
Coconut rhinoceros beetle (Oryctes rhinoceros) – to Pacific islands, e.g., Guam and Hawai`i
I note that several studies have identified large numbers of introduced species in certain categories, although the dates of introduction are uncertain. Some were probably introduced before 1995. Here I cite the following:
Jung et al. (2015) found 59 putative Phytophthora taxa in forest and landscape planting sites in Europe; none had been detected by inspectors at the European Union borders.
Jimu et al. (2019) report global spread of Eucalyptus pathogens carried by the trade in seed and cuttings to support establishment of new plantations and breeding programs.
Numerous species of Phytophthora across North America – about 60 species in California native plant nurseries; eleven species in Minnesota (both from Swiecki et al. 2018); Parke et al. (2014) identified 28 Phytophthora taxa in four Oregon nurseries.
Nine species of Phytophthora associated in urban streetscapes, parks, gardens, and remnant native vegetation in urban settings in Western Australia (Barber et al. 2013).
So What’s the Bigger Picture?
I have blogged frequently about the weaknesses of the international standard governing wood packaging; go here.
Clearly the weaknesses of the international phytosanitary system are not limited to the wood packaging pathway. And I repeat that the phytosanitary system is under severe challenge by trade volumes and practices – at least before the Covid-19 pandemic. Still, it is clear that the international phytosanitary system has failed in achieving its purpose: to provide adequate protection in response to this challenge.
I have two suggestions:
1) I hope that the most affected countries will take actionper their authority under Section 5.7 of the SPS Agreement. This allows emergency action to prevent further introductions via the principal pathways and from the geographic origins posing the greatest threats (e.g., China for wood packaging, Southeast Asia for Phytophthorapathogens).
2) I hope further that all the nearly 200 countries that are parties to the SPS Agreement and the IPPC will rapidly institute an analysis of the current phytosanitary system to quickly identify amendments to the agreements that would better enable countries to protect their plants from non-native pests.
SOURCES
Barber, P.A., T. Paap, T.I. Burgess, W. Dunstan, G.E.St.J. Hardy. 2013. A diverse range of Phytophthora species are associated with dying urban trees. Urban Forestry & Urban Greening 12 (2013) 569-575
Jimu, L., M. Kemler, M.J. Wingfield, E. Mwenje, and J. Roux. 2016. The Eucalyptus stem canker pathogen Teratosphaeria zuluensis detected in seed samples. Forestry 2016 89 316-324 https://academic.oup.com/forestry/article/89/3/316/1749105
Levinson, M. The Box: How the Shipping Container Made the World Smaller and the World Economy Bigger Princeton University Press 2008
Schroder, M. Slippers, B., Wingfield, M.J., Hurley, B.P, Invasion history and management of Eucalyptus snout beetles in the Gopterus scutellatus species complex. 2019. Journal of Pest Science
Parke, J.L., B.J. Knaus, V.J. Fieland, C.Lewis, and N.J. Grünwald. 2014. Phytophthora Community Structure Analyses in Oregon Nurseries Inform Systems Approaches to Disease Management. Phytopathology Vol. 104, No 10.
Schroder, M. Slippers, B., Wingfield, M.J.,Hurley, B.P, Invasion history and managementof Eucalyptus snout beetles in the Gopterus scutellatus species complex. 2019. Journal of Pest Science
Seebens, H., T.M. Blackburn, E.E. Dyer, P. Genovesi, P.E. Hulme, J.M. Jeschke, S. Pagad, P. Pyse, M. van Kleunen, M. Winter, M. Ansong, M. Arianoutsou, S. Bacher, B. Blasius, E.G. Brockerhoff, G. Brundu, C. Capinha, C.E. Causton, L. Celesti-Grapow, W. Dawson, S. Dullinger, E.P. Economo, N. Fuentes, B. Guénard, H. Jäger, J. Kartesz, M. Kenis, I. Kühn, B. Lenzner, A.M. Liebhold, A. Mosen, D. Moser, W. Nentwig, M. Nishino, D. Pearman, J. Pergl, W. Rabitsch, J. Rojas-Sandoval, A. Roques, S. Rorke, S. Rossinelli, H.E. Roy, R. Scalera, S. Schindler, K. Stajerová, B. Tokarska-Guzik, K. Walker, D.F. Ward, T. Yamanaka, and F. Essl. 2018. Global rise in emerging alien species results from increased accessibility of new source pools. PNAS Plus. Available at http://www.nature.com/articles/ncomms14435
Swiecki, T.J., E.A. Bernhardt, and S.J. Frankel. 2018. Phytophthoraroot disease and the need for clean nursery stock in urban forests: Part 1 Phytophthora invasions in the urban forest and beyond. Western Arborist Fall 2018.
We welcome comments that supplement or correct factual information, suggest new approaches, or promote thoughtful consideration. We post comments that disagree with us — but not those we judge to be not civil or inflammatory.
For a detailed discussion of the policies and practices that have allowed these pests to enter and spread – and that do not promote effective restoration strategies – review the Fading Forests report at http://treeimprovement.utk.edu/FadingForests.htm
Congress has begun work on funding the government for Fiscal Year 2021, which begins on 1 October 2020.
The House Appropriations Committee has adopted bills funding USDA APHIS (via the agriculture appropriations bill) and USDA Forest Service (via the interior appropriations bill). Both provide steady or increased funding for programs important to preventing, eradicating, containing, and managing non-native tree-killing pests.
However, the Senate must act also – and I don’t yet know whether it will support these spending increases — or even whether it will pass an appropriations bill.
Still – we should applaud members of the House Agriculture and Interior subcommittees for supporting these programs (go here to see if your representative is on the committees). The same link provides justifications for funding the various programs.
USDA APHIS funding for key programs
Program FY2020 Admin’s Request FY2021
APHIS Plant Protection
Ag Quarantine (appropriated) 32,330,000 33,350,000 33,070,000
Tree & wood pests 60,000,000 56,336,000 60,600,000
In its report, the Appropriations Committee reiterated its longstanding instruction that the Secretary of Agriculture tap funds in the Commodity Credit Corporation to fund emergency actions to “arrest and eradicate” plant pests. The report also called for APHIS to maintain funding levels and cost-share requirements for addressing the Asian longhorned beetle. (I expect emergency funds will be needed to address the newly detected ALB outbreak in South Carolina.) The Committee noted that it had provided $4 million in additional funds to counter the spotted lanternfly outbreak.
In addition, the Committee instructed APHIS to work with the USDA Forest Service, National Institute of Food and Agriculture, and Climate Hub to assist U.S. tropical areas (Hawai`i, Puerto Rico, US Virgin Islands, Guam, Marianas) to address several issues, including:
Land and forest resource management; and
Biology and control of invasive insects, plant diseases, weeds and integrated pest management strategies;
Forest Service – funding for key programs
Program FY2020 Pres’ request FY2021
Research &
Development $305,000,000 $249,330,000 $311,830,000
In its report, the Appropriations Committee said that it expected the USFS to develop a research program that reflects the committee’s priorities and other activities most critical to forest health, especially addressing climate change adaptation, preventing spread of disease and invasive species, and watershed improvement. The Committee also supported research on holistic approaches to countering the harmful effects of terrestrial invasive species, utilizing a coordinated approach that incorporates expertise in forestry, veterinary science, aerospace engineering, biotechnology, agronomy and applied economics.
Addressing the Forest Health Management program, the Committee report encouraged the USFS to address high priority invaders, including the emerald ash borer and native western bark beetles.
The bill also rejected the President’s proposal to eliminate the Urban and Community Forestry program. Instead, it provided $8 million above the FY2020 level (that is, $40 million); this total includes $2 million allocated to helping communities hard-hit by the emerald ash borer to replant their urban forests.
Now that the House has acted, the next step – usually – is for the Senate Agriculture and Interior appropriations subcommittees to mark up their own bills. However, those who follow Congress closely don’t expect the Senators to be able to reach agreement on spending levels. Instead, they expect, the Senate will pass a “continuing resolution” that maintains current funding levels for the various programs. Perhaps after the election, they might then adopt more detailed bills.
Please – if one of your Senators is on either of these subcommitees (see the lists here), ask him or her to support the House spending levels on these programs.
I have written extensive descriptions of the impact of funding inadequacies in Fading Forest III, available here.
Posted by Faith Campbell
We welcome comments that supplement or correct factual information, suggest new approaches, or promote thoughtful consideration. We post comments that disagree with us — but not those we judge to be not civil or inflammatory.
For a detailed discussion of the policies, practices, and funding shortfalls that have allowed these pests to enter and spread – and that do not promote effective restoration strategies – review the Fading Forests report at http://treeimprovement.utk.edu/FadingForests.htm
myrtle rust infestation; source: New Zealand Department of Agriculture alert May 2017
Pacific countries’ policy and management responses to the spread of the myrtle rust pathogen, Austropuccinia psidii (formerly Puccinia psidii), has had puzzling – even infuriating – gaps … which perhaps have contributed to its spread and damage.
Reminder: ‘ōhi‘a or myrtle rust attacks species in the Myrtaceae – a family now said to include 5,600 species (Stewart et al. 2018). Ten percent of Australia’s native flora is in the family – or about 1,300 species. New Zealand is home to 27 native plants in the Myrtaceae family (Bereford et al. 2019) and the Hawaiian Islands to eight (JB Friday pers. comm.). See a writeup about the disease here.
Austropuccinia psidii is one of the global invaders: it has invaded 27 countries on several continents. It is apparently native to parts of the American tropics.
Levels of worry rose considerably with the pathogen’s spread across the Pacific beginning with the detection in Hawai‘i in spring 2005. Additional introductions in the region were Japan in 2009; China in 2011; Australia, New Caledonia, and South Africa in 2013; and New Zealand in 2017.
The known host range currently exceeds 500 species in 86 genera – all in the Myrtaceae family. The pathogen has several strains or biotypes; the impact of the various biotypes on the various host species differs. Environmental factors also apparently affect disease.
[For my earlier discussions of threats to the unique Hawaiian flora, go here for dryland flora, here and here for more general discussions. I discuss National Park Service efforts – including in Hawai`i – here.]
There are several factors that militate against a political entity choosing to act:
1) Inherent Difficulty in Controlling Wind-Borne pathogen
In both Hawai`i and Australia, the rust spread rapidly once it was established outside of nurseries. In Hawai`i, it had spread to all the islands within a few months of its detection in spring 2005 (Loope and La Rosa 2008). In Australia, the rust was established in natural ecosystems throughout coastal New South Wales and to far northern Queensland by mid-2012 – less than two years after detection (Carnegie et al. 2016). The number of host species also expanded rapidly – from 214 native plants in 2016 (Carnegie et al. 2016) to 393 species by 2019 (Winzer et al. 2019). Myrtle rust is believed to have been carried to Australia and New Caledonia on imported plants or cut vegetation; then to New Zealand by winds from Australia across the Tasman Sea (Toome-Heller et al. 2020).
2) Lack of Clarity About Probable Impacts
Austropuccinia psidiihad been introduced fairly widely before 2000, and some biotypes had caused significant damage on introduced species within both the native and introduced ranges of the rust – e.g., Eucalyptus in Brazil, allspice (Pimento doica) in Jamaica, rose apple (Syzygium jambos) in Hawai`i. However, the rust had had little impact on native floras in introduced ranges, especially not on widespread species (Carnegie et al. 2016).
However, concerns existed in the Pacific region because of:
Its wide host range (before the introduction to Australia, the known host range was “only” 129 species in 33 genera Carnegie et al. 2016).
The severe damage to Australian genera growing outside their native range, e.g., nurseries and plantations of Eucalyptus in South America and Melaleuca quinquenervia and Rhodomyrtus tomentosa in Florida (Carnegie et al. 2016)
In Hawai`i, ‘ōhi‘a rust caused little damage to the dominant tree species in Hawaiian forests, ‘ōhi‘a lehua for the first 10 years after its introduction. The rust did cause severe damage to the invasive alien shrub rose apple and several native plants, especially the endangered Eugenia koolauensis. A more damaging outbreak in ‘ōhi‘a lehua trees in 2017 has increased concern.
ohia rust on E. kooaulensis photo by Edward Eickhoff via Flickr
So – while Austropuccinia psidii has an extremely wide host range, its impact in naïve ecosystems to which it might be introduced is unclear.
In most cases, lack of knowledge about a pest’s impacts on naïve hosts in new ranges is almost inevitable – unless scientists undertake host vulnerability tests. Such tests are rarely done in advance of an introduction. One exception is European scientists evaluating European trees’ vulnerability to a suite of newly discovered Phytophthora species in Vietnam and elsewhere. (I am unaware that U.S. scientists are carrying out parallel studies.)
Still, environmental and other factors play important roles and might counter expectations raised by lab experiments or experience of hosts planted in non-native sites. In Australia, McRae (2013) noted that the “mycological firestorm” predicted by environmentalists to result from introduction of the rust had not occurred. This at least partly explained waning interest in combatting the pathogen (Carnegie et al. 2016).
In my view, the swings in perceptions of the risk reflected more flaws in understanding than actual risk. Impacts can take time to manifest – especially when, as with Austropuccinia psidii – the pathogen is known to affect primarily new growth and fruit and flowers (Carnegie et al. 2016). The impact might be greatest in the form of suppressing regeneration rather than by killing mature trees right away. [See beech leaf disease as another possible example of this phenomenon.]
Questions hampering predictions of impact were further confused by taxonomic questions (Carnegie et al. 2016). Austropuccinia psidii has at least nine genetically distinct clusters. So far, two have been introduced outside South/Central America. One strain – called the “pandemic biotype” – has been found at all introduction sites in Florida, Hawai‘i, Asia, and the Pacific – Australia, New Zealand, New Caledonia (Stewart et al. 2018). This biotype is not known to be present in Brazil (Toome-Heller et al. 2020). A second biotype has been introduced to South Africa; it has been shown to be able to infect some Myrtaceae in New Zealand (Toome-Heller et al. 2020). See especially Stewart et al. 2017, full citation below.
3) Policy Barriers Created by Phytosanitary Regulations
In the U.S., the pathogen has been established in one state – Florida – since 1977. There, it is not considered to be causing damage to important species. Under U.S. regulations – reflecting the international trade rules – an organism that is already in the country cannot be treated as a “quarantine pest” unless there is an “official control program” targeting the pest. (For a discussion of this issue, see the analysis of the SPS Agreement in Chapter 3 and Appendix 3 of Fading Forests II). For this reason, when ‘ōhi‘a rust was detected in Hawai`i in 2005, USDA’s Animal and Plant Health Inspection Service (APHIS) was unable to adopt regulations governing imports or interstate movement of vectors (i.e., cuttings or nursery stock of plant species in the Myrtaceae).
The State responded to the initial detection by adopting an emergency order two years later, in August 2007. This prohibited importation of plants in the myrtle family from “infested areas”- specified as South America, Florida, and California. This state rule expired in August 2008.
It became apparent that USDA APHIS would not take action to assist Hawai`i unless APHIS accepted scientific findings as proving that additional biotypes of the rust existed that could pose a more severe threat to plants on the Islands. Such studies were undertaken, some funded by the USDA Forest Service. This process took years. During this period, Hawai`i developed a permanent rule which was adopted in May 2020. This regulation restricts the importation to Hawai`i of plants in the Myrtaceae, including live plants and foliage used in cut flower arrangements. Dried, non-living plant parts, seeds that are surface sterilized, and tissue cultured plants in sterile media and containers are exempted from the ban. Other importations may be done by permit.
Meanwhile, in 2019, APHIS proposed to include all taxa in the Myrtaceae destined for Hawai`i in an existing regulatory category of “plants for planting” not authorized for importation pending pest risk assessment (NAPPRA). The intent was to reduce the probability of introduction of additional strains of Austropuccinia psidii to the Islands. This proposal appeared 14 years after the rust was first detected in Hawai`i. And the proposal has not yet taken effect. Therefore, imports of most living plants and cut foliage are still subject only to inspection (7 Code of Federal Regulations 319.37). The tiny size of the rust spores makes detection during inspection unlikely unless the plant is displaying symptoms of the disease.
Imports of logs and lumber involving tropical hardwood species (including Eucalyptus) into Hawai`i are regulated under separate provisions which have been in effect since 1995. The wood must be debarked or fumigated [Code of Federal Regulations – 7 CFR 319.40-5(c)]. Incoming wood packaging is regulated under ISPM#15; I think it unlikely that the treatments prescribed therein would kill any rust spores present.
Policy Responses in Other Vulnerable Countries
Australia
Austropuccinia psidii had been recognized as a potentially serious biosecurity threat to Australia as early as 1985 (publications cited by Carnegie et al. (2016). The introduction of ‘ōhi‘a rust to Hawai`i so alarmed plant health and conservation officials in Australia and New Zealand that they sent representatives half way around the world to participate in the North American Plant Protection Organization’s annual meeting in Newfoundland, Canada, in October 2007! Yet interest in Australia waned when large scale tree mortality and major impacts on industries did not immediately occur (Carnegie et al. 2016). The state of New South Wales listed the rust as a Key Threatening Process to the Natural Environment, but the federal agencies rejected a petition to do the same at a national level (Carnegie et al. 2016).
Groups of scientists are carrying out research with the goal of demonstrating that the rust is already having severe effects on key species in natural ecosystems, and probably significantly affecting a wider range of species (Carnegie et al. 2016; Winzer et al. 2019; Winzer et al. 2020)
In 2018 a scientist affiliated with the Australian Network for Plant Conservation published a draft conservation plan. Its development had input from staff at the Plant Biosecurity Cooperative Research Centre and the Australian Government Department of the Environment and Energy. The goal was to help direct and stimulate further research on critical questions and build awareness of the potentially devastating effects myrtle rust might have if it remains unchecked. As of April 2020, no funding had yet become available to finalize and implement the report (Dr Michael Robinson, Managing Director, Plant Biosecurity Science Foundation).
New Zealand
New Zealand has been more aggressive in its policy approach. It adopted a strategy when Australia announced arrival of the rust in 2010. The islands had bad luck – myrtle rust is believed to have been carried to New Zealand by wind from Australia across the Tasman Sea.
As soon as the rust was first detected in 2017, two government agencies initiated broad surveys of Myrtaceae across natural and urban areas, with active outreach to citizens (Toome-Heller et al. 2020). By April 2018, it was recognized that the pathogen was too widespread to be eradicated. Significant finds were made on the western side of the North Island and at the very northern tip of the South Island (see map in Beresford et al. 2019). At that point, the government changed its focus to long-term management of the disease.
A. psidii is still very much a focus for Maori (indigenous) groups, central and local government, community groups, Myrtaceae-based industries, and research institutions.
Several research programmes are currently looking for management options, including resistance breeding (Toome-Heller et al. 2020). See research plan and reports of results to date here. However, which plant species can become infected, and under what environmental conditions, remain unclear.
New Zealand researchers have made some findings that should be of concern to forest pathologists working with all Myrtaceae:
A. psidii can overwinter as a latent infection without reproducing.
A. psidii can reproduce sexually, although the importance of the sexual cycle in seasonal epidemic development is not yet understood and teliospores have only infrequently been found in New Zealand (Bereford et al. 2019).
the unique biotype found in South Africa has already been found to be pathogenic towards some New Zealand native Myrtaceae (Toome-Heller et al. 2020).
We can expect these finding to have implications for elsewhere, including in Hawaii.
Pathways of Introduction
It is thought probable that the rust was introduced to Hawai`i on cut foliage imported from Florida. The first Australian detection was at a cut flower facility (Australian Invasive Species Council).
CABI considers plants and plant parts (including cuttings, flowers, and germplasm) to be the principal pathway. Other pathways appear to be contaminated plant waste, timber, wood packaging and dunnage; and – over short distances – contaminated equipment and tools and clothing, shoes and other personal effects.
Conclusions
The saga of myrtle rust demonstrates both the biological and technical difficulties of controlling an airborne pathogen and the inability of the existing phytosanitary system to respond to new situations. Regulatory officials are obligated to demand levels of knowledge and certainty that just are not realistic. The gap is especially great at the crucial time – before an invasion or at its earliest stage — when phytosanitary actions might be most effective.
This saga also demonstrates that efforts often wane at the management and restoration stages. At least in Hawai`i and New Zealand, government resources are still being allocated to research possible resistance breeding or other possible long-term approaches. I refer you to the article by Enrico Bonello, me, and others about the need to provide sufficient resources to such efforts in the U.S.
Sources
Australian Invasive Species Council.2011. www.invasives.org.au Environmental impacts of myrtle rust Fact Sheet February 2011
Carnegie, A.J., A. Kathuria, G.S. Pegg, P. Entwistle, M. Nagel, F.R. Giblin. 2016. Impact of the invasive rust Puccinia psidii (myrtle rust) on native Myrtaceae in natural ecosystems in Australia. Biological Invasions (2016) 18:127–144
Code of Federal Regulations. January 1, 2005 (Title 7, Volume 5). 7 CFR319.40-5: Logs, lumber, and other unmanufactured wood articles – importation and entry requirements for specified articles. (available by using search engines/retrieval services at http://www.gpoaccess.gov/fr/index.html).
Code of Federal Regulations. January 1, 2005 (Title 7, Volume 5). 7 CFR319.37: Nursery stock, plants, roots, bulbs, seeds, and other plant products – prohibitions and restrictions on importation: disposal of articles refused importation. (available by using search engines/retrieval services at http://www.gpoaccess.gov/fr/index.html).
Loope, L. and A.M. La Rosa. 2008. An Analysis of the Risk of Introduction of Additional Strains of the Rust Puccinia psidii Winter (`Ohi`a Rust) to Hawa`i. Pacific Island Ecosystems Research Center
Stewart, J. E., A. L. Ross-Davis, R. N. Graça, A. C. Alfenas, T. L. Peever, J. W. Hanna, J. Y. Uchida, R. D. Hauff, C. Y. Kadooka, M.-S. Kim, P. G. Cannon, S. Namba, S. Simeto, C. A. Pérez, M. B. Rayamajhi, D. J. Lodge, M. Agruedas, R. Medel-Ortiz, M. A. López-Ramirez, P. Tennant, M. Glen, P. S. Machado, A. R. McTaggart, A. J. Carnegie, and N. B. Klopfenstein. 2018. Genetic diversity of the myrtle rust pathogen (Austropuccinia psidii) in the Americas and Hawaii: Global implications for invasive threat assessments. Forest Pathology 48(1): 1-13. https://doi.org/10.1111/efp.12378
Toome-Heller, M. W.W.H. Ho, R.J. Ganley, C.E.A. Elliott, B. Quinn, H.G. Pearson, B.J.R. Alexander. 2020. Chasing myrtle rust in New Zealand: host range and distribution over the first year after invasion. Australasian Plant Pathology
Winzer, L.F., K.A. Berthon, A.J. Carnegie, G.S. Pegg, M.R. Leishman. 2019. Austropuccinia psidii on the move: survey based insights to its geographical distribution, host species, impacts and management in Australia. Biological Invasions April 2019, Volume 21, Issue 4, pp 1215–1225
Winzer, L.F., K.A. Berthon, P. Entwistle, A. Manea, N. Winzer, G.S. Pegg, A.J. Carnegie, M.R. Leishman. 2020. Direct and indirect community effects of the invasive plant pathogen Austropuccinia psidii (myrtle rust) in eastern Australian rainforests. Biological Invasions. Volume 22, pages2357–2369 (2020)
Willow forest in the Tijuana River Valley killed by Kuroshio shot hole borer the “boom” part of the cycle photo by John Boland
I have blogged earlier about the damage caused by the Kuroshio shot hole borer (KSHB, Euwallacea kuroshio), which is one of two invasive shot hole borers established in southern California. The beetle and its symbiotic fungi had caused amazing levels of damage in the Tijuana River Valley in San Diego County, California. The wood borer is described here and here.
Most of the earlier blogs focused on the absence of a response by California’s phytosanitary agency and here – until John Kabashima created sufficient political demand for a response.
A scientist who has devoted considerable effort to understanding the KSHB is John Boland of Boland Ecological Services. He has posted annual reports analyzing five years of the outbreak in the Tijuana River Valley (see full citations at the end of the blog). His principal findings (Boland and Uyeda 2020): the invasion went through a boom and bust cycle, with willows in the wettest parts of the estuary having largely recovered. So far, Kuroshio shot hole borers have not re-infested the growing trees, despite the presence of all conditions seeming to favor invasion. His principal worry is enhanced invasion by the non-native grass or reed Arundo donax.
The study site is a coastal floodplain crossed by an intermittent stream. The Tijuana River valley provides several ecosystem services, including filtering pollutants before the water reaches the ocean, open space, and important wildlife habitat, including Critical Habitat for the federally endangered least Bell’s vireo (Vireo bellii pusillus).
There is a mosaic of forests of different ages and at different distances from the current flows. They range from wet forests growing in the current river beds; dry forests growing in older river beds that get some current flows; and scrub forests growing far from current river flows. All these forests are dominated by two willows: the black willow (Salix gooddingii) and the arroyo willow (Salix lasiolepis). Both are preferred hosts of KSHB; both are pioneer species that establish in disturbed wet areas; both resprout vigorously. The riparian scrub woodlands surrounding the forests are dominated by the perennial shrub, mule fat (Baccharis salicifolia), with scattered willows of both species (Boland and Uyeda 2020).
The river carries high levels of raw sewage and industrial waste from Tijuana, Mexico. Raw sewage contains important plant nutrients – nitrogen, phosphorus and potassium. The willows in or near the nutrient-enriched channel water were growing quickly and vigorously, and had wood characteristics that differed significantly from those of trees in the dry or scrub forests. Dr. Boland notes that these trees’ phloem sap is loaded with sugars from the fast-growing leaves, and xylem sap is loaded with nutrients from the enriched soil. His Enriched Tree Hypothesis (discussed further below) suggests that these nutrients promote fast growth of the symbiotic fungi and ideal conditions for KSHB (Boland and Woodward 2019).
Boland and his colleagues have carried out detailed annual field surveys of the infestation since 2015. Using the same study plots in each year, they analyzed infestation and mortality rates, canopy damage, and survivorship of tagged willows.
Funding originally came from the U.S. Navy and U.S. Fish and Wildlife Service – agencies probably worried about the potential destruction of the vireos’ habitat. As of 2019 KSHB had infested 91% of all the willows in the valley – estimated to be more than 350,000 willows. KSHB had killed 30% of the trees, or nearly 123,000 (Boland 2019). Dr. Boland considers this estimate to be an underestimate because he could not accurately carry out surveys of individual trees in the extensively-damaged Wet Forest units in 2018. There was considerable variation in pest impacts depending on host trees’ proximity to the intermittent river. Of all of the willow deaths in the valley, 93.8% occurred in the Wet Forests, 6.1% in the Dry Forests and 0.1% in the Scrub Forests. This variation occurred even though the sites contain the same willow species (Boland and Uyeda 2020).
Infestation rates over the four-year period averaged 99% of willows in the Wet Forest units, 82% in the Dry Forests and 3% in the Scrub Woodlands. Considering 2019 alone, the overall infestation rate was only 9%. Looking at differences among forest types, 1% of the willows in Wet Forests were infested (down from 95% in 2015), 29% of the willows in dry forests (down from 73% in 2016), and 0% of the willows in the scrub forests (down from 2% in 2018). (2019 infestation rates from Boland and Uyeda 2020; earlier years from Boland 2019.)
Infestation rates had to be very high before trees died, but then mortality was very high. Only after sites reached infestation rates of more than 95% did sites have significant mortality rates – and then, very high — up to 97%. In agreement with other findings, most of the high-mortality sites were in Wet Forest units. These had a mean maximum mortality rate of 49%. The mean maximum mortality rate was only 9% in Dry Forest and 2% in Scrub Forest units (Boland and Uyeda 2020).
The size of the tree is also important. In the Wet Forests, in 2019, infestation rates were 0% for seedlings and young trees; 3% for the relatively undamaged trees that are more than 5 years old; and 1% of the resprouting adult trees that had been broken during the first wave of invasion. KSHB prefers young trees with a trunk dbh of at least 4.5 cm. Smaller trees were generally avoided. Trees with very large dbh (> 30 cm) appear to be able to survive a KSHB attack (Boland and Uyeda 2020).
At the end of the five year period, Dr. Boland had documented interesting/puzzling findings.
Recovery of the willow forest in Tijuana River Valley – 2019 photo by John Boland
Wet Forests
KSHB in the valley went through a rapid boom-and-bust cycle. In the Wet Forests, KSHB infestation progressed over the course of a few months from barely noticeable to heavy infestation and dramatic canopy collapse. Infestation rates of 80 – 95% in the West Forests in 2015 and 2016 led to virtual elimination of the canopy between 2016 and 2017 as tunnel-ridden trees were broken by wind storms. These severe damage levels occurred over 94 acres (Boland and Uyeda 2020).
After apparently depleting their preferred hosts in the wettest parts of the forest, beetle numbers fell and host trees began a rapid recovery. Mean canopy cover rose from 5% in 2017 to 56% in 2019. This recovery has taken three forms: survival of a few, scattered mature infested trees (‘Big Trees’) which grew new wood over KSHB galleries (Boland 2019); resprouting of mature KSHB-damaged trees (‘resprouts’); and seeding of new trees (‘seedlings’). Some of the forests have recovered so much in just 4 years that they are now similar to their pre-KSHB stature (Boland and Uyeda 2020).
Dr. Boland suggests that KSHB is promoted by high nutrient (pollution) levels in the water, which result in rapid growth by trees near the most steady of the intermittent streams. He has developed an Enriched Tree Hypothesis (explained briefly below; for a full discussion, see Boland and Woodland 2019).
As of autumn 2019, beetles have not attacked the recovering hosts – despite apparently favorable conditions and the absence of management interventions. 2019 infestation rates were 3% of the remaining Big Trees, 2% of the resprouting trees, 1% of the young trees, and 0% of the seedlings. Dr. Boland suggests three possible reasons (Boland and Uyeda 2020), which I will discuss below.
The resprouting trees are now old & vigorous enough to flower
It is likely that these recovering willow forests will provide good breeding habitat for least Bell’s vireo (all Boland publications).
Dry Forests
Infestation in the Dry Forests spread more slowly – infestation rates averaged 82% in the Dry Forests over four years. The infestation progressed more slowly and the canopy remained mostly intact. But in 2019 the infestation rate in the Dry Forest was substantially higher than in the Wet Forest — 29% versus 1% (Boland and Uyeda 2020).
Still, only 16% of more than 200 willows tagged in February 2016 had been killed by KSHB by autumn 2019. Among the living trees were three quarters of trees already infested in 2016, and half of trees that became infested after 2016 (Boland and Uyeda 2020).
Lack of Reinfestation (Boland and Uyeda 2020).
The absence of reinfestation is surprising, especially because the conditions thought favorable to KSHB are all present:
1. The regenerating trees belong to host species known to be preferred – black and arroyo willows.
2. The regenerating trees have reached the preferred size with trunk dbh exceeding 4.5 cm. In fall 2019 the trees in the recovering Wet Forests included many resprouting trees with mean diameters of 6.5 cm, and many new seedlings with mean diameters of 11.7 cm.
3. Recovering forests are located in the preferred nutrient-rich sites. Sewage levels remain high.
4. The trees in the recovering forests are in the condition preferred by KSHB, i.e., the trees are fast-growing and vigorous.
5. The KSHB is present – in low numbers in the Wet Forests, more numerous in Dry Forests which are < 1 km away.
It is not known whether KSHB will eventually re-infest.
The KSHB infestation reversed the presence of large trees. Originally 53% of the large trees were in the Wet Forests, 38% in the Dry Forests. The KSHB invasion damaged so many of the trees in the Wet Forests that now they represent only 24% of all the ‘Big Trees’ in the Valley; 58% of the ‘Big Trees’ are now in the Dry Forests. In many Dry Forests the remaining tall trees form a continuous canopy layer, whereas in the polluted Wet Forests they are usually only single ‘Big Trees’ (Boland and Uyeda 2020).
Other plant species
Dr. Boland expresses great concern about the spread of the invasive plant, Arundo donax, in response to canopy openings caused by the initial invasion and canopy collapse (willow trees are Arundo’s only competitors in the valley).
Surveys during fall 2019 found that most plant species growing in the Tijuana River Valley are native, dominated by the willows (mean cover of 60%). The most abundant non-native species is castor bean (10% cover). Arundo had a mean cover of only 6% in the belt transects, but it was more abundant outside the transects. Arundo is spreading as rhizomes cut loose by bulldozing, disking, and mowing on property managed by International Boundary and Water Commission (Boland and Uyeda 2020). Both willows and Arundo had increased their percent cover between 2018 and 2019 (Boland 2019).
Dr. Boland’s Recommendations (Boland and Uyeda 2020)
1) The different invasion trajectories in the three habitat types contradict some researchers’ expectation that all trajectories are similar from regardless of site characteristics or that a light infestation must be recent while a heavy infestation must be old.
2) Unique characteristics of the Tijuana River valley – especially the high sewage levels – mean that the severe infestation and damage seen there should not be expected to occur at other natural, unpolluted riparian sites.
3) Dr. Boland disputes recommendations that “heavily infested” trees be removed because they are doomed and support beetle reproduction. Although Dr. Boland studied primarily willows, he did evaluate 24 California sycamores (Platanus spp.) that had been planted in various parts of the valley.
He found that none had died and only two (8%) were infested. The two infested trees were lightly infested and growing near the sewage-enriched stream. Dr. Boland concluded that sycamores were also unlikely to be heavily infested and killed in habitats less favorable to shot hole borers (Boland 2019).
4) The ease with which native willows became densely established in wet forest sites after the first infestation wave leads Dr. Boland to advocate reliance on natural restoration projects … as long as Arundo invasion can be controlled.
5) Avoid over-fertilization or over-watering of trees in planted landscapes.
6) Focus detection searches for KSHB in nutrient-enriched areas. … e.g., near storm drain outfalls.
Research recommendations:
A) Determine why KSHB has not substantially reinvaded the recovering willow forests despite the presence of preferred species in “correct” condition and size. Dr. Boland suggests testing of three hypotheses:
Induced response of hosts. Have the infested willows changed their chemistry as a result of the borer attack, thus increasing their resistance ….
Overall forest structure. Have the less dense and more mixed forest stands reduced attractiveness to the beetle?
A disease or predator. Has a biocontrol agent been introduced accidentally? None has yet been identified …
B) Understand the possible mechanisms for the high initial infestations rates in the Wet Forests.
To evaluate the Enriched Tree Hypothesis measure the sugars and nutrients (both concentrations and loading rates) in trees subject to differing amounts of sewage or fertilizers. Then conduct controlled trials in the lab on the growth response of ISHB’s fungal symbionts to various sugar and nutrient concentrations and loading rates.
Evaluate whether willows growing in the nutrient-enriched sites produced fewer tannins that might inhibit beetle and fungal growth.
C) Can ISHB disperse by wind? Dr. Boland recommends searching for ISHB in the air high above infested trees; this could involve the use of nets or traps attached to aircraft, hot-air balloons, helium balloons or drones.
D) Determine whether surviving mature trees have superior characteristics re: morphology, vigor, and pest or disease resistance that make them less vulnerable to KSHB attack.
E) Incorporate site and ecology data and varying levels of host vulnerability into models predicting KSHB impacts. Include the ecological costs of removing the trees.
My questions
Are other scientists applying these findings in their research on KSHB or polyphagous shot hole borer outbreaks in other parts of California? I am particularly interested in the issues of possible resistance in some willows – innate or induced; and the potential role of excess nutrients in promoting fungal and beetle growth. Are they finding the ecological components of the Enriched Tree Hypothesis to be helpful in defining the impact of PSHB outbreaks in other parts of the state, and of older ages?
SOURCES
Boland, J.M. 2109. The Ecology and Management of the Kuroshio Shot Hole Borer in the Tijuana River Valley. Final Report for Naval Base Coronado under Cooperative Agreement N62473-18-2-0008
Boland, J.M. and D.L. Woodward. 2019. Impacts of the invasive shot hole borer (Euwallacea kuroshio) are linked to sewage pollution in southern Calif: the Enriched Tree Hypothesis. PeerJ 7:6812
Boland, J.M. and K.A Uyeda. 2020. The Ecology and Management of the Kuroshio Shot Hole Borer in the Tijuana River Valley 2019-20 (Year 5) Final Report. For Naval Base Coronado, Department of Navy and Southwest Wetlands Interpretive Association. Under Cooperative Agreement N62473-18-2-0008
We welcome comments that supplement or correct factual information, suggest new approaches, or promote thoughtful consideration. We post comments that disagree with us — but not those we judge to be not civil or inflammatory.
For a detailed discussion of the policies and practices that have allowed these pests to enter and spread – and that do not promote effective restoration strategies – review the Fading Forests report at http://treeimprovement.utk.edu/FadingForests.htm
Here we go again … another Asian longhorned beetle population established in the U.S.
For the ninth time in 24 years, the Asian longhorned beetle (ALB) has been found in North America – this time in South Carolina.
This means thousands – perhaps tens of thousands – of trees will be removed. Thousands more will be injected with imadacloprid. Millions of dollars will be spent. There will be uncounted aesthetic and spiritual losses. There will be unmeasured damage to at least the local environment – which probably includes bottomland hardwood forests – protection of which South Carolina has declared to be a conservation priority. All this destruction is necessitated by the need to prevent catastrophic damage to North America’s hardwood forests by the ALB.
By early August I have learned that the South Carolina outbreak has been present for seven years or longer, and that it might be related to the Ohio outbreak (which was detected in 2011 but was probably introduced at least four years earlier). APHIS reports that, as of the end of July, nearly 1,300 infested trees had been detected. The area around the neighborhood where the detection was made is swampy – complicating search and removal operations and probably home to many box elder and willows – preferred hosts for the ALB.
Why did we let this happen? Why do we persist with a policy that has allowed repeated introductions of this pest via the well-documented wood packaging pathway? After all, we learned about this risk 22 years ago – after the ALB introductions to New York and Chicago. We have had plenty of evidence that the policy is failing. We know how to stop this. Why do we – through our elected and appointed government officials – not act to prevent it?
What We Need: a New, Protective Policy
With live pests continuing to be present in wood packaging 14 years after the U.S. and Canada imposed the treatment requirements in ISPM#15 – and 21 years after we required China to treat its wood packaging – we urgently need better federal policy. I have long advocated:
USDA APHIS join Bureau of Customs and Border Protection in penalizing violators for each violation; stop allowing five violations over a 12-month period before applying a penalty.
APHIS and the Canadian Food Inspection Agency (CFIA) should apply their rights under Section 5.7 of the World Trade Organization Sanitary and Phytosanitary Agreement to immediately prohibit China from packaging its exports in wood. China can use crates and pallets made from such alternative materials as plastic, metal, or oriented strand board.
APHIS and CFIA should being the process of supporting permanent application of this policy to China and other trade partners with poor compliance records. This step would require that they cite the need for setting a higher “level of protection” and then prepare a risk assessment to justify adopting more restrictive regulations.
USDA Foreign Agriculture Service (FAS) should assist U.S. importers to determine which suppliers reliably provide wood packaging that complies with ISPM#15 requirements.
USDA FAS and APHIS should help importers convey their complaints about specific shipments to the exporting countries’ National Plant Protection Organizations (NPPOs; departments of agriculture).
APHIS should increase pressure on foreign NPPOs and the International Plant Protection Convention more generally to ascertain the reasons ISPM#15 is failing and to fix the problems.
APHIS should fund more studies and audits of wood packaging to document the current efficacy of the standard, especially
Update the Haack study of pest approach rate.
Determine whether high rates of pest infestation of wood bearing the ISPM#15 mark results from fraud or failures of treatment – and whether any failures are due to mistakes/misapplication or shortcomings in the treatment themselves.
Allocate the risk among the three major types of wood packaging: pallets, crates, and dunnage.
These folks work for us – tell them to protect our forests!
Tree-Smart also has a Twitter account: @treeSMARTtrade
Justification
The ALB poses a threat to 10% of US forests and nearly all of Canada’s hardwoods, so eradication of the South Carolina outbreak is essential. For a longer discussion of ALB introduction history, the threat, and eradication efforts to date, visit here. https://www.dontmovefirewood.org/pest_pathogen/asian-long-horned-beetle-html/).
Another ALB Outbreak in the US: No Surprise
This Chinese insect is a world traveler. It has been detected 36 times outside its natural range: in North America, Europe, and Japan. Seventeen of these outbreaks have been detected since 2012 (Eyre & Haack 2017). These 17 introduction have occurred six years or later after the 2006 implementation of the International Standard for Phytosanitary Measures (ISPM) #15 – which was intended to reduce the likelihood of such introductions. .Ten of the outbreaks have been eradicated (Eyre & Haack 2017; APHIS press release October 2019). This includes four in the United States and Canada; see here.
Despite U.S. and international efforts, ALB and related pests have been detected continuously in imported goods. U.S. and European data (Eyre and Haack 2017) document rising numbers of Cerambycids detected in wood packaging in recent years. (For a description of pest prevention efforts, see Fading Forests II and III here and this blog).
It is also not surprising that the newly introduced pest is from China. It has long been among countries with the worst records on implementing ISPM#15.
The APHIS-CBP joint study of pest interceptions over the period 2012 – 2017 (Krishnankutty et al. 2020b) found the highest numbers of interceptions came from Mexico, China, and Turkey. During the period 2011 – 2016, China accounted for 11% of interceptions (APHIS interception database – pers. comm. January 2017).
These numbers reflect in part the huge volumes of goods imported from China. But China’s poor performance has continued, perhaps even increased in recent years. For example, consider the choice of wood used to manufacture packaging. Authorities recognized by the late 1990s that wood from plantations of Populus from northern China was highly likely to be infested by the Asian longhorned beetle. Yet, more than a dozen years later, this high-risk wood was still being used: between 2012 and 2017, the ALB was intercepted six times in wood packaging made of Populus wood – each time originating from a single wood-treatment facility in China (Krishnankutty et al. 2020b).
The location just outside Charleston also is not a surprise. Charleston ranked seventh in receipt of incoming shipping containers in 2018. Charleston received 1,022,000 containers, or TEUs measured as 20-foot equivalents, in 2018 (DOT report). This was a 14% increase over the 894,000 TEUs in 2017 http://www.marad.dot.gov/MARAD_statistics/index.html – click on “trade statistics”, then “US Waterborne trade” (1st bullet). I expect decreased import volumes in 2019 and 2020 due to the tariffs/trade war and the 2020 economic crash linked to the Covid-19 virus.
Why US and International Policy Still Fails
Leung et al. (2014) estimated that implementation of the International Standard of Phytosanitary Measures (ISPM)#15 resulted in only a 52% reduction in pest interceptions. They concluded that continued implementation at the 2009 level of efficacy could triple the number of wood borers established (not just intercepted) in the U.S. by 2050.
Since 2010 the Department of Homeland Security’s Bureau of Customs and Border Protection (CBP) has found an average of 794 shipments infested by pests each year (Harriger). In 2019 specifically, live pests were found in 747 shipments (Stephen Brady, CBP, April 2020). These violations were occurring four to 13 years after the U.S. began implementing ISPM#15 in 2006. According to my calculations, based on estimates of pest approach rates by Haack et al. (2014), these detections probably represented about eight percent of the total number of infested shipments entering the country each year.
And there are good reasons to think this estimate is low. First, Haack et al. (2014) did not include imports from China, Canada, or Mexico in their calculations. Both China and Mexico rank high among countries with poor compliance records. Second, Haack and Meissner based their calculations on 2009 data – 11 years out of date. Since 2009, ISPM#15 has been amended to make it more effective. The most important change was restricting the size of bark remnants that may remain on wood. Also, countries and trading companies have 11 more years of implementation – so they might have improved their performance. I have asked several times that APHIS commission a new analysis of Agriculture Quarantine Inspection Monitoring data. We all need an up-to-date determination of the pest approach rate, not only before but also after the CBP action. Without it, there’s no evidence whether the more aggressive enforcement stance CBP adopted in 2017 (see below) has led to reductions in non-compliant shipments at the border.
Another demonstration of the failure of ISPM#15 is the repeated presence of the velvet longhorned beetle (Trichoferus (=Hesperophanes) campestris) in wood packaging and its establishment in at least three states (Krishnankutty, et al. 2020a; also see the discussion in my recent blog here).
Astoundingly, data indicate that 97% of wood packaging infested with pests bears the stamp certifying that the wood has been treated according to the requirements of ISPM#15 – and hence should be pest-free (Eyre et al. 2018; CBP interception data). In other words, the presence of the stamp is not a reliable indicator of whether the wood has indeed been treated nor that it is pest-free. Scientists have speculated for years why this is the case. ALB’s new arrival provides an impetus to finally answer this question and to ensure policy reflects the answer.
What Federal Agencies Are Doing to Better Prevent Introductions
In contrast to such a comprehensive approach, this is what changes are under way.
CBP strengthened its enforcement in November 2017. The agency’s total “enforcement actions” increased by 400% from 2017 to 2018 (Sagle, pers. comm). The 2019 data show decreases, in absolute numbers, from earlier years in all categories: a 19% decrease below 2010-2018 in average number of shipments intercepted; a 13% decrease in number of shipments intercepted because the wood packaging lacked the ISPM#15 mark; and a decrease of 6% in the number of shipments intercepted that had a quarantine pest (Stephen Brady, CBP, April 2020). However, one year of interception data do not provide a basis for saying whether CBP’s stronger enforcement has resulted in a lower number of shipments in violation of ISPM#15 approaching our shores. Again, I call for APHIS to repeat Haack et al. (2014) study.
Harriger reported that CBP is also trying harder to educate importers, trade brokers, affiliated associations, CBP employees, and international partners about ISPM#15 requirements. CBP wants to encourage them to take actions to reduce all types of non-compliance: lack of documentation, pest presence in both wood packaging and shipping containers, etc.
APHIS has not altered its long-standing policy of allowing an importer to rack up five violations over a 12-month period before imposing a penalty. Instead, APHIS has focused on “educating” trade partners to encourage better compliance. For example, APHIS worked with Canada and Mexico – through the North American Plant Protection Organization — to sponsor workshops for agricultural agencies and exporters in Asia and the Americas
APHIS also planned to host international symposia on wood packaging issues as part of events recognizing 2020 as the International Year of Plant Health. These symposia have been postponed by travel and other restrictions arising from the coronavirus pandemic.
The Broader Significance of Continuing Wood Packaging Problems
The premise of the international phytosanitary system – the Agreement on the Application of Sanitary and Phytosanitary Standards (SPS Agreement) and the International Plant Protection Convention (IPPC) – is that importing countries should rely on exporting countries to take the actions necessary to meet the importing countries’ plant health goals. The ISPM#15 experience undermines the very premise of these international agreements.
If we cannot clean up the wood packaging pathway – which involves boards or logs that are, after all, already dead – it bodes poorly for limiting pests imported with other commodities that are pathways for tree-killing pests – especially living plants (plants for planting). Living plants are much more easily damaged or killed by phytosanitary measures, so ensuring pest-free status of a shipment is even more difficult. (A longer discussion of the SPS Agreement and IPPC is found in Chapter III of Fading Forests II, available here.
SOURCES
Eyre, D., R. Macarthur, R.A. Haack, Y. Lu, and H. Krehan. 2018. Variation in Inspection Efficacy by Member States of SWPM Entering EU. Journal of Economic Entomology, 111(2), 2018, 707–715)
Haack RA, Britton KO, Brockerhoff EG, Cavey JF, Garrett LJ, et al. (2014) Effectiveness of the International Phytosanitary Standard ISPM No. 15 on Reducing Wood Borer Infestation Rates in Wood Packaging Material Entering the US. PLoS ONE 9(5): e96611.
Krishnankutty, S.M., K. Bigsby, J. Hastings, Y. Takeuchi, Y. Wu, S.W. Lingafelter, H. Nadel, S.W. Myers, and A.M. Ray. 2020a. Predicting Establishment Potential of an Invasive Wood-Boring Beetle, Trichoferus campestris (Coleoptera:) in the United States. Annals of the Entomological Society of America, XX(X), 2020, 1–12
Krishnankutty, S., H. Nadel, A.M. Taylor, M.C. Wiemann, Y. Wu, S.W. Lingafelter, S.W. Myers, and A.M. Ray. 2020b. Identification of Tree Genera Used in the Construction of Solid Wood-Packaging Materials That Arrived at U.S. Ports Infested With Live Wood-Boring Insects. Commodity Treatment and Quarantine Entomology
Leung, B., M.R. Springborn, J.A. Turner, E.G. Brockerhoff. 2014. Pathway-level risk analysis: the net present value of an invasive species policy in the US. The Ecological Society of America. Frontiers of Ecology.org
Meissner, H., A. Lemay, C. Bertone, K. Schwartzburg, L. Ferguson, L. Newton. 2009. Evaluation of Pathways for Exotic Plant Pest Movement into and within the Greater Caribbean Region. Caribbean Invasive Species Working Group (CISWG) and USDA APHIS Plant Epidemiology and Risk Analysis Laboratory
USDA APHIS interception database – pers. comm. January 2017.
USDA APHIS press release dated September 12, 2018
U.S. Department of Agriculture, Press Release No. 0133.20, January 27, 2020
We welcome comments that supplement or correct factual information, suggest new approaches, or promote thoughtful consideration. We post comments that disagree with us — but not those we judge to be not civil or inflammatory.
Another unique ecosystem being severely damaged by non-native tree-killing pests are the wetlands dominated by black ash (Fraxinus nigra). Black ash typically grows in fens, along streams, or in poorly drained areas that often are seasonally flooded. Such swamps stretch from Minnesota to Newfoundland; in the three states of Michigan, Wisconsin, and Minnesota, they cover a total of over 2 million hectares (Kolka et al. 2018).
Recent research allows us to understand the impending loss to these unique ecosystems that will be caused by the emerald ash borer (EAB).
Hydrology is the dominant factor that influences a host of ecosystem functions in black ash wetlands. Water levels are largely determined by a combination of precipitation and evapotranspiration rates. Black ash can thrive in wetter areas than most other tree species (Slesak et al. 2014). Water tables in these swamps are typically above the surface throughout early spring, followed by drawdown below the surface during the growing season with periodic rises following rain events. Water table drawdown coincides with peak evapotranspiration following black ash leaf out, demonstrating the fundamental control that this species has on animal and other plant communities (Kolka et al. 2018; Slesak et al. 2014).
Ecological Importance
Black ash generally dominate the canopy of these wetlands. Ash density can range from about 40% to almost 100%. Several other tree species are present, including northern white cedar (Thuja occidentalis), red maple (Acer rubrum), American elm (Ulmus americana) (Kolka et al. 2018), quaking aspen (Populus tremuloides), American basswood (Tilia americana), and bur oak (Quercus macrocarpa) (Slesak et al. 2014), balsam fir (Abies balsamea), balsam poplar (Populus balsamifera), and speckled alder (Alnus incana) (Youngquist et al. 2020). Black ash, by maintaining low water levels during the growing season, creates conditions under which these other trees can live but not thrive (summary of study by B.J. Palik, USDA Forest Service, here. Most other species lack the physiological adaptations of black ash or face pathogenic constraints (e.g., Dutch elm disease on American elm Ulmus americana) (Kolka et al. 2018).
Ash trees in these swamps are uneven-aged with canopy tree ages ranging from 130–232 years (Slesak et al. 2014). This complexity provides important habitat for many wildlife species, including ground beetle community assemblages (Kolka et al. 2018) and an abundance of aquatic macroinvertebrates. These are characterized and dominated by mollusks (Sphaeriidae, Lymnaeidae, Physidae), annelids (Lumbriculidae, Hirudinea), caddisflies (Limnephilidae, Leptoceridae), and dipterans (Chironomidae, Culicidae) (Youngquist et al. 2020).
a black ash swamp; source: Flickr
A major concern is that loss of trees – especially ash – might result in open marshes dominated by grasses, especially lake sedge (Carex lacustris). Conversion to sedge-dominated marshes has been observed in areas where trees have been removed as part of experiments to test various ecosystem responses to loss of the ash component (Slesak et al. 2014). Even if other trees took the place of ash, the substitutes might not support the same animal communities (see below).
Impact of Emerald ash borer and loss of black ash
Black ash is highly susceptibility to the EAB (Engelken and McCullough, 2020), so scientists expect severe impacts of the invasion in ash-dominated wetlands and – to a somewhat lesser extent — in forested stream systems’ riparian areas (Engelken and McCullough, 2020). They expect cascading impacts on 1) hydrology; 2) plant communities; 3) wildlife; 4) Native American cultures; and possibly even storage of carbon in vegetation and soils (Kolka et al. 2018).
1) Hydrology
Experiments suggest that loss of ash will cause higher water tables, especially during late summer and fall (Kolka et al 2018). This will result from reductions in evapotranspiration as large trees are replaced by shrubs and grasses (see below) (Kolka et al. 2018; Slesak et al. 2014). The higher water table might be exacerbated if higher annual precipitation levels predicted by climate change models occur. On the other hand, these models also predict a simultaneous increase in longer droughts, which might partially counteract higher precipitation and reduced evapotranspiration (Kolka et al. 2018). If they occur, these possible increases in drought length and frequency might enhance the establishment of less water-tolerant non-ash tree species in former black ash wetlands.
2) Plant Communities
Higher water tables are expected to reduce tree densities and promote conversion to open or shrub-dominated marshes. Several of the possible alternative tree species do not thrive as well as black ash under current conditions (Kolka et al. 2018). However, new hydrologic conditions might make forest restoration even more difficult because herbaceous plants transpire less water than trees, thus exacerbating the rising water tables (Slesak et al. 2014).
In upper Michigan, experiments which killed ash by cutting or girdling did not lead to an increase in growth rates of the remaining canopy species despite the increase in available resources (e.g., sunlight and nutrients) – presumably because of the raised water table (Kolka et al. 2081).
While some studies have found that black ash seedlings and saplings dominated the woody component of the swamp understory up to three years after ash were experimentally removed (Kolka et al. 2018), Engelken and McCullough (2020) found only eight saplings and a single seedling.
Scientists have planted several tree species in experiments to see which might be used to maintain the forested wetlands in the absence of black ash. The results are a confusing mix. Some species grew well once established – but had low levels of seedling establishment. Some trees planted on elevated microsites (hummocks) had the greatest survival and growth rates. (For specific data, see Kolka et al. 2018). A further consideration is tree species’ ability to adapt to warming temperatures already evident and expected to increase in coming decades (Slesak et al. 2014).
Consequently, Slesak et al. (2014) think it is likely that the EAB invasion will alter vegetation dynamics and cause a shift to an altered ecosystem state (e.g., open marsh condition) with higher water tables. They caution that the degree of ecosystem alteration will vary depending on site hydrology, annual precipitation, and period of time necessary for establishment of deeper rooted vegetation.
3) Wildlife
Moreover, any changes in vegetation will also affect the biota in more subtle ways through altered nutrient cycles. Black ash leaf litter is highly nutritious, having some of the highest nitrogen, phosphorus, and cation contents of any hardwood forest species (Kolka et al. 2018). Black ash leaves also decompose faster than most alternative tree species’ leaves (summary of Palik USDA Forest Service, here; Youngquist et al. 2018).
Youngquist et al. (2018) studied litter breakdown, litter nutritional quality, and growth of a representative invertebrate litter feeder – larvae of a shredding caddisfly (Limnephilus indivisus). They found that the larvae’s risk of death increased by a factor of three times or more when caddisflies were fed American elm, balsam poplar, or lake sedge leaves compared to black ash leaf litter. Even when the larvae lived – but matured more slowly because of the lower nutrition value of the leaves – they would still be vulnerable because they must reach metamorphosis before pond dry-down. In any planting done to maintain forested quality of wetlands, need to consider the nutritional quality of the leaf litter provided by replacements. Speckled alder was only apparently acceptable substitute; it was second to black ash in acceptability to caddisflies (Youngquist et al. 2020)
In fact, Youngquist et al. (2020) concluded that plant and detritivore biodiversity loss due to EAB invasion could alter productivity and decomposition at rates comparable to other anthropogenic stressors (e.g., climate change, nutrient pollution, acidification). The result will be altered biogeochemical cycles, resource availability, and plant and animal communities.
Scientists are also concerned about the impact of ash tree mortality on forest connectivity. Conversion of wooded swamps to shrub-and sedge-dominated wetlands will result in the loss of important micro-habitats that are already limited across the forested landscape and may also reduce availability of critical habitat for migrating birds. These changes will exacerbate on-going changes in land use in the Great Lakes region that are causing loss of forest habitat and forest homogenization. As yet, the magnitude of the impact on wildlife is unclear (Kolka et al. 2018).
black ash baskets – displayed at 2006 conference photo by Faith Campbell
4) Cultural importance – baskets
Native Americans living in the range of black ash have utilized the wood to make baskets and other tools for thousands of years. Baskets had numerous uses, such as packs for carrying items, fish traps, and for preparing food and storing household items. Ash items also had ceremonial uses and they are highly sought as gifts and in trade. The skill needed to select a good tree and work the wood is handed down through the generations and is an important part of tribes’ culture (Benedict 2010).
Discussion of these cultural traditions can be found as Powerpoints here and here.
Concerned by the spread of EAB and probable impact on black ash swamps, the USDA Forest Service has initiated major research studies with the goal of filling in the numerous knowledge gaps and developing management recommendations. A large-scale study using various manipulations to simulate the EAB invasion was initiated in the Chippewa National Forest in northern Minnesota in 2009. A companion study began in the Ottawa National Forest in Michigan in 2010 (Kolka et al. 2018). The Slesak, Youngquist, and Kolka publications cited in this blog report results of some of the studies in this project. Other studies of black ash conditions, including regeneration, at various stages of the EAB invasion wave are being carried out by Deb McCullough, Nate Siegert, and others. They are working at sites from Michigan to New England (D.G. McCullough, pers. comm.).
Posted by Faith Campbell
We welcome comments that supplement or correct factual information, suggest new approaches, or promote thoughtful consideration. We post comments that disagree with us — but not those we judge to be not civil or inflammatory.
For a detailed discussion of the policies and practices that have allowed these pests to enter and spread – and that do not promote effective restoration strategies – review the Fading Forests report here.
For a great discussion of black ash basketweavers, see Anne Bolen, A Silent Killer: Black Ash Basket Makers are Battling a Voracious Beetle to Keep their Heritage Alive, American Indian Magazine, Spring 2020, available here.
Engelken, P.J. and D.G McCullough. 2020. Riparian Forest Conditions Along Three Northern Michigan Rivers Following Emerald Ash Borer Invasion. Canadian Journal of Forest Research. Submitted
Kolka, R.K., A.W. D’Amato, J.W. Wagenbrenner, R.A. Slesak, T.G. Pypker, M.B. Youngquist, A.R. Grinde and B.J. Palik. 2018. Review of Ecosystem Level Impacts of Emerald Ash Borer on Black Ash Wetlands: What Does the Future Hold? Forests 2018, 9, 179; doi:10.3390/f9040179 www.mdpi.com/journal/forests
Slesak, R.A., C.F. Lenhart, K.N. Brooks, A.W. D’Amato, and B.J. Palik. 2014. Water table response to harvesting and simulated emerald ash borer mortality in black ash wetlands in MN, USA. Can. J. Forestry. Res. 44:961-968.
Youngquist, M.B., C. Wiley, S.L. Eggert, A.W. D’Amato, B.J. Palik, & R.A. Slesak. 2020. Foundation Species Loss Affects Leaf Breakdown and Aquatic Invertebrate Resource Use in Black Ash Wetlands. Wetlands. Society of Wetland Scientists
Posted by Faith Campbell
We welcome comments that supplement or correct factual information, suggest new approaches, or promote thoughtful consideration. We post comments that disagree with us — but not those we judge to be not civil or inflammatory.
For a detailed discussion of the policies and practices that have allowed these pests to enter and spread – and that do not promote effective restoration strategies – review the Fading Forests report at http://treeimprovement.utk.edu/FadingForests.htm