Where is APHIS going?

As indicated by Strategic Plans and Annual Reports

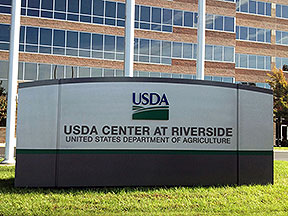
APHIS HQ in Riverside Maryland

In recent months, APHIS has released its 2019–2023 Strategic Plan and its 2018 annual report – which outlines how well the agency is doing in achieving goals from the 2015-2018 Strategic Plan. There is lots of information in these documents – but it is often presented in ways that make understanding it difficult. Still, I will attempt to compare the APHIS’ 2015 Strategic Plan and the 2019 Plan as well as review recent annual reports to see what priorities APHIS has set and how well it is realizing them.

APHIS’ Mission

According to the APHIS website, the agency’s mission is to safeguard U.S. agricultural and natural resources against the entry, establishment, and spread of economically and environmentally significant pests and to facilitate the safe trade of agricultural products.

The 2019 Plan shortened this Mission: To safeguard the health, welfare, and value of American agriculture and natural resources.

The 2019 Plan links the Mission tightly to U.S. Department of Agriculture priorities, e.g., honesty and integrity, commitment, accountability, reliability, and responsible stewardship of taxpayer resources. There follow promises to deliver services with a customer focus, efficiency and responsiveness, and ensuring that phytosanitary protection is at a reasonable cost. There is great emphasis in the 2019 plan on understanding how agricultural businesses operate, collaborating with partners, and seeking alternatives to regulation.

USDA Secretary Sonny Perdue

Goals

The 2019 Strategic Plan also amends the agency’s goals – they are much more general, less specific. The new goals emphasize program efficiency, collaborative approaches, and empowering employees. Perhaps these changes were made because the 2019 Plan covers the entire agency while the earlier (2015) Plan guided only Plant Protection and Quarantine (PPQ. However, I fear that the new goals reflect a much greater emphasis on non-regulatory approaches.

Contrasting Goals

The 2015 Strategic Plan’s three goals are:

1. Strengthen APHIS Plant Protection and Quarantine’s (PPQ) pest exclusion system;

2. Optimize domestic pest management and eradication programs; and

3. Increase the safety of agricultural trade to expand economic opportunities in the global marketplace.

The 2019 Strategic Plan goals:

1. Deliver efficient, effective, and responsive programs.

2. Safeguard American agriculture.

3. Facilitate safe U.S. agricultural exports.

I excluded from my analysis generalized goals and objectives pertaining to employee training, empowerment, etc.

Each of the plans’ goals is supported by several objectives, and in the 2019 Plan by tactics. These are the specific actions that are to be taken – and progress measured. All the objectives and actions in the 2015 Strategic Plan are relevant to APHIS’ Plant Protection and Quarantine program, whereas only a few of the 2019 Plan are.

Will this mean that we will lose track of what is happening in important areas?

For now, I provide a summary of events and progress as reported in the annual reports from 2015 to 2018.

2015 Strategic Plan Goal 1. Strengthen PPQ’s pest exclusion system. The objectives called for addressing pest risks at the first opportunity – preferably at the point of origine; and making better use of the information the agency collects to target and reduce pest threats.

Strategic Plan Goal 2. Optimizing pest management and eradication. The objectives called for closer coordination with partners to focus combined resources on obtaining the greatest results.

Strategic Plan Goal 3: Increase the safety of agricultural trade to expand economic opportunities in the global marketplace. These objectives integrated APHIS into collaborating with foreign counterparts to promote the development and use of internationally and regionally harmonized, science-based phytosanitary measures. The purpose is to reduce barriers to trade, especially U.S. agricultural exports.

APHIS also promised to use the best available science, data, and technologies to strengthen the agency’s effectiveness and deliver results for the industries it serves.

Assessing Progress

Unfortunately, APHIS did not stick to standardized metrics in the annual reports. This lapse undermines efforts to use the reports to evaluate progress. Use of different metrics are apparent in reporting on a) numbers of pre-clearance programs, b) Asian gypsy moth detections; c) volumes of seed imported; d) amounts of illegal imports seized.

Progress on Goal 1, Objective 1: Address Risks Early

The first opportunity to counter a pest risk is offshore – before the product or crate or container even starts its journey to the U.S.

APHIS has expanded its off-shore pre-clearance programs under which shipments of fruit, vegetables, bulbs and plants are inspected overseas – so as to catch pests before the products even begin their journey. Between 2015 and 2018, the number of programs grew from 30 programs in an unspecified number of countries to programs covering 72 different types of commodities in 22 countries.

APHIS is concerned about the pest risks associated with the huge volume of ornamental plant cuttings shipped to the US. As pointed out in the 2017 report, more than half of the bedding plants sold at retail started from a cutting produced in a greenhouse located offshore – usually in a tropical or subtropical country. The high-volume imports impose a heavy burden on inspectors at APHIS’ 16 Plant Inspection Stations. APHIS already had a small program encouraging producers to follow “clean” procedures in growing plants; in 2016 it involved 17 facilities. That same year, APHIS began framing a larger program that would provide incentives to encourage production facilities voluntarily to adopt integrated pest management measures. However, a six-month test in 2017 did not demonstrate that the program brought about a statistically significant reduction in risk. So PPQ and its partners in the U.S. nursery industry agreed to repeat the pilot during the 2018–2019 shipping season and refine the voluntary certification program (2018 report).

Post-Entry Safeguards

A second line of defense is quarantine within the United States after plants are imported – so-called “post-entry quarantine”. This program allows importers to bring in small numbers of plants that pose a particularly high risk of transporting pests so that they can be incorporated into U.S. agricultural (including horticultural) production. These plants are placed in a certified quarantine facility for close observation – usually for a two-year period. Program requirements are described here. Over the years covered by these annual reports, the number of plants released from PEQ varied considerably – as high as 898 in 2017, half as many (425) in 2018, with intermediate numbers in the earlier years. The number of species has varied less – between 10 and 14, with the highest in 2017. I was unable to detect a pattern.

Results of these efforts – Numbers of pests detected

1. Detections at the Ports

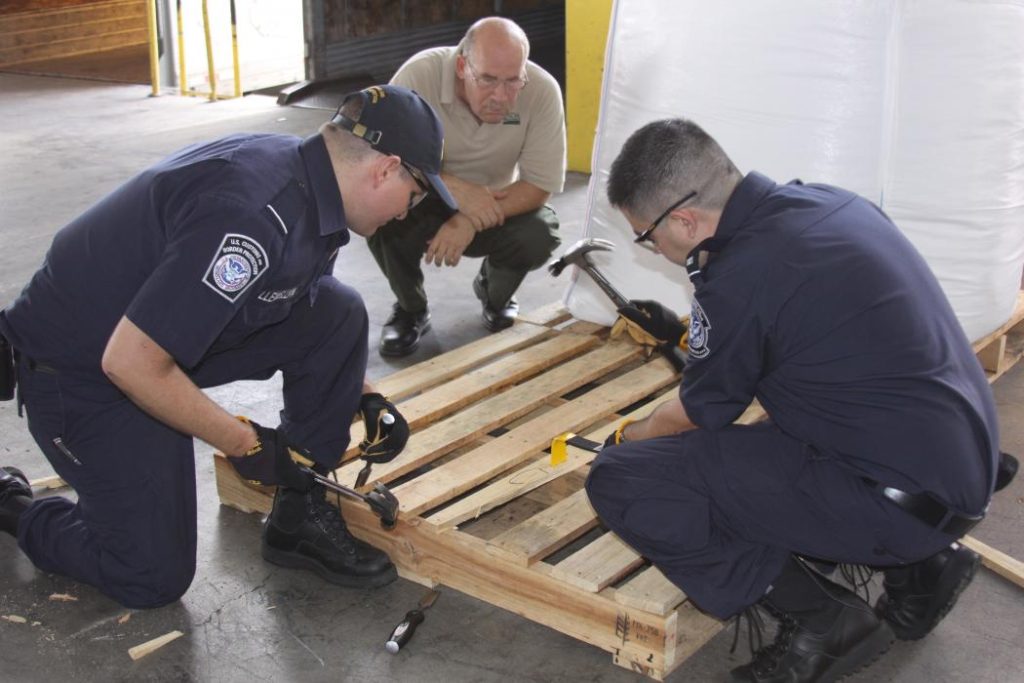
CBP inspectors examining wood packaging material

The 2015 report stated that the agency had detected more new pest detections and saw higher numbers of pest outbreaks than in previous years (but it did not provide specific numbers). Subsequent reports show declines in pests detected (although we cannot evaluate the “pest approach rate” because key information is not collected) [see Appendix II of Fading Forests III, available here] In 2016, APHIS identified 162,000 pests in imported shipments; of this total, 73,700 were quarantine pests. The 2017 report said APHIS identified 143,411 pests in imported shipments; of this total, 71,158 were quarantine pests. In 2018, APHIS identified 140,822 pests; nearly half of this total were quarantine pests.

A particularly dangerous pest: Asian Gypsy Moth 

Among the detections reported are those of the Asian gypsy moth egg masses on ships from Asia.

Phytosanitary officials and conservationists have been concerned about this threat since the early 1990s. APHIS and its Canadian counterpart (Canadian Food Inspection Agency) and the two countries’ customs agencies have worked together since then to minimize the likelihood that AGM egg masses will be transported on ships or hard cargo (containers, automobiles, etc.). The most important step was the adoption by the North American Plant Protection Organization link of Regional Standard of Phytosanitary Measures (RSPM) No. 33 in 2009; it was revised in 2015 and 2017.

While the standard has apparently resulted in significant declines in arrivals of ships contaminated by egg masses, the lack of consistent reporting measures make it difficult to compare detection results from year to year. In the various reports, APHIS reports varying types of data – e.g., sometimes percentage of ships, sometimes number of ships, sometimes percentage decline in number of egg masses found on ships For example,  the 2017 report stated that the number of incoming ships with AGM egg masses had been reduced from 48 in 2014 to 0 2017. The 2018 report is confusing. In a single paragraph (p. 5) it states both that more than 98% of inspected vessels entering U.S. ports from Asia were free of AGM; and that the compliance rate hit an all-time high of 92%, a 10% increase over the previous year’s rate.

The annual reports also describe regional and international efforts to reduce the likelihood that AGM egg masses will be transported to North America. The 2016 and 2017 reports described meetings with Canada and Chile – other countries worried about AGM introductions – and with four “source” countries — China, Japan, Russia, and South Korea – to promote better compliance with vessel certification program requirements. Also, APHIS began monitoring for AGM on U.S. military bases in Japan and South Korea.

The reports also note progress in ensuring eradication of AGM outbreaks in various U.S. locations. There had been single AGM moths detected in Oklahoma in 2013 and 2014; in South Carolina in 2014 and 2015; and in Georgia in 2015. (News releases had also reported AGM egg masses on a ship in Baltimore harbor in 2013.) The 2017 report notes that after three years of negative surveys, PPQ confirmed that Oklahoma is free of the pest. The 2018 report said South Carolina and Georgia also had been declared free of AGM. Surveys continue in treated areas of Washington and Oregon, where 14 moths were found in 2015 (2017 report).

2. Pests Detected in Sea Containers

a shipping container being offloaded at Port of Long Beach, California

In 2016, PPQ initiated a collaborative exploration with Canada and the shipping and sea container industries to address pest risks associated with the movement of sea containers. The goal of the initiative is to develop container-cleaning guidelines that can be implemented on a global scale. In 2017, PPQ gave a presentation to the members of the International Plant Protection Convention (IPPC) re: the complexity of this issue. The IPPC formed a Sea Container Task Force, which continues to work.

A specific case (which should not have been a surprise)

In 2017, APHIS was startled to learn from an importer that containers of airplane parts shipped from Italy were infested by snails. APHIS began working with both the importers and the suppliers to minimize the presence of snails. I confess to a sense of irony. Wood packaging from Italy has been a well-recognized pathway for the movement of snails since at least 1985! How could APHIS staff be surprised when snails turn up on containers? I hope APHIS’ effort to persuade Italian machinery manufacturers to clean up their loading docks and storage facilities are more successful than similar efforts in the past targetting marble quarries and tile manufacturers.

3. Pests Detected in Imports of Living Plants and Seeds.

Plant import volumes have averaged about 1.5 billion units (cuttings, whole plants, other propagative materials) per year in 2015 through 2018. (The recent import level is less than half the volume of imported plants before the Great Recession in 2008 – those imports exceeded 3.15 billion plants in 2007 – Liebhold et al. 2012; full citation at end of blog.) Reported imports of seed were sometimes in pounds, sometimes in tons (not clear whether Imperial or metric tons), and once in kilograms. So, if my math is correct, seed imports probably varied from a low of 1.39 million pounds in 2018 to a high of 3.74 million pounds in 2017. The number of shipments in which the plant units were packaged varied from a high of more than 19,000 in 2015 to a low of 17,000 in 2017. Again, I cannot detect a pattern.

The number of quarantine pests detected varied from a low of 690 in 2016 to a high of 1,173 in 2918. That last year also had the highest number of plant units imported – 1.7 billion – 100,000 to 200,000 more than in previous years. Whether these detection numbers accurately reflect the true pest approach rate via this pathway is difficult to know. A study by Liebhold et al. (2012 full citation at end of blog) found that up to 72% of infested shipments were not detected by inspectors.

Progress on Goal 1, Objective 2: Making Better Use of Information

A major thread in past analyses of APHIS programs is the poor use of data to evaluate and improve program efficacy. APHIS is trying to overcome these deficiencies (although note the use of inconsistent numbers in the annual reports).

One important focus is the on-going effort to implement risk-based sampling protocols at the Plant Inspection Stations. APHIS says its goal is to ensure that an inspector operating with 80% efficiency is able to detect any shipment with a 5% infestation level. The level of confidence that such a detection has been accurate should be 95%. Developing the sampling and inspection system has been a challenge; APHIS adjusted one aspect of it in 2018 (according to that year’s annual report). APHIS is also using statistical methods to try to estimate the pest approach rates for specific types of plant material (2017 report).

APHIS is also striving to integrate its data analysis programs with those of DHS Bureau of Customs and Border Protection (CBP). A pilot program testing risk-based sampling at four Texas border ports focuses on imported commodities rather than the accompanying wood packaging. This is unfortunate given the high levels of detection of wood packaging from Mexico that is in violation of applicable international rules in ISPM#15). [See my discussion from February 2017.]

Finally, APHIS is testing use of molecular diagnostics to detect diseases that may not be found through visual inspection – although this is still experimental in 2018 after more than two years of evaluation.

Progress on Goal 2: Optimizing Pest Management and Eradication

Remember that the objectives emphasized coordinating with and “wisely us[ing]” partners’ abilities.

Seizures of illegal imports

Again, the reporting units vary so it is hard to compare between years. In 2015 and 2016, seizures were reported in pounds of prohibited plants, plant products, meat, and meat products that had entered the country illegally. Such seizures fell from more than 290,000 pounds in 2015 to 102,000 pounds in 2016. In 2017 and 2018, seizures were reported as numbers of prohibited items and their retail value. In 2017, APHIS seized 2,347 prohibited agricultural items valued at more than $554,000 from retail stores, internet sales, and express shipment courier inspections. In 2018, seizures rose to 3,222 prohibited items valued at over $2.6 million.

011817.N.DNT.INFESTEDFURNITUREc2 — The burrowing larvae of a velvet longhorned beetle was found in rustic log furniture imported form China. State insect experts are asking people who may have purchased imported log furniture to check for inspect damage and report any findings of insects. Photo courtesy Minnesota Department of Agriculture

APHIS also sometimes recalled items – there were 24 national recalls in 2017, 28 in 2018. In 2016, PPQ’s Furniture Recall Team coordinated a nationwide consumer-level recall of imported pine furniture after customers complained that insects, later identified as brown fir longhorned beetles, were emerging from the furniture. The combined federal-state-retailer effort recovered and destroyed 83% of the purchased furniture pieces and 100 % of the furniture that remained in the warehouse. This effort won APHIS’ internal Safeguarding Award in 2016.

Pest Eradications (I include here only tree pests; the reports note success on European grape vine moth and pink bollworm.)

Annual reports noted gradual progress in eradicating Asian longhorned beetle outbreaks. As of 2016, APHIS reported eradication of 85% of the ALB-infested area in New York, 34% of the area Massachusetts, and 15% of the OH infestation. In 2018, APHIS announced eradication of ALB from two townships in Clermont County, Ohio.

In 2016 APHIS reported that it has begun focusing the emerald ash borer program on biocontrol. The agency reported releasing more than 1.2 million parasitic wasps in 20 states in what the agency called “trial releases” in 2015. By 2017 the agency released wasps in 25 states and the District of Columbia and reported detections of reproducing wasp populations in 14 states. In 2018, APHIS released more than 1 million wasps – again in 25 states; and reported recoveries of offspring in 17 states. In that last year, APHIS issued a formal proposal to end the regulatory program restricting movement of EAB vectors. In earlier blogs I explained my opposition to this proposal. See earlier blogs here and here

This proposal was adopted after APHIS implemented a new “decision framework” (see 2016 report). Presumably APHIS considers this framework to implement Goal 2,” Optimize domestic pest management and eradication programs.”  Given the controversy around the emerald ash borer proposal, however, I am skeptical that it fulfills the two objectives – coordinating with partners and using partners’ “ unique capacities … to strengthen and extend PPQ’s domestic programs.” Instead, to me, this decision reflects the agency’s eagerness to dump difficult programs onto others – in this case, state agencies and conservation organizations. For more on this “dumping” proclivity, see also “FRSMP” below.

In 2018 APHIS also reported expanding its engagement with the spotted lanternfly — which I think should have been much more vigorous earlier [see here]. APHIS said it would focus on the leading edge of the infestation in Pennsylvania, while the Pennsylvania Department of Agriculture took the lead within the core infested area. APHIS also said it would assist State departments of Agriculture in Virginia, New Jersey, and Delaware, where outbreaks have been detected.

Surveys

Pest surveys are one tool for early detection of pests, so they are important to pest eradication and management. Surveys have long been collaborative efforts with the states and others, funded through the CAPS and Farm Bill programs (see below). The number of pests targeted in the surveys have crept up from 346 in 2015 to 386 in 2018. The number of quarantine pests detected varies year-to-year: 16 in 2016; 30 in 2017; 12 in 2018. According to the report, all were detected before they could cause significant damage.

APHIS has been testing use of both dogs and unmanned aircraft (drones) for surveys of tree pests. Dogs have shown promise in detecting AGM egg masses on ships, coconut rhinoceros beetle in mulch piles, and insect frass in wood packaging.

Other Initiatives

APHIS is actively pressing for widespread adoption of electronic phytosanitary certificates, which it expects to both ease processing burdens and reduce opportunities for fraud. Efforts include test exchanges of electronic certificates with a growing number of countries and development of an action plan to be presented to the International Plant Protection Convention decision-making body in 2018.

Another initiative is to develop a holistic, integrated management systems approach to reduce risks associated with international movement of seed (a very complex trade!).

Farm Bill projects

Funding for projects under the Plant Pest and Disease Management and Disaster Program (Section 10007 of the Farm Bill; now Section 7721 of the Plant Protection Act) was not reported in the 2015 or 2016 annual reports. My analysis of the program website found that $62.5 million worth of projects was funded in FY15; 58.25 million was funded in FY17. By 2018, a total of $75 million worth of projects was funded. The number of projects funded has increased as a result – from about 430 in 2015 and 2016 to 483 in 2017 and 519 in 2018.  According to my calculations, the proportion of the funding going to tree pests has averaged a little over 10% in most years. 2016 saw a spike because of spending to suppress the spotted lanternfly in Pennsylvania and to eradicate AGM outbreaks in Washington and Oregon.

Federally Recognized State Managed Phytosanitary (FRSMP) Program

In theory, the FRSMP program supports states’ efforts to prevent pests that are no longer federally regulated from entering the state’s territory. To be covered under the FRSMP Program, a pest must pose an economic or environmental risk to a state, and the state must have a program in place to eradicate, exclude or contain it. In those cases, a State may petition PPQ to list the species under the program. Between 2010 and 2018, APHIS, in collaboration with the National Plant Board, changed the regulatory status of 105 pests. I worry that at least some of these pests should continue to be the target of a federal program. My worry is exacerbated by APHIS’ plan to deregulate the emerald ash borer (described above).

Goal 3: International Coordination to Develop Science-Based Standards

The APHIS annual reports demonstrate APHIS’ active engagement with international standard-setting bodies in pursuit of its goal of pre-empting conflicts with trade partners by getting international agreement to appropriate phytosanitary measures. Since 2016, the International Plant Protection Convention has adopted 36 new international standards. The North American Plant Protection Organization adopted a new standard for using systems approaches to manage pest risks associated with the movement of forest products. APHIS assigns staff to participate on expert panels and committees, comments on draft standards, and help define the organizations’ agendas.

Forest-pest related issues addressed through one or both of these organizations include both an international and regional standard for the movement of wood products, and adoption of two new treatments for wood packaging. APHIS was also a key player in organizing two workshops aimed at improving compliance with the international wood packaging standard (ISPM#15) and another aimed at improving compliance with the ship-sanitation program intended to curtail transport of AGM egg masses. APHIS also coordinates closely with Australia, New Zealand, as well as Canada (called “the Quads”), to advance shared standard-setting priorities at the IPPC and launch key initiatives of mutual interest.

As I said at the beginning of the blog, APHIS issued a new Strategic Plan [available here] in autumn 2018. A table in Appendix A of the report provides support for some of my concerns.

Regarding APHIS’ backing away from regulatory programs and difficult pests, the table shows that 11 deregulatory actions were published in FY2017; the target for FY18 is 10, the target for FY19 is 15. Furthermore, Objective 1.3, states that APHIS will remove obstacles by ending regulations that place burdens on stakeholders but that are not supported by current science or practices. APHIS has also reinstated an internal executive regulatory management group to identify APHIS’ regulatory needs early and track them through approval.

I am even more concerned that the “performance measure” in the table in Appendix A anticipates that the percentage of high-risk pests surveyed for under the CAPS program will fall from 96% in FY17 to just 80% in FY19.

The 2019 Strategic Plan continues an earlier emphasis on science-based decisions, modernizing procedures, improving utilization of data, the need to be flexible and adjust to new situations, to work closely with partners, and to maintain leadership role in international bodies aimed at achieving protection goals while promoting safe trade. The vast majority of examples and specific actions listed in the plan pertain to animal disease issues; some actions could be interpreted as applying to both animal and plant sanitary issues. The table in Appendix A anticipates that ten new regional or international standards will be adopted in both FY2018 and FY2019.

The few plant-specific actions in the plan include the following matters that continue from previous years – but without any recognition of problems revealed in the annual reports:

• Imported plant cuttings that are produced in approved offshore facilities will be processed through a streamlined system. No mention is made that the 2017 pilot program failed to demonstrate the expected reduction of pest risk.

• By FY2019 (the current year), 60% of incoming shipments of plants will be inspected under the Risk Based Sampling (RBS) system. No mention is made of the still “in development” aspect of this system, as revealed in the 2018 and other annual reports.

• Development will continue of a new regulatory approach for seed imports based on Regulatory Framework for Seed Health (ReFreSH) (a systems approach which has been under development for several years).

• Addressing the threat of invasive pests and diseases associated with the international movement of sea containers (an international initiative begun a few years ago).

• Strengthening the North American perimeter against pest threats from outside the region.

• Preventing the sale of prohibited plant material via the internet or e-commerce.

SOURCE

Liebhold, A.M., E.G. Brockerhoff, L.J. Garrett, J.L. Parke, and K.O. Britton.  2012.  Live plant imports:  the major pathway for forest insect and pathogen invasions of the US.  Frontiers in Ecology and the Environment, 10(3): 135-143.  Online at: http://www.ncrs.fs.fed.us/pubs/jrnl/2012/nrs_2012_liebhold_001.pdf.  Accessed December 7, 2012.

Posted by Faith Campbell

We welcome comments that supplement or correct factual information, suggest new approaches, or promote thoughtful consideration. We post comments that disagree with us — but not those we judge to be not civil or inflammatory.

Timely reminder: Don’t Move Invasive Species!

USDA’s Animal and Plant Health Inspection Service (APHIS) has teamed up with the North American Invasive Species Management Association and The Nature Conservancy to sponsor the first-ever national PlayCleanGo Awareness Week beginning Saturday – June 1-8. The program’s goal is to help outdoor enthusiasts understand how they can help stop the spread of invasive plants and pests—while still enjoying the great outdoors.

APHIS’ announcement suggests some helpful steps people going outdoors can take:   

  • Before moving from one location to another, clean your shoes with a brush to remove any soil, plants or seeds that might be trapped in your treads. This action will help prevent your accidentally spreading damaging microscopic organisms or invasive weeds to new areas.  
tanoaks killed by Phytophtora ramorum (sudden oak death) Big Sur, California
  • Avoid giving hitchhiking pests a free ride in your firewood by purchasing your firewood where you plan to burn it or taking only heat-treated firewood with you. Careless movement of wood can spread tree-killing beetles and other pests that can harm our forests. 
tangle of dead ash in Michigan killed by emerald ash borer
photo by Ned Siegert, USDA Forest Service
  • If you are driving, remove any visible pests, plants, soil, or egg masses from your vehicle, RV or camper. It only takes a few minutes to stop tree-killing insects and other potentially harmful plant pests from traveling with you to your next destination.  
spotted lanternfly
photo by Holly Raguza, Pennsylvania Department of Agriculture

  The website hprovides educational materials as well as such tools for interaction as pledges and hashtags!

Help spread the word while doing your part.

Posted by Faith Campbell

We welcome comments that supplement or correct factual information, suggest new approaches, or promote thoughtful consideration. We post comments that disagree with us — but not those we judge to be not civil or inflammatory.

Collapse of Biodiversity – Causes and What We Can Do

frogs in California killed by chytrid fungus
photo by Rick Kyper, US Fish and Wildlife Service

I expect you have heard about the report issued on May 6 by the Intergovernmental Science-Policy Platform on Biodiversity and Ecosystem Services. The executive summary is available here

Based on thousands of scientific studies, the report concludes that the biosphere, upon which humanity as a whole depends, is being altered to an unparalleled degree across all spatial scales. The trends of decline are accelerating. As many as 1 million species (75% of which are insects) are threatened with extinction, many within decades.

Humans dominate Earth: natural ecosystems have declined by 47% on average. Especially hard-hit are inland waters and freshwater ecosystems: only 13% of the wetland present in 1700 remained by 2000. Losses have continued rapidly since then.

The report lists the most important direct drivers of biodiversity decline – in descending order – as habitat loss due to changes in land and sea use; direct exploitation of organisms; climate change; pollution; and invasive species. The relative importance of each driver varies across regions.

If you have been paying attention, these conclusions are not “news”.

However, the report serves two valuable purposes. First, it provides a global overview, a compilation of all the data and trends. Second, the report ties the direct drivers to underlying causes which are in turn underpinned by societal values and behaviors. Specifically mentioned are production and consumption patterns, human population dynamics and trends, trade, technological innovations, and governance (decision making at all levels, from local to global).

The report goes to great lengths to demonstrate that biological diversity and associated ecosystem services are vital for human existence and good quality of life – especially for supporting humanity’s ability to choose alternative approaches in the face of an uncertain future. The report concludes that while more food, energy and materials than ever before are now being supplied to people, future supplies are undermined by the impact of this production and consumption on Nature’s ability to provide.   

The report also emphasizes that both the benefits and burdens associated with the use of biodiversity and ecosystem services are distributed and experienced inequitably among social groups, countries and regions. Furthermore, benefits provided to some people often come at the expense of other people, particularly the most vulnerable.  However, there are also synergies – e.g., sustainable agricultural practices enhance soil quality, thereby improving productivity and other ecosystem functions and services such as carbon sequestration and water quality regulation.

The report contains vast amounts of data on the recent explosion of human numbers and – especially – consumption – of agricultural production, fish harvests, forest products, bioenergy production … and on the associated declines in “regulating” and “non-material contributions” ecosystem services. In consequence, the report concludes, these recent gains in material contributions are often not sustainable.

While invasive species rank fifth as a causal agent of biodiversity decline globally, alien species have increased by 40% since 1980, associated with increased trade and human population dynamics and trends. The authors report that nearly 20% of Earth’s surface is at risk of bioinvasion. The rate of invasive species introduction seems higher than ever and shows no signs of slowing.

The report notes that the extinction threat is especially severe in areas of high endemism. Invasive species play a more important role as an extinction agent in many such areas, especially islands. However, some bioinvaders also have devastating effects on mainlands; the report cites the threat of the pathogen Batrachochytrium dendrobatidis to nearly 400 amphibian species worldwide.

The report also mentions that the combination of species extinctions and transport of species to new ecosystems is resulting in biological communities – both managed and unmanaged — becoming more similar to each other — biotic homogenization.

The report notes that human-induced changes are creating conditions for fast biological evolution of species in all taxonomic groups. The authors recommend adopting conservation strategies designed to influence evolutionary trajectories so as to protect vulnerable species and reduce the impact of unwanted species (e.g., weeds, pests or pathogens).

The report says conservation efforts have yielded positive outcomes – but they have not been sufficient to stem the direct and indirect drivers of environmental deterioration. Since 1970, nations have adopted six treaties aimed at protection of nature and the environmental, but few of the strategic objectives and goals adopted by the treaties’ parties are being realized. One objective that is on track to partial achievement is the Aichi Biological Diversity Target that calls for identification and prioritization of invasive species. 

That might well be true – but I would not consider global efforts to manage invasive species to be a success story in any way. I have blogged often about studies showing that introductions continue unabated … and management of established bioinvaders only rarely results in measurable improvements.   [For example, see here and here.]

The report gives considerable attention to problems caused by some people’s simultaneous lack of access to material goods and bearing heavier burden from pollution and other negative results of biodiversity collapse. Extraction of living biomass (e.g. crops, fisheries) to meet the global demand is highest in developing countries whereas material consumption per capita is highest in developed countries. The report says that conservation of biodiversity must be closely linked to sustainable approaches to more equal economic development. The authors say both conservation and economic goals can be achieved – but this will require transformative changes across economic, social, political and technological factors.

One key transformation is changing people’s conception of a good life to downplay consumption and waste. Other attitudinal changes include emphasizing social norms promoting sustainability and personal responsibility for the environmental impacts of one’s consumption. Economic measures and goals need to address inequalities and integrate impacts currently considered to be “economic externalities”. The report also calls for inclusive forms of decision-making and promoting education about the importance of biodiversity and ecosystem services.

Economic instruments that promote damaging, unsustainable exploitation of biological resources (or their damage by pollution) include subsidies, financial transfers, subsidized credit, tax abatements, and commodity and industrial goods prices that hide environmental and social costs. These need to be changed.

Finally, limiting global warming to well below 2oC would have multiple co-benefits for protecting biodiversity and ecosystem services. Care must be exercised to ensure that large-scale land-based climate mitigation measures, e.g., allocating conservation lands to bioenergy crops, planting of monocultures, hydroelectric dams) do not themselves cause serious damage to biodiversity or other ecosystem services.

The threats to biodiversity and ecosystem services are most urgent in South America, Africa and parts of Asia. North America and Europe are expected to have low conversion to crops and continued reforestation.

Table SPM.1 lays out a long set of approaches to achieve sustainability and possible actions and pathways for achieving them. The list is not exhaustive, but rather illustrative, using examples from the report.

Posted by Faith Campbell

We welcome comments that supplement or correct factual information, suggest new approaches, or promote thoughtful consideration. We post comments that disagree with us — but not those we judge to be not civil or inflammatory.

Recent Developments on Sudden Oak Death (Phytophthora ramorum)

tanoak killed by SOD; photo by F.T. Campbell

In recent months there have been several developments affecting efforts to manage the sudden oak death infestation in West Coast states and to prevent its spread to other parts of the country.

1) APHIS regulations

Most notably, APHIS has formalized revisions to its regulations governing nursery stock. This revision was proposed last June (see my blog about this here). The revisions largely implement changes to practices that APHIS had adopted in 4014 and 1015 through Federal Orders. The final regulation is posted here. The new regulation goes into effect on May 20th.

APHIS received only 10 comments (posted here) on the proposal – from researchers, State agriculture and conservation agencies, environmental advocacy groups, research foundations, and private citizens. I summarized points raised in their comments by CISP and others in an earlier blog.

APHIS responded to most of these comments by reiterating that it has been operating under the current program since 2014 and believes the existing testing protocols and conditions are sufficient to mitigate the risk. The measures to monitor nurseries for infections include testing soil and water, that is, they do not rely exclusively on visual inspection of the plants. This is a step forward. In response to comments by CISP and California Oak Mortality Task Force that all nurseries that grow host plants are a potential source of contamination, APHIS points out that it is not authorized to regulate nurseries that don’t ship plants interstate. This limitation is a serious problem arising from the underlying statute – the Plant Protection Act. APHIS said it would continue to monitor detection of the pathogen, and would reevaluate program protocols “should the need arise” – but it made no promise on how frequently it would  reevaluate the program.

APHIS did make some adjustments, based on comments. It agreed to one state’s request that it clarify the minimum number of samples that must be taken during annual inspection of nurseries that had not previously tested positive for the pathogen when those nurseries are located in counties that have SOD infestations in the environment. (Such counties are found only in California and Oregon.)

The agency also said it plans to restructure the list of host species so that it can be updated more quickly. APHIS plans to remove the lists from formal regulations (which require public notice and comment to amend) and post them on the APHIS website. APHIS also expects to merge the lists of proven and associated hosts into a single host list. However, these plans would, themselves, constitute rulemaking and require another public comment period.

APHIS also agreed to reinstate its quarterly program updates, beginning in April of 2019. I have not yet seen an alert telling me how to find the first such update, though.

2) P. ramorum in California and Washington

According to the most recent (April 2019) newsletter of the California Oak Mortality Task Force, tanoak (Notholithocarpus densiflorus) mortality in California attributed to Phytophthora ramorum increased by more than 1.6 million trees across 106,000 acres in 2018. The dead trees are concentrated west of the coastal range.

In the meantime, P. ramorum continues to be detected in nurseries shipping plants from West Coast nurseries. As of April, the California Department of Food and Agriculture had detected P. ramorum in nine nurseries – six from previous years, three new in 2019. (Sixty-four additional infected plants were found in one nursery that had been confirmed positive in an earlier year – raising questions in my mind about the efficacy of the Confirmed Nursery Protocol for eliminating the pathogen.)

As I noted in a previous blog, Washington is finding it difficult to eliminate P. ramorum from the soil of a botanical garden in Kitsap County. For the third time in less than a year, a pond that is downhill from previously “mitigated” sites has tested positive for P. ramorum.

I remind you that scientists do not believe that P. ramorum persists in water – it must be surviving on some plant tissue in both Washington and the Eastern states (see below).

3) P. ramorum in Oregon

The Oregon Department of Forestry (ODF) commissioned a study of the economic impact of Phytophthora ramorum in the state. The study found that to date, sudden oak death has caused minor impacts on the regional economy. There was  no impact on timber harvest, export or log prices or recreation or tourism revenues and only anecdotal reports of losses to real estate transaction values in some areas. Meantime, the state and several federal agencies are spending $1.5 million per year to try to contain the outbreak.

However, sudden oak death has the potential to cause harm to core values that elude economic quantification, particularly to tribal cultural values and the “existence value” of tanoak-dominated forests. SOD may be an existential threat to tanoak and associated obligate species (e.g., dusky-footed woodrats, Northern flying squirrels, and Allen’s chipmunks – which are important prey items for northern spotted owl, cougar, coyote, and Pacific fisher. More widespread wildlife — e.g., deer, elk, bear, Coho salmon, and a variety of bird species – might also be harmed.)

Immediate termination of the ODF treatment regime might lead to serious impacts due to more rapid expansion of sudden oak death into Coos County, Oregon. These could include Asian governments restricting timber and fiber exports from southwest Oregon and resulting loss of 1,200 jobs and forest products harvest tax. There might also be a collapse of residential property value and real estate transaction revenues. Finally, there might be a decline in recreation and tourism in affected areas. Maintaining the current treatment regime was expected to delay the spread of SOD north of the Rogue River until 2028, and prevent infestation of Coos County beyond 2038. Continued funding SOD treatments for a total cost of $30 million over the next 20 years could offset loss of 1,200 jobs by 2028 and $580 million in wages from 2028 to 2038.

The study authors note that other factors – such as major wildfires or trade wars – could render these impacts moot.

4) P. ramorum in the East

According to the most recent newsletter of the California Oak Mortality Task Force, over the nine years since 2010, the pathogen has been detected from 11 streams in six eastern states – four in Alabama; one in Florida; two in Georgia; one in Mississippi; one in North Carolina; and two in Texas. P. ramorum has been found multiple times in eight of these streams; it is consistently present in two steams in Alabama, one each in Mississippi and North Carolina.

In 2018, seven states participated in the stream survey (which is operated by the USDA Forest Service):  (AL, GA, MS, NC, PA, SC, and TX). This was the smallest number of participating states, which has fallen from14 in 2010 to seven in 2018.

The number of streams surveyed annually has ranged from 45 to 95. The number of streams sampled in 2018 was also close to the smallest number: 47. P. ramorum was detected from six streams – four in Alabama, one each in Mississippi and North Carolina. All positive streams were associated with previously P. ramorum-positive nurseries.

Remember that P. ramorum continues to be detected in West Coast nurseries that ship plants interstate (see the second section of this blog).

Posted by Faith Campbell

We welcome comments that supplement or correct factual information, suggest new approaches, or promote thoughtful consideration. We post comments that disagree with us — but not those we judge to be not civil or inflammatory.

What FIA data tell us about non-native pests of America’s forests

dead redbay in Claxton, GA 2009; photo by Scott Cameron

Several groups of scientists are using two large datasets to analyze impacts of invasion by non-native tree-killing pests. The first dataset used is official Forest Service monitoring data from the Forest Inventory and Analysis (FIA). These data are collected on a “rolling” annual basis from 130,210 forest plots in 2,098 counties in the 48 conterminous states. (Go here to learn more about FIA.)  

The second dataset covers the distribution of non-native forest pests and is contained in the Alien Forest Pest Explorer database, also a Forest Service product.

Some of these studies (those led by Kevin Potter) have been carried out under the auspices of “Project CAPTURE” (Conservation Assessment and Prioritization of Forest Trees Under Risk of Extirpation) as part of a multi-partner effort to categorize and prioritize US tree species for conservation actions based on the threats and the trees’ ability to adapt to those threats. Partners include North Carolina State University; Forest Service Forest Health Protection, Southern Research Station, and forest health monitoring program; Eastern Forest Environmental Threat Assessment Center; and the Forest.Health program.

Here I highlight several key studies that use FIA data to examine:

1) the relationship between the diversity of forest tree species  and the number of non-native insects and pathogens established there;  

2)  the mortality rate of  forest trees due to non-native pests; and

3) impacts i in the form of  “geographic hot spots;”

4) application of these findings to setting conservation priorities.

1. Impact of Host Diversity on Pest Establishment

One group of scientists (Guo et al.; reference at the end of this blog) extracted distribution data for 66 non-native pests (51 insects, 15 pathogens) taken from the Alien Forest Pest Explorer database. Then, the authors compared these pest’ distributions to FIA data on the diversity of tree species in the same invaded forests — for both “host” and non-host tree species. (Guo et al. classified a tree species as a “host” only if the relevant pest was present in the county.)

Guo et al. found that the number of alien pest species established in a county increased commensurate with tree diversity – as long as that tree diversity was fairly low, i.e., below 39 tree species. The number of established pests increased particularly strongly for specialist pests. However, at higher levels of tree diversity the number of established pests fell. Another factor was the diversity of non-host tree species present. When considering generalist pests, fewer pests became established when non-host tree diversity exceeded 15 species. When considering specialist pests, that cutoff was 25 species.

Among other possible factors explaining numbers of pests established, Guo et al. also found that only propagule pressure – measured by the proxy of human population density – had a significant positive correlation with increased pest numbers.

2. Measuring the Impacts of Non-Native Pests – Tree Mortality Data

A different approach has been undertaken by Randall Morin, working with a variety of coauthors. Dr. Morin has used FIA survey data to detect whether the impact of various non-native pests can be seen in heightened levels of mortality of the pests’ hosts. I reported these findings in a previous blog

eastern hemlock killed by hemlock woolly adelgid in Nova Scotia
photo by Celia Boone, Nova Scotia Department of Lands and Forestry

As I noted in the earlier blog, Dr. Morin found that non-native forest pests had caused an approximately 5% increase in total mortality by tree volume nation-wide. The degree to which mortality levels rose in any county depended on the killing power of the individual pest species and the relative density of tree species vulnerable to the pests present. The number or diversity of non-native tree-killing pests established in the county (see the Guo et al. study) did not determine the county’s morality level. See maps in the earlier blog.

The greatest increase in mortality rates (a four-fold increase) was for redbay, under attack by laurel wilt disease. Three-fold increases in annual mortality rates were detected for ash, beech, and hemlock. To learn the specific mortality rates for individual pest-host relationships, visit here and read the descriptions of butternut, chestnut, redbay, beech, hemlock, ash, tanoak (sudden oak death), Port-Orford cedar, oak wilt, and European gypsy moth

tanoak killed by sudden oak death (Phytophthora ramorum), Big Sur, California

3.Overview of Impacts, Identification of Geographic “Hotspots” and Use in Setting Conservation Priorities

To carry out “Project CAPTURE,” Potter, Escanferla, Jetton, and Man 2019a (full reference at the end of this blog) sought to identify regions at greatest risk of significant ecological and economic impacts from damaging insects, pathogens, or parasitic plants, especially non-native, introduced pests.

They first compiled a list of 339 serious pests threatening one or more of 419 native tree species in the continental United States. The list comprised 168 diseases, 151 insects, and 20 parasitic higher plants. It included both native and introduced pests – 142 native, 55 non-native, and 142 of unknown or disputed origin.

They analyzed up to five of the most serious pests for each native tree species. This analysis resulted in 1,378 pest-host combinations.

The authors assigned a severity rating for each pest-host combination. Instead of using counties, as Guo et al. did, they evaluated pests and hosts in hexagons covering approximately 800km2. They used FIA data to determine in which hexagons each pest-host combination is present. Finally, the authors determined the “importance value at risk” (IVAR) for each hexagon based on the number of pest-host combinations present and the relative severity of those combinations.  [See the article – referenced below – for detailed explanations of these calculations.]

General Findings

Analyses addressing all the pests, including native ones, found different results than analyses focused on the non-native pests. Thus, analyses of all pests found greater impacts in the West, whereas non-native pests caused potentially greater impacts in the East. The authors note that the non-native pest risk could be greatly magnified across much of the eastern United States if the alien pests are able to spread to the entirety of their hosts’ ranges.

Considering the pests:

  • Of the 1,378 host/agent combinations, 51.5% involve diseases, 43.6% involve insects, and 4.9% involve parasitic plants.
  • Among the insects, 77 are phloem or wood-borers, 51 are foliage-feeders, and 23 are sap-feeders. Of the total of 601 insect-host combinations (both native and exotic), borers are the agents in 224 (37%) of the combinations.
  • 54% of the host tree species (228) are infested by an exotic pest – although only 28% of the 1,378 host/agent combinations involved known exotic pests.

Considering the host tree species:

  • two non-native pests affect the largest number of hosts: European gypsy moth – 65 hosts; and oak wilt (Bretziella fagacearum) – 61 hosts. A third alien species, Asian longhorned beetle, ranked fourth overall with 43 hosts.
  • Nearly 70% of the host/agent combinations involve angiosperm species, 30% gymnosperms. Regarding all combinations, the severity of the gymnosperm/agent combinations was significantly higher than angiosperm/agent combinations. However, when considering only non-native pests, the opposite was true: host/agent combinations for angiosperms had greater average severity.

Severity of Impacts

  • Disease impacts are more severe, on average, than insect pests.
  • Wood-borers are more damaging than other types of insect pests.
  • Exotic agents have, on average, considerably more severe impacts than native pests.
  • The risk estimate – especially for the East – is an underestimate because established pests could spread to additional vulnerable areas and there is a high likelihood that new pests will be introduced.

Of the 15 host-agent combinations with the highest severity, seven are caused by an insect, seven by a disease, one by an insect-disease complex. These 15 tree species at highest risk are:

  • Florida torreya (Torreya taxifolia) – pathogen,
  • American chestnut (Castanea dentata) – pathogen,
  • Allegheny chinquapin (C. pumila) – pathogen,
  • Ozark chinquapin (C. pumila var. ozarkensis) – pathogen,
  • redbay (Persea borbonia) – disease complex, 
  • Carolina ash (Fraxinus caroliniana) – insect,
  • pumpkin ash (F. profunda) – insect,
  • Carolina hemlock (Tsuga caroliniana) – insect,
  • Port-Orford cedar (Chamaecyparis lawsoniana) – pathogen,
  • tanoak (Notholithocarpus densiflorus) – pathogen,
  • butternut (Juglans cinerea) – pathogen,
  • eastern hemlock (Tsuga canadensis) – insect,
  • white ash (Fraxinus americana) – insect,
  • black ash (F. nigra) – insect, and
  • green ash (F. pennsylvanica) – insect.
emerald ash borer – cause of threat to five of the “top 15”

Four host families are at the highest risk to alien pests, as measured by both the numbers of tree species affected and by the most host/agent combinations – Fagaceae (oaks, tanoaks, chestnuts, beech); Pinaceae (pines); Sapindaceae (soapberry family; includes maples, Aesculus (buckeye, horsechestnut); Salicaceae (willows, poplars, aspens). The authors point out that these families comprise the most tree species in North America and that the species are widespread.

The families under greatest threat varied somewhat when measured by the severity of the host/pest threat. While Fagaceae was still at greatest risk, and Sapindaceae was still in the top four, Ulmaceae (elms) and Oleaceae (includes Fraxinus) replaced pines and willows.

Analyses addressing all the pests found geographic “hotspots” only in the West. Analyses addressing non-native pests, based on their current extent, also resulted in Western areas appearing at highest risk. However, analyses addressing non-native pests but assuming that these pests had spread to the full extent of their hosts revealed “hotspots” in the Northeast and Great Lakes States.  The Southeast is consistently a “coldspot” – clearly the near extirpation of one understory tree – redbay – is not sufficient to affect top-level data.

Note that none of the maps in the article shows all exotic pests separately from native pests; even the map in Figure 4b illustrates non-native insects only. Dr. Potter has told me that it proved too difficult to determine the origin of many pathogens (K. Potter pers. comm. April 2019).

Setting Conservation Priorities

In a second publication, Potter Escanferla, Jetton, Man, and Crane (2019b) applied the severity ranking for host-pest relationships to set priorities for conservation actions targetting the host – especially conservation of genetic diversity and implementation of programs aimed at enhancing hosts’ resistance to the pest through breeding.

They created 11 classes of species based on three factors:

  • each tree species’ exposure to an extrinsic threat – as measured by the extent to which a threat could diminish a species’ adaptive genetic variation;
  • each tree species’ sensitivity to the threat – as indicated by the species’ rarity, and size of range, or the degree to which a species’ total genetic resource base is susceptible to a threat; and
  • each species’ ability to adapt to the pest threat – as determined by extent to which a species is unable to adapt, through micro-evolutionary change and phenotypic plasticity; unable to maintain evolutionary resilience

(These definitions are taken from Potter, Crane, and Hargrove 2017; reference below)

The highest ranked species (in three classes) are the 15 listed above.

How to Use These Data / Findings

The purpose of the CAPTURE project is to guide USDA Forest Service prioritization of forest tree species and populations for genetic conservation and monitoring efforts. It began as a response to a request from the National Forest System regional geneticist in the Southern Region (Region 8); it was then expanded to the entire country – including Puerto Rico, the Virgin Islands, and Hawai`i. (Dr. Potter told me that he has most of the data needed for Hawai`i, but is still collecting data for the Caribbean. He still needs to query experts in order to customize the framework for the two regions.) 

Now that the project has set priorities for continental species, it will be interesting to see the extent to which these findings guide actual allocation of resources. For example, will additional resources be assigned to protecting such non-commercial species as Florida torreya and redbay? Will existing resistance breeding efforts – which mostly struggle to obtain funding – now have better access to funds?

The Forest.Health project – which promotes use of biotechnology to breed resistant hosts – has adopted the priority list.

Potter et al. 2019b call also for incorporating their findings into regular national reports such as those issued per the Resources Planning Act Assessment and the National Report on Sustainable Forests. These data are essential to assessing the degree to which U.S. forests can continue to meet demand for a broad range of goods and services, safeguard biological diversity, and contribute to the resilience of ecosystems and economies.  

I hope that the data on regeneration, growth, and succession of individual species compiled by Morin, et al., — which are not part of the CAPTURE project — would also be included in such reports.

I applaud these studies and hope they will prove influential. They avoid some of the flaws in other priority-setting processes, which tend to focus on species with commercial value. However, I would like to suggest that some other factors should also be included in calculating priorities:

  • Are some host species especially significant in their ecosystems? That is:
    • Do some create unique biomes, e.g., hemlocks in stream valleys in the middle and southern Appalachians; Fraser fir (and red spruce) on southern Appalachian mountain tops; black ash in wooded swamps from Minnesota to New Brunswick; Port-Orford cedar as part of the unique flora of the serpentine soils of the Siskiyou Mountains; whitebark pine at high elevations of Western mountains.
    • Are some hosts important providers of rare resources, e.g., hard mast – tanoak in California coniferous forests, beech in northern part of its range, whitebark pine at high elevations. Or calcium to the leaf litter and soil – e.g., dogwoods.
    • Are particularly high numbers of faunal species associated with the host? Or rare fauna?
  • Should pests that threaten entire genera – or monotypic genera – receive a higher priority? E.g., emerald ash borer threatening Fraxinus; Phytophthora ramorum threatening tanoak?

SOURCES

Guo, Q., S. Feib, K.M. Potter, A.M. Liebhold, and J. Wenf. 2019. Tree diversity regulates forest pest invasion. PNAS.  www.pnas.org/cgi/doi/10.1073/pnas.1821039116

Morin, R.S., K.W. Gottschalk, M.E. Ostry, A.M. Liebhold. 2018. Regional patterns of declining butternut (Juglans cinerea L.) suggest site characteristics for restoration. Ecology and Evolution.2018;8:546-559

Morin, R. A. Liebhold, S. Pugh, and S. Fie. 2019. Current Status of Hosts and Future Risk of EAB Across the Range of Ash: Online Tools for Broad-Scale Impact Assessment. Presentation at the 81st Northeastern Forest Pest Council, West Chester, PA, March 14, 2019

Potter, K.M., B.S. Crane, W.W. Hargrove. 2017. A US national prioritization framework for tree species vulnerability to climate change. New Forests (2017) 48:275–300 DOI 10.1007/s11056-017-9569-5

Potter, K.M., M.E. Escanferla, R.M. Jetton, and G. Man. 2019a. Important Insect and Disease Threats to United States Tree Species and Geographic Patterns of Their Potential Impacts. Forests. 2019 10 304.

Potter, K.M., M.E. Escanferla, R.M. Jetton, G. Man, and B.S. Crane. 2019b. Prioritizing the conservation needs of United States tree species: Evaluating vulnerability to forest insect and disease threats. Global Ecology and Conservation. (2019)

Promising Biocontrol to Protect Some Cacti

Photo of infested cactus at Cabo Rojo National Wildlife Refuge, Puerto Rico. Taken August 20, 2018 by Yorelyz Rodríguez-Reyes

Three and a half years ago, I blogged about the threat to columnar cacti in Puerto Rico from the Harrisia cactus mealybug. The mealybug clearly threatens the endemic cacti of the Caribbean islands, and possibly some of the hundreds of other columnar cacti growing across two million square miles of desert ecosystems that straddle the U.S.-Mexico border region.

I am pleased to report that scientists continue efforts to find biocontrol agents to reduce this insect’s damage on Caribbean islands. Much of this work is being done by the Center for Excellence in Quarantine and Invasive Species at University of Puerto Rico. The team consists of Michael West Ortiz, Yorelys Rodrígues Reyes, Ferdinand Correa and Jose Carlos Verle Rodrigues.

As of February 2019, the Center is conducting host specificity tests on a primary parasitoid of the Harrisia Cactus mealybug — Anagyrus cachamai. This wasp was found as a result of almost a decade of searching in South America and other locations. It is native to Argentina and Paraguay (Triapitsyn et al. 2018; sources listed at the end of the blog).The Center also continues surveys and studies of other primary and secondary parasitoids of the mealybug.

The work to develop a biocontrol agent for the mealybug continues despite continuing uncertainty about the true species of the mealybug. At the time of its discovery on Puerto Rico, the mealybug was believed to belong to a species used as a biocontrol agent for invasive cacti in Australia and South Africa, designated as Hypogeococcus pungens. However, H. pungens is now thought to be a species complex, and the species in Puerto Rico differs from the earlier designation (Triapitsyn et al. 2018). 

Apparently the mealybug was introduced in Puerto Rico around 2000   — probably on the ornamental common purslane (Portulaca olerácea), an annual succulent. (Note: the introduction was on a host different from the vulnerable cacti.) Within five years of the first detection in San Juan, the mealybug was sighted on cacti on the other side of the island in the Guánica State Forest and Biosphere Reserve. By 2010, the mealybug was widely distributed in most dry districts. Surveys found it in all 11 municipalities surveyed in southern Puerto Rico. At some locations, infestation levels were extremely high – e.g., 86% of stems surveyed were infested at Guánica. Infestation rates were lower in other municipalities. As of 2010, infestations were estimated to be present on about 1,400 km2 on the southern coast; the rate of new infestations suggests that the mealybug was spreading rapidly (Segarra-Carmona et al. 2010).  I have been unable to obtain more recent estimates.

The mealybug impacts seven of 14 native cactus species occurring in dry forests of the island, including three endemic and two endangered species in the subfamily Cactoideae. The two endangered species are Harrisia portoricensis and Leptocereus grantianus (USDA ARS). The tissue damage caused by the mealybug interferes with sexual reproduction and can cause direct mortality of the plant (Triapitsyn et al. 2018).  These cacti provide food or shelter for endemic bats, birds, moths and other pollinators (Segarra & Ramirez; USDA ARS). The mealybug is also now killing native cacti on the U.S. Virgin Islands (H. Diaz-Soltero pers. comm. August 2015).

 USDA Funds Conservation Efforts Despite Apparent Absence of a Constituency Calling for Such Action

Efforts to identify and test possible biocontrol agents targetting the Harrisia cactus mealybug received significant funds from the Plant Pest and Disease Management and Disaster Prevention Program. This is a competitive grant program managed by APHIS. It is permanently funded and thus not subject to the vagaries of annual appropriations. Until last year, this program operated under Section 10007 of the 2014 Farm Bill. With passage of a new Farm Bill, it is now designated as Section 7721 of the Plant Protection Act.

Since Fiscal Year 2018, APHIS has had authority to spend more than $60 million per year on this program.  In Fiscal Year 2017, , the program provided $120,000 to an unspecified federal agency, $70,000 to an academic institution in Puerto Rico (presumably the Center), $15,000 to another academic institution in California, and $3,000 divided among two APHIS facilities – for a total of $208,000. The next round of funds came in FY19, when the program provided $277,267 to an unspecified federal agency to continue work on biocontrol. In addition, the program provided $78,507 to an unspecified federal agency to “safeguard[e] genetic diversity of native and listed cacti threatened by Harrisia cactus mealybug in Puerto Rico”.

No Apparent Action on Threats to Opuntia Cacti

In my earlier blog, I also described the threat to flat-padded Opuntia (prickly pear) cacti from the cactus moth Cactoblastis cactorum. Various federal, state, and academic entities received $463,000 from the permanent fund in Fiscal Year 2016 and another $100,000 in FY2017. No cactus moth programs have received funds in more recent years.

SOURCES

Segarra-Carmona, A.E., A. Ramirez-Lluch. No date. Hypogeococcus pungens (Hemiptera: Pseudococcidae): A new threat to biodiversity in fragile dry tropical forests.

Segarra-Carmona, A.E., A. Ramírez-Lluch, I. Cabrera-Asencio and A.N. Jiménez-López. 2010.  FIRST REPORT OF A NEW INVASIVE MEALYBUG, THE HARRISIA CACTUS MEALYBUG HYPOGEOCOCCUS PUNGENS (HEMIPTERA: PSEUDOCOCCIDAE). J. Agrie. Univ. RR. 94(1-2):183-187 (2010)

Triapitsyn, Aguirre, Logarzo, Hight, Ciomperlik, Rugman-Jones, Rodriguez. 2018. Complex of primary and secondary parasitoids (Hymenoptera: Encyrtidae and Signiphoridae) of Hypogeococcus spp. mealybugs (Hemiptera: Pseudococcidae) in the New World. Florida Entomologist Volume 101, No. 3 411

USDA Agriculture Research Service, Research Project: Biological Control of the Harrisia Cactus Mealybug, Hypogeococcus pungens (Hemiptera:pseudococcidae) in Puerto Rico Project Number: 0211-22000-006-10 Project Type: Reimbursable

West Ortiz, M. pers. comm. February 2019

Posted by Faith Campbell

We welcome comments that supplement or correct factual information, suggest new approaches, or promote thoughtful consideration. We post comments that disagree with us — but not those we judge to be not civil or inflammatory.

Recent Developments on Stopping Emerald Ash Borer

post-EAB ash forest in southern Michigan; photo by Nate Siebert, USFS

1) The Risks of Reliance on Biological Control

An article published lately indicates yet another complication that might undercut reliance on biocontrol to counter mortality of eastern ash populations caused by the emerald ash borer (EAB) (See my blogs from November — here and here)  regarding APHIS’ proposal to eliminate EAB quarantines in favor of relying chiefly on biocontrol – with little data to back up the change.)

Olson and Rieske (full citation at the end of this blog) found that one of the principal biocontrol agents now in use, and on which APHIS proposes to rely, Tetrastichus planipennisi, does not parasitize EAB larvae living in white fringetree, Chionanthus virginicus. While this tree is a suboptimal host for EAB – lower numbers of the beetle survive – the white fringetree would support survival of some EAB – thereby undermining efficacy of the biocontrol program.

Since white fringetree grows a cross much of the eastern range of ash trees — from New York to Texas, as shown by the map posted here, the presence of this reservoir that can be exploited by EAB will challenge the efficacy of biocontrol.

Olson and Rieske believe the reason that T. planipennisi does not attack EAB living in white fringetree is that the fringetree’s wood is so dense that the wasp cannot detect the presence of EAB in the tree (T. planipennisi apparently relies on tactile and vibratory clues to find its prey).

2) A Possible New Biopesticide to Suppress EAB?

A presentation at the 81st Northeastern Forest Pest Council by Mark Ardis of C.D.G. Environment described tests in the United States and Canada of methods for killing EAB by contaminating the beetles with the fungus Beauveria bassiana. The company is testing traps in which male beetles enter, become covered by fungal spores, then they fly out. The males not only become ill themselves, they also contaminate females during mating. Average overall beetle mortality from several test sites is 25%.

Given the terrible impact of the EAB invasions, I find it exciting to contemplate development of additional tools to be used in suppressing the beetles. However, I worry about possible impacts on non-target insects which might also be exposed to the fungal spores. A decade ago, David Wagner identified 21 species of insects that were specialists on Fraxinus, and said he expected additional species would also be associated with ash trees (full citation at end of blog). Mr. Ardis assured me that they had detected no insects other than EAB in the traps. I wish to see additional research on this issue.

The  US Environmental Protection Agency would have to approve use of this biopesticide. I suggest that we all keep an eye on this process.

3) Citizen Scientists Searching for EAB- resistant “Lingering Ash”

Jonathan Rosenthal and Radka Wildova of the Ecosystem Research Institute have established a citizen science program to find ash trees that have survived the EAB invasion. These trees will become the foundation of efforts to breed more trees resistant to the EAB, which could be used to restore our forests.

The program is called “MaMa” – Monitoring and Managing Ash. So far, about 30 plots have been set up in New York, New Jersey, and Vermont where citizens are monitoring ash trees that have apparently survived the EAB invasion. The program seeks additional partners from other areas.

Searches for lingering ash must be strategically timed to ensure that the trees identified are truly resistant to EAB – not just late to become infested. But you can’t wait too long after the infestation wave has gone through an area, because the tree might die due to wind throw or human activity. Or, if a tree has just partial resistance (an important attribute for breeding!), it might eventually succumb. It is also imperative to avoid confusing stump sprouts with truly lingering ash. The conclusion: monitor the infestation and search for lingering trees two years after 95% of ash have been killed, or four years after 50% have been killed.

The MaMa program provides guidance, maps, electronic reporting systems … so you can help!

If you wish to participate – or to learn more – contact the program at monitoringAsh.org or 845-419-5229.

SOURCES

Olson, D.G. and L.K. Rieske. 2019. Host range expansion may provide enemy free space for the highly invasive emerald ash borer. Biol Invasions (2019) 21:625–635

Wagner, D.L. Emerald Ash Borer Threatens Ash-feeding Lepidoptera. 2007. News of the Lepidopterists’ Society. Volume 49, No. 1 (Spring 2007)

Posted by Faith Campbell

We welcome comments that supplement or correct factual information, suggest new approaches, or promote thoughtful consideration. We post comments that disagree with us — but not those we judge to be not civil or inflammatory.

USFS Lacks Sufficient Resources to Counter Threats to our Forests

We have long known that significant damage to our forests have been caused by non-native insects and diseases. Now USFS scientists have found that exacerbated mortality caused by these pests is showing up in official monitoring data – the Forest Inventory and Analysis (FIA) data. In a presentation at the 81st Northeastern Forest Pest Council, Randall Morin described the results of applying FIA data to determine  mortality levels caused by several of the most damaging invaders. He found an approximately 5% increase in total mortality volume nation-wide.

Morin also compared a map prepared by Andrew Liebhold showing the number of non-native tree-killing pests established in each county of the continent to the mortality rates for those counties based on the FIA data. (See two maps below.)

map showing number of non-native forest pests established in each county of the Continental States; from Liebhold/USFS
Dr. Randall Morin’s map showing levels of tree mortality, based on FIA data

Counties showing the highest mortality rates in FIA data do not align with counties with highest numbers of invasive species. Morin thinks the discrepancy is explained by such human factors as invasion pressure and the ease of pest movement through the good transportation network in the Northeast. He assigns less importance to habitat invasibility.

The increase in mortality above the background rate was the worst for redbay due to laurel wilt disease – the annual mortality rate rose from 2.6% to 10.9% — slightly more than a four-fold increase. Almost as great an increase in mortality rates – to approximately three-fold – was found for ash trees attacked by the emerald ash borer (from 2.6% to 10.9%); beech dying from beech bark disease (from 0.7% to 2.1%); and hemlock killed by hemlock woolly adelgid, hemlock looper, and other pests (from 0.5% to 1.7%).

Some species are presumed to have an elevated mortality rate, but the pre-invasion “background” rate could not be calculated. These included American chestnut (mortality rate of 7%), butternut succumbing to butternut canker (mortality rate of 5.6%), and elm trees succumbing to “Dutch” elm disease (mortality rate of 3.5%).

The non-native pests and pathogens that have invaded the largest number of counties are white pine blister rust (955 counties), European gypsy moth (630 counties), dogwood anthracnose (609 counties in the East; the western counties were not calculated); emerald ash borer (479 counties); and hemlock woolly adelgid (432 counties).

The invaders posing the most widespread threat as measured by the volume of wood of host species are European gypsy moth (230.9 trillion ft3), Asian longhorned beetle (120.5 trillion ft3), balsam woolly adelgid (61 trillion ft3), sudden oak death (44.6 trillion ft3), and white pine blister rust (27.7 trillion ft3).

The proportion of the host volume invaded by these non-native pests is 94% for white pine blister rust, 48% for balsam wooly adelgid, 29% for European gypsy moth, 12% for sudden oak death, and one half of one percent for Asian longhorned beetle.

Of course, measuring impact by wood volume excludes some of the species suffering the greatest losses because the trees are small in stature. This applies particularly to redbay, but also dogwoods. Also, American chestnut was so depleted before FIA inventories began that it is also not included – despite the species’ wide natural range and large size.

[You can see the details for particular species by visiting the FIA “dashboards”. A particularly good example is that for hemlock woolly adelgid, available here.

USFS Response

Of course, the Forest Service has been trying to counter the impact of invasive insects and pathogens for decades, long before this study documented measurable changes in mortality rates.

Unfortunately, funding for the agency’s response has been falling for decades – with concomitant reduction in staffs needed to carry out the work. See the graph below from p. 108 of my report, Fading Forests III, available here.

The President’s FY2020 budget proposes additional cuts.

The proposal would cut funding for the USFS Research division by $42.5 million (14%); cut staff  by 212 staff years (12.5%). It would refocus the research program on inventory and monitoring; water and biological resources; forest and rangeland management issues, especially fire; forest products innovations; and people and the environment.

As shown by the above graph, this proposed cut follows years of loss of expertise and research capacity.

The President’s budget proposes to slash the State & Private Forestry account by 45.6% – from $335 million to just $182 million. The critically important Forest Health Management program is included under State & Private Forestry. The cuts proposed for FHM are 7% for work done on federal lands (from $44.9 million to $41.7 million; and 16% for work done on non-federal “cooperative” lands (from $38 million to $31.9 million). Staffing would be reduced by 4% for those working on federal lands, a startling 38% for those working on cooperative lands.

For details, view the USDA Forest Service budget justification, which can be found by entering into your favorite search engine “FY2020 USFS Budget”. Funding details begin on p. 12; staffing number details on p. 15.

These severe cuts are proposed despite the fact that the budget justification notes that pests (native as well as exotic) threaten more than four million acres and that those pests know no boundaries. The document claims that the Service continues to apply an “all lands” approach.

When considering individual invasive pest species, these proposed cuts exacerbate reductions in previous years. Some cuts are probably justified by changes in circumstances, such as improved understanding of a species’ life cycle resulting from past research. However, some are still troubling. (Again, for details, view the USDA Forest Service budget justification, which can be found by entering into your favorite search engine “FY2020 USFS Budget”. A table listing species-specific expenditures in recent years, and the proposed FY2020 levels, is on pp. 38-39.)

The budget proposes to eliminate spending to manage Port-Orford-cedar root disease – which was funded at just $20,000 in recent years but received $200,000 as recently as FY2016. Forest Health Management would cease funding restoration for whitebark pine pests, including white pine blister – despite widespread recognition of the ecological importance of this species. Research on blister rust would continue, but at just over half the funding of recent years. Spending on oak wilt disease would be cut by 45%; funding for protecting hemlocks by 40% (the latter received $3.5 million in FY16). Funding for management of sudden oak death is proposed to be cut by 31% . Cuts to these programs seem particularly odd given that much of the threat is on federal lands – the supposed priority of the Administration’s budget.

The budget calls for a 12% cut in funding for the emerald ash borer – at the very time that USDA APHIS plans to terminate its regulatory program and state agencies and conservationists are looking to the Forest Service to provide leadership.

According to Bob Rabaglia, entomologist for the Forest Health Management program, the proportion of the FHM budget allocated to invasive alien species (as distinct from native pests) has been rising in recent years. Some of this increase is handled through a new “emerging pest” account. Species targeted by these funds, I have been told, include beach leaf disease; goldspotted oak borer; and the invasive polyphagous and Kuroshio shot hole borers.

Unfortunately, the “emerging pest” account funds are not included in the table on pp. 38-39 of the budget justification. Nor have I been able to learn from program staff how much money is in the fund and how much has been allocated to these or other pest or disease threats.

Adequate funding of the USFS Research and Forest Health Management programs could allow the agency to support, inter alia, efforts by agency and academic scientists to breed trees resistant to the damaging pest. I am aware, for example, of efforts to find “lingering” ash, beech, hemlock, whitebark pine, and possibly also redbay. None is adequately funded.

Please contact your member of Congress and Senators and urge them to support adequate funding for these two Forest Service programs. Research should be funded at $310 million (usually 5% or less of these funds is devoted to invasive species); Forest Health should be funded at $51 million for cooperative lands and $59 million for federal lands. It is particularly important to advocate for funding for the “cooperative lands” account since both the Administration and many members of Congress think the Forest Service should focus more narrowly on federal lands.

It is particularly important to contact your member if s/he is on the Interior Appropriations subcommittees. Those members are: 

House:

  • Betty McCollum, Chair  (MN 4th)
  • Chellie Pingree (ME 1st)
  • Derek Kilmer (WA 6th)
  • José Serrano (NY 15th)
  • Mike Quigley (IL 5th)
  • Bonnie Watson Coleman (NJ 12th)
  • Brenda Lawrence (MI 14th)
  • David Joyce, Ranking Member  (OH 14th)
  • Mike Simpson (ID 2nd)
  • Chris Stewart (UT 2nd)
  • Mark Amodei (NV 2nd)

Senate:

  • Lisa Murkowski, Chair (AK)
  • Lamar Alexander (TN)
  • Roy Blunt (MO)
  • Mitch McConnell (KY)
  • Shelly Moore Capito (WV)
  • Cindy Hyde-Smith (MS)
  • Steve Daines (MT)
  • Marco Rubio (FL)
  • Tom Udall, Ranking (NM)
  • Diane Feinstein (CA)
  • Patrick Leahy (VT)
  • Jack Reed (RI)
  • Jon Tester (MT)
  • Jeff Merkley (OR)
  • Chris van Hollen  (MD)

Posted by Faith Campbell

We welcome comments that supplement or correct factual information, suggest new approaches, or promote thoughtful consideration. We post comments that disagree with us — but not those we judge to be not civil or inflammatory.

Progress in Combatting Invasives – with Caveats

Missouri Makes Progress in Eradicating Feral Hogs – Despite Sabotage

Feral hogs have expanded their range in the U.S. from 17 to 38 states over the past 30 years. Their populations grow rapidly because feral hogs can breed any time of the year and produce two litters of one to seven piglets every 12 to 15 months. [See MDC Press Release, January 25, 2019]

hog “sounder” in a trap in Missouri
Missouri Department of Conservation

Missouri’s program is increasingly successful: the numbers of hogs removed has risen from 5,358 in 2016, to 6,561 in 2017, to 9.365 in 2018. [See MDC Press Release, January 25, 2019] I have previously praised Missouri’s scientifically-based program to eradicate feral hogs – here and here (Missouri has extensive material on feral hogs posted here)  

According to the Missouri Department of Conservation’s feral hog elimination team leader, Mark McLain, said “This strategic approach is important because if we leave even a few feral hogs behind in an area, they can reproduce quickly and put us back where we started.”

According to McLain, hunting is not an effective method for eliminating feral hog populations. “For over 20 years, unregulated hunting of feral hogs was allowed in Missouri, during which time our feral hog population expanded from a few counties to over 30 counties,” he said.

In 2017, MDC, the Corps of Engineers, and the LAD Foundation established regulations against feral hog hunting on lands owned and managed by these three organizations. Other agencies have passed regulations similar to MDC’s to eliminate hog hunting on land they own.

However, illegal releases of feral hogs continue. The February 2019 press release (referenced below) describes several examples of the problems such releases cause. McLain said that those who release feral hogs face hefty fines. Hunting, especially with dogs, pushes the hogs onto neighboring property, which causes problems for neighbors. The hogs travel back and forth between the properties, escaping and causing more damage. Trapping with no hunting interference is the best method to eliminate them.

MDC advises landowners to seek help from the Department and USDA APHIS. These agencies providetechnical advice and training; conduct on-site visits; and loan equipment.

Are feral hog programs in other states using the same methods? Are they as successful?

SOURCES

Missouri Department of Conservation. More than 9,300 Feral Hogs Eliminated from Missouri in 2018. Press Release. January 25, 2019.

Missouri Department of Conservation. Interference with feral hog trapping sites costs trappers time, taxpayers money. Press Release. February 21, 2019.

Florida Looks to Biocontrol to Makes Progress Against Some of its Worst Invasive Plants

Brazilian peppertree tangle
John Randall, The Nature Conservancy
www.bugwood.org

Until recently, melaleuca (Melaleuca quinquenervia) was considered the worst invasive tree or shrub in Florida. It threatened to convert the everglades “sea of grass” into a thicket of exotic trees which could not support native wildlife. Thanks to the biocontrol agent Oxyops vitiosa, melaleuca is considered to be under maintenance control on public conservation land in the state. Still, melaleuca control demands about $2 million per year because of the huge area previously (and still) affected by the tree.

Now Florida is about to release biocontrol agents to attack Brazilian pepper (Schinus terebinthifolius). In Florida, Brazilian peppertree is found from Monroe County in the south to St. Johns, Levy, and Nassau counties in the north plus Franklin County in the Panhandle. An estimated 283,000 hectares of south and central Florida are invaded. The South Florida Water Management District alone is spending approximately $1.7 million per year (as of 2011) to control it.

Brazilian peppertree invades disturbed sites such as canal banks and fallow farmlands. Of greater concern to me are the many natural communities invaded – Brazilian peppertree infests more natural areas in Florida than any other invasive plant species. Invaded ecosystems include pinelands, hardwood hammocks, and critically important mangrove forests. The coastal mangroves are valued because of their high productivity, wildlife habitat, and shoreline protection and stabilization.

Brazilian peppertree infestation in the Everglades
Tony Pernas, USDI National Park Service
www.bugwood.org

Dense stands of Brazilian peppertree shade out and may kill food plants used by white-tailed deer – key prey for the endangered Florida panther. Other mammals and birds might be poisoned by toxic resins in the bark, leaves and fruits — although some birds feed extensively on the fruits – and thereby contribute to spread of the invasive plant.

Existing options for management of Brazilian peppertree, including chemical, mechanical, and physical control measures, have been used with some success against this weed. However, applying these strategies repeatedly to prevent regrowth is costly and labor intensive. Furthermore, such practices can be detrimental to native vegetation. For example, mangroves are particularly sensitive to both herbicides and the soil disturbances associated with mechanical control

After more than 20 years of searching, Florida hopes it has identified useful biocontrol agents. USDA APHIS is seeking public comment on the proposed release of two insect species, Calophya latiforceps  (a leaf galling psyllid) and Pseudophilothrips ichini (a thrips) as biological control agents targetting Brazilian pepper.

Much as I sympathize – Brazilian peppertree is a highly damaging invasive plant and there are no other effective control measures – I have questions. First, the psyllid is sedentary; dispersal would be by wind. Would this limit its efficacy?

More troubling is host specificity. The Environmental Assessment (available here) reveals that the thrips can reproduce in low numbers on several non-target plant species, including the Hawaiian sumac Rhus sandwicensis. True, the proposal is to release the biocontrol agents on the continent, not on Hawai`i. But insects have often been transported inadvertently to Hawai`i – and the islands’ plant species have often proved highly vulnerable to attack by non-native species (I confess that the most recent examples are pathogens, e.g., ‘ōhi‘a rust and rapid ‘ōhi‘a death.)

APHIS is accepting comments on the Environmental Assessment until March 29. Please consider providing your views. Again, the document is available here.

RESULTS

In June 2019, APHIS announced that it would issue permits for release of the two biocontrol agents on the continent – starting in Florida – without any restrictions. APHIS dismissed my concerns about the potential threat to native Hawaiian plants — Rhus sandwicensis and Dodonaea viscosa. See the agency’s responses in Appendix 7.

As regards the potential threat to the two Hawaiian species from the thrips Pseudophilothrips ichini APHIS chose to ignore my two greatest concerns:

1) that insects are introduced accidentally to Hawai`i frequently – so the threat from this thrips must be considered.

2)  if introduced to Hawai`i, P. ichini would have ample resources to maintain high population levels and so could put constant pressure on Rhus sandwicensis and Dodonaea viscosa even ‘though neither plant itself supports more than one generation of the thrips.

In response to my query as to who in Texas would be consulted re: possible release of the biocontrol agents in that state, APHIS replied the chief state plant regulatory official (head of plant pest issues in the state Department of Agriculture) and the APHIS representative in the state. No conservation authorities are designated. Nor would APHIS prepare a new environmental assessment – although the current one cites data almost exclusively for Florida.

One good response: in response to my concerns that the psyllid Calophya latiforceps is too sedentary to spread through the hundreds of thousands of acres invaded by Brazilian pepper, APHIS clarifies that a mass rearing and release program is under development.

Posted by Faith Campbell

We welcome comments that supplement or correct factual information, suggest new approaches, or promote thoughtful consideration. We post comments that disagree with us — but not those we judge to be not civil or inflammatory.

Invasive Species Policy: Will New Law Empower Agencies? Or Hinder Strategic Planning, Research, and Engaging the Public through Outreach?

Much-Heralded Major Conservation Legislation — S. 47 – Mandates “On-the-Ground” Actions 

Senate bill S. 47 enjoyed strong support from the conservation community because it expanded protection for several National parks and wilderness areas, mandated easier access to public land for hunters and anglers, and provided permanent status for the most important program that funds purchase of lands and waters for recreation and other purposes – the Land and Water Conservation Fund. It passed the Senate on February 12, 2019 by a vote of 92 for, 8 against. The bill passed the House of Representatives on February 26, 2019 by a vote of 363 for, 62 against. Everyone expects President Trump to sign it into law.

The new language had previously been a stand-alone bill introduced in two previous sessions of Congress. The first version, S. 2240, was introduced in 2016; I blogged about a hearing on that legislation in May 2016, describing my reservations. The bill was not enacted in that Congress. It was reintroduced in 2017, when it was called the “WILD Act” (S. 826).

Title VII of the new legislation now expected to become law governs programs implemented by the Departments of Interior, Agriculture (specifically the Forest Service) and the U.S. Army Corps of Engineers. It also applies to the head of “any federal agency” having duties related to planning or treatment of invasive species “for the purpose of protecting water and wildlife on land and in water.”

Title VII takes the form of an amendment to the Fish and Wildlife Coordination Act (16 U.S.C. 661 et seq.)

As in the original 2016 bill (S. 2240), the new law – at Title VII, §10(c)(2)(C) – agencies are required to adopt strategic plans for their invasive species programs. The priorities in the federal agencies’ invasive species plans will be set by state governors – not the federal agency charged with managing that land unit and its resources.

  • Under§10(a)(4)(C), tribal, regional, State, or local authorities are authorized to weigh in on the determination of which terrestrial or aquatic species fit the definitions of ‘invasive’ and ‘alien’ species.
  • Under §10(c)(3).the Secretaries are required, in developing their strategic plans, to take into consideration the ecological as well as the economic costs of acting or not acting, I welcome this provision.

Like the original 2016 bill (S. 2240), the new law – at Title VII, §10(g) – (i)  – requires land-managing agencies to allocate their invasive species funds according to the following formula: 75% for on-the-ground activity; 15% for combined research and outreach; 10% or less for administrative costs.

  • Fortunately, “on-the-ground” activities have been expanded to include
    • detection and monitoring.
    • “the use of appropriate methods to remove invasive species from a vehicle or vessel capable of conveyance.” 
    • “investigations regarding methods for early detection and rapid response, prevention, control, or management of the invasive species.”
    • It is unclear whether “on-the-ground” activities include the salaries of staff who manage such programs from desks (as distinct from people who work in the field).
  • Unfortunately, the definition of “prevention” is unnecessarily limited by §10(a)(6) (B). This clause authorizes agencies ‘‘to impede the spread of the invasive species … by inspecting, intercepting, or confiscating invasive species threats prior to the establishment of the invasive species onto land or water of an eligible State.” This clause reflects too narrow an understanding of prevention actions. They are not limited to (inefficient) inspection and seizure programs at “borders”. It is much more efficient to apply measures intended to prevent the presence of a pest in the transported good in the place of production. One example is APHIS’ requirements governing nursery stock intended to be shipped interstate so as to prevent the spread of the sudden oak death pathogen.

Following the revised 2017 version of the bill (text here; see my blog here) the law requires the agencies to make “substantive annual net reduction of invasive species populations or infested acreage …”  (The original bill mandated an annual reduction of 5%.) It is unclear whether this mandate applies to all invasive species on the affected acreage, or only those designated by a flawed process (see below) and included in the agency’s strategic plan [Title VII, §10(c)(1)].

Under Subsection (d), the plan is to prioritize the use of methods that are effective (as determined by the Secretary, based on sound scientific data); that minimize environmental impacts; and control and manage invasive species in the least costly manner. I worry that this requirement, combined with the mandate to achieve “annual net reductions” in invasive species numbers, will promote the use of chemical pesticides.

Under Section (f), agencies are to apply all available tools and flexibilities to expedite invasive species control projects and activities. Those projects are to be located in an area that is at high risk for invasive species introduction, establishment, or spread; and determined by the Secretary to require immediate action to address that risk. These actions are to be carried out in accordance with applicable agency procedures, including any applicable land or resource management plan. This language apparently replaces earlier efforts to exclude invasive species control projects from analysis under NEPA. How this mandate interacts with state governors’ setting priorities under §10(c)(2)(C) is unclear.

Remember that under the funding allocations specified in Title VII, §10(g) – (i), “… not more than 10% may be used for administrative costs incurred to carry out those programs, including costs relating to oversight and management of the programs, recordkeeping, and implementation of the strategic plan …”. At the same time, §§10(e), (j), and (l) require economic analyses and reports detailing compliance with requirements and results of projects. In other words, the new law restricts expenditure of funds for “administrative costs” but imposes significant additional administrative duties.

Fortunately, Title VII §10(k)(1) states that “Nothing in this section precludes the Secretary concerned from pursuing or supporting, pursuant to any other provision of law, any activity regarding [invasive species]  control, prevention, or management …, including investigations to improve the control, prevention, or management of the invasive species.

In all iterations, the bills called for the projects to be carried out through collaboration with wide range of partners, including private individuals and entities – apparently including non-governmental organizations such as state or local invasive plant coalitions.

Earlier in Congressional consideration of the new law’s provisions, the National Environmental Coalition on Invasive Species (NECIS) responded by adopting its own description of an effective, comprehensive invasive species program.  Under the title “Tackling the Challenge of Invasive Species,” the coalition makes the following major points:

  • Focus prevention efforts on pathways of introduction. Until they are closed, managing established infestations will be a never-ending burden.
  • Broader and more aggressive efforts to control existing invaders is a solid investment, but should not be at the expense of other aspects of a comprehensive national response.
  • Close loopholes in the “Injurious Wildlife” sections of the Lacey Act to provide agencies with more agile processes for regulating the importation and transport of harmful invasive species.
  • Enhance funding for invasive species control and management projects; prioritize efforts to reduce invasive species’ spread at landscape scales.
  • Ensure that federal actions do not inadvertently promote the introduction or spread of harmful invasive species; use caution when promoting nonnative species for biofuels, bioenergy, or other
  • purposes.
  • Adopt metrics to gauge the effectiveness of efforts to prevent the introduction and spread of new invasives and to achieve long-term control or removal of existing invaders.
  • Support robust research and outreach programs, which are essential to improving the efficacy of federal, state, and local invasive species prevention and control efforts.

Given the new legislation’s focus on land-managing agencies, I point to the importance the coalition gave to research on the invasion processes utilized by various species and education of land and water users  so as to gain their cooperation. These recommendations are directly counter to the new law’s stringent limitations on research and “outreach”.

I think particularly pertinent are the recommendations on metrics to measure programs’ efficacy. Proper metrics should metrics address outcomes and program effectiveness re:

  • efforts to prevent species introduction and spread
  • activities that target pathways or vectors
  • the effectiveness of treatments in eradicating or reducing the target invasives.

Potential additional metrics include, but are not limited to:

  • Rate of new invasions; possibly categorized by type of invader or geography
  • Acres infested and changes in infestations over time
  • Acres protected, based on projections of future spread avoided by eradication
  • Economic impact of invasive species
  • Number of species intercepted.

The full document is available here .

Posted by Faith Campbell

We welcome comments that supplement or correct factual information, suggest new approaches, or promote thoughtful consideration. We post comments that disagree with us — but not those we judge to be not civil or inflammatory.