As indicated by Strategic Plans and Annual Reports
In recent months, APHIS has released its 2019–2023 Strategic Plan and its 2018 annual report – which outlines how well the agency is doing in achieving goals from the 2015-2018 Strategic Plan. There is lots of information in these documents – but it is often presented in ways that make understanding it difficult. Still, I will attempt to compare the APHIS’ 2015 Strategic Plan and the 2019 Plan as well as review recent annual reports to see what priorities APHIS has set and how well it is realizing them.
APHIS’ Mission
According to the APHIS website, the agency’s mission is to safeguard U.S. agricultural and natural resources against the entry, establishment, and spread of economically and environmentally significant pests and to facilitate the safe trade of agricultural products.
The 2019 Plan shortened this Mission: To safeguard the health, welfare, and value of American agriculture and natural resources.
The 2019 Plan links the Mission tightly to U.S. Department of Agriculture priorities, e.g., honesty and integrity, commitment, accountability, reliability, and responsible stewardship of taxpayer resources. There follow promises to deliver services with a customer focus, efficiency and responsiveness, and ensuring that phytosanitary protection is at a reasonable cost. There is great emphasis in the 2019 plan on understanding how agricultural businesses operate, collaborating with partners, and seeking alternatives to regulation.

Goals
The 2019 Strategic Plan also amends the agency’s goals – they are much more general, less specific. The new goals emphasize program efficiency, collaborative approaches, and empowering employees. Perhaps these changes were made because the 2019 Plan covers the entire agency while the earlier (2015) Plan guided only Plant Protection and Quarantine (PPQ. However, I fear that the new goals reflect a much greater emphasis on non-regulatory approaches.
Contrasting Goals
The 2015 Strategic Plan’s three goals are:
1. Strengthen APHIS Plant Protection and Quarantine’s (PPQ) pest exclusion system;
2. Optimize domestic pest management and eradication programs; and
3. Increase the safety of agricultural trade to expand economic opportunities in the global marketplace.
The 2019 Strategic Plan goals:
1. Deliver efficient, effective, and responsive programs.
2. Safeguard American agriculture.
3. Facilitate safe U.S. agricultural exports.
I excluded from my analysis generalized goals and objectives pertaining to employee training, empowerment, etc.
Each of the plans’ goals is supported by several objectives, and in the 2019 Plan by tactics. These are the specific actions that are to be taken – and progress measured. All the objectives and actions in the 2015 Strategic Plan are relevant to APHIS’ Plant Protection and Quarantine program, whereas only a few of the 2019 Plan are.
Will this mean that we will lose track of what is happening in important areas?
For now, I provide a summary of events and progress as reported in the annual reports from 2015 to 2018.
2015 Strategic Plan Goal 1. Strengthen PPQ’s pest exclusion system. The objectives called for addressing pest risks at the first opportunity – preferably at the point of origine; and making better use of the information the agency collects to target and reduce pest threats.
Strategic Plan Goal 2. Optimizing pest management and eradication. The objectives called for closer coordination with partners to focus combined resources on obtaining the greatest results.
Strategic Plan Goal 3: Increase the safety of agricultural trade to expand economic opportunities in the global marketplace. These objectives integrated APHIS into collaborating with foreign counterparts to promote the development and use of internationally and regionally harmonized, science-based phytosanitary measures. The purpose is to reduce barriers to trade, especially U.S. agricultural exports.
APHIS also promised to use the best available science, data, and technologies to strengthen the agency’s effectiveness and deliver results for the industries it serves.
Assessing Progress
Unfortunately, APHIS did not stick to standardized metrics in the annual reports. This lapse undermines efforts to use the reports to evaluate progress. Use of different metrics are apparent in reporting on a) numbers of pre-clearance programs, b) Asian gypsy moth detections; c) volumes of seed imported; d) amounts of illegal imports seized.
Progress on Goal 1, Objective 1: Address Risks Early
The first opportunity to counter a pest risk is offshore – before the product or crate or container even starts its journey to the U.S.
APHIS has expanded its off-shore pre-clearance programs under which shipments of fruit, vegetables, bulbs and plants are inspected overseas – so as to catch pests before the products even begin their journey. Between 2015 and 2018, the number of programs grew from 30 programs in an unspecified number of countries to programs covering 72 different types of commodities in 22 countries.
APHIS is concerned about the pest risks associated with the huge volume of ornamental plant cuttings shipped to the US. As pointed out in the 2017 report, more than half of the bedding plants sold at retail started from a cutting produced in a greenhouse located offshore – usually in a tropical or subtropical country. The high-volume imports impose a heavy burden on inspectors at APHIS’ 16 Plant Inspection Stations. APHIS already had a small program encouraging producers to follow “clean” procedures in growing plants; in 2016 it involved 17 facilities. That same year, APHIS began framing a larger program that would provide incentives to encourage production facilities voluntarily to adopt integrated pest management measures. However, a six-month test in 2017 did not demonstrate that the program brought about a statistically significant reduction in risk. So PPQ and its partners in the U.S. nursery industry agreed to repeat the pilot during the 2018–2019 shipping season and refine the voluntary certification program (2018 report).
Post-Entry Safeguards
A second line of defense is quarantine within the United States after plants are imported – so-called “post-entry quarantine”. This program allows importers to bring in small numbers of plants that pose a particularly high risk of transporting pests so that they can be incorporated into U.S. agricultural (including horticultural) production. These plants are placed in a certified quarantine facility for close observation – usually for a two-year period. Program requirements are described here. Over the years covered by these annual reports, the number of plants released from PEQ varied considerably – as high as 898 in 2017, half as many (425) in 2018, with intermediate numbers in the earlier years. The number of species has varied less – between 10 and 14, with the highest in 2017. I was unable to detect a pattern.
Results of these efforts – Numbers of pests detected
1. Detections at the Ports
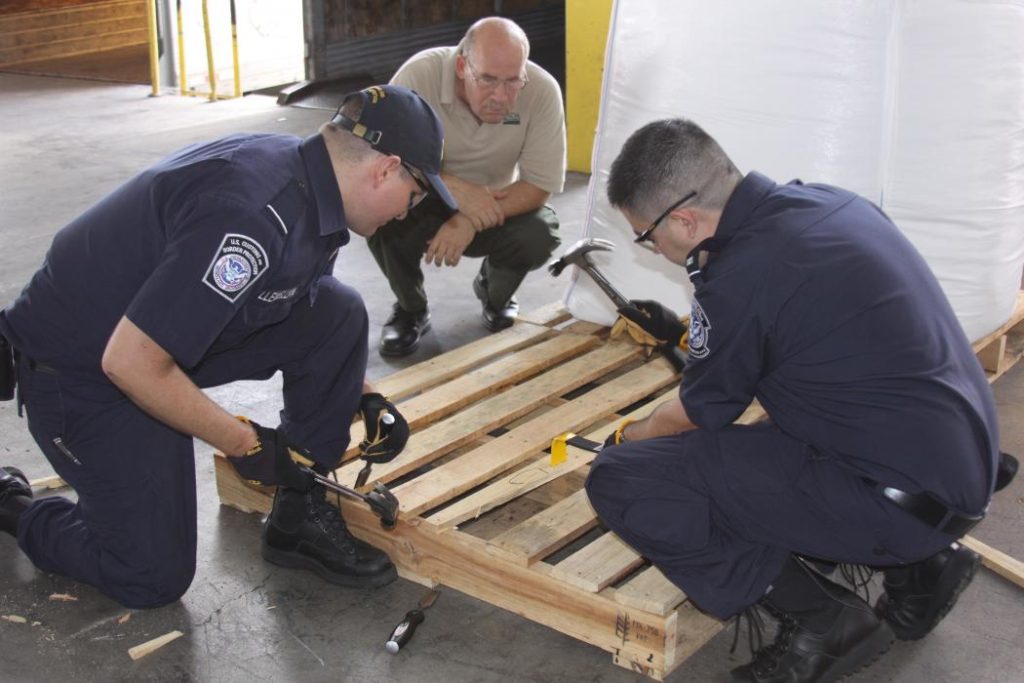
The 2015 report stated that the agency had detected more new pest detections and saw higher numbers of pest outbreaks than in previous years (but it did not provide specific numbers). Subsequent reports show declines in pests detected (although we cannot evaluate the “pest approach rate” because key information is not collected) [see Appendix II of Fading Forests III, available here] In 2016, APHIS identified 162,000 pests in imported shipments; of this total, 73,700 were quarantine pests. The 2017 report said APHIS identified 143,411 pests in imported shipments; of this total, 71,158 were quarantine pests. In 2018, APHIS identified 140,822 pests; nearly half of this total were quarantine pests.
A particularly dangerous pest: Asian Gypsy Moth
Among the detections reported are those of the Asian gypsy moth egg masses on ships from Asia.
Phytosanitary officials and conservationists have been concerned about this threat since the early 1990s. APHIS and its Canadian counterpart (Canadian Food Inspection Agency) and the two countries’ customs agencies have worked together since then to minimize the likelihood that AGM egg masses will be transported on ships or hard cargo (containers, automobiles, etc.). The most important step was the adoption by the North American Plant Protection Organization link of Regional Standard of Phytosanitary Measures (RSPM) No. 33 in 2009; it was revised in 2015 and 2017.
While the standard has apparently resulted in significant declines in arrivals of ships contaminated by egg masses, the lack of consistent reporting measures make it difficult to compare detection results from year to year. In the various reports, APHIS reports varying types of data – e.g., sometimes percentage of ships, sometimes number of ships, sometimes percentage decline in number of egg masses found on ships For example, the 2017 report stated that the number of incoming ships with AGM egg masses had been reduced from 48 in 2014 to 0 2017. The 2018 report is confusing. In a single paragraph (p. 5) it states both that more than 98% of inspected vessels entering U.S. ports from Asia were free of AGM; and that the compliance rate hit an all-time high of 92%, a 10% increase over the previous year’s rate.
The annual reports also describe regional and international efforts to reduce the likelihood that AGM egg masses will be transported to North America. The 2016 and 2017 reports described meetings with Canada and Chile – other countries worried about AGM introductions – and with four “source” countries — China, Japan, Russia, and South Korea – to promote better compliance with vessel certification program requirements. Also, APHIS began monitoring for AGM on U.S. military bases in Japan and South Korea.
The reports also note progress in ensuring eradication of AGM outbreaks in various U.S. locations. There had been single AGM moths detected in Oklahoma in 2013 and 2014; in South Carolina in 2014 and 2015; and in Georgia in 2015. (News releases had also reported AGM egg masses on a ship in Baltimore harbor in 2013.) The 2017 report notes that after three years of negative surveys, PPQ confirmed that Oklahoma is free of the pest. The 2018 report said South Carolina and Georgia also had been declared free of AGM. Surveys continue in treated areas of Washington and Oregon, where 14 moths were found in 2015 (2017 report).
2. Pests Detected in Sea Containers

In 2016, PPQ initiated a collaborative exploration with Canada and the shipping and sea container industries to address pest risks associated with the movement of sea containers. The goal of the initiative is to develop container-cleaning guidelines that can be implemented on a global scale. In 2017, PPQ gave a presentation to the members of the International Plant Protection Convention (IPPC) re: the complexity of this issue. The IPPC formed a Sea Container Task Force, which continues to work.
A specific case (which should not have been a surprise)
In 2017, APHIS was startled to learn from an importer that containers of airplane parts shipped from Italy were infested by snails. APHIS began working with both the importers and the suppliers to minimize the presence of snails. I confess to a sense of irony. Wood packaging from Italy has been a well-recognized pathway for the movement of snails since at least 1985! How could APHIS staff be surprised when snails turn up on containers? I hope APHIS’ effort to persuade Italian machinery manufacturers to clean up their loading docks and storage facilities are more successful than similar efforts in the past targetting marble quarries and tile manufacturers.
3. Pests Detected in Imports of Living Plants and Seeds.
Plant import volumes have averaged about 1.5 billion units (cuttings, whole plants, other propagative materials) per year in 2015 through 2018. (The recent import level is less than half the volume of imported plants before the Great Recession in 2008 – those imports exceeded 3.15 billion plants in 2007 – Liebhold et al. 2012; full citation at end of blog.) Reported imports of seed were sometimes in pounds, sometimes in tons (not clear whether Imperial or metric tons), and once in kilograms. So, if my math is correct, seed imports probably varied from a low of 1.39 million pounds in 2018 to a high of 3.74 million pounds in 2017. The number of shipments in which the plant units were packaged varied from a high of more than 19,000 in 2015 to a low of 17,000 in 2017. Again, I cannot detect a pattern.
The number of quarantine pests detected varied from a low of 690 in 2016 to a high of 1,173 in 2918. That last year also had the highest number of plant units imported – 1.7 billion – 100,000 to 200,000 more than in previous years. Whether these detection numbers accurately reflect the true pest approach rate via this pathway is difficult to know. A study by Liebhold et al. (2012 full citation at end of blog) found that up to 72% of infested shipments were not detected by inspectors.
Progress on Goal 1, Objective 2: Making Better Use of Information
A major thread in past analyses of APHIS programs is the poor use of data to evaluate and improve program efficacy. APHIS is trying to overcome these deficiencies (although note the use of inconsistent numbers in the annual reports).
One important focus is the on-going effort to implement risk-based sampling protocols at the Plant Inspection Stations. APHIS says its goal is to ensure that an inspector operating with 80% efficiency is able to detect any shipment with a 5% infestation level. The level of confidence that such a detection has been accurate should be 95%. Developing the sampling and inspection system has been a challenge; APHIS adjusted one aspect of it in 2018 (according to that year’s annual report). APHIS is also using statistical methods to try to estimate the pest approach rates for specific types of plant material (2017 report).
APHIS is also striving to integrate its data analysis programs with those of DHS Bureau of Customs and Border Protection (CBP). A pilot program testing risk-based sampling at four Texas border ports focuses on imported commodities rather than the accompanying wood packaging. This is unfortunate given the high levels of detection of wood packaging from Mexico that is in violation of applicable international rules in ISPM#15). [See my discussion from February 2017.]
Finally, APHIS is testing use of molecular diagnostics to detect diseases that may not be found through visual inspection – although this is still experimental in 2018 after more than two years of evaluation.
Progress on Goal 2: Optimizing Pest Management and Eradication
Remember that the objectives emphasized coordinating with and “wisely us[ing]” partners’ abilities.
Seizures of illegal imports
Again, the reporting units vary so it is hard to compare between years. In 2015 and 2016, seizures were reported in pounds of prohibited plants, plant products, meat, and meat products that had entered the country illegally. Such seizures fell from more than 290,000 pounds in 2015 to 102,000 pounds in 2016. In 2017 and 2018, seizures were reported as numbers of prohibited items and their retail value. In 2017, APHIS seized 2,347 prohibited agricultural items valued at more than $554,000 from retail stores, internet sales, and express shipment courier inspections. In 2018, seizures rose to 3,222 prohibited items valued at over $2.6 million.
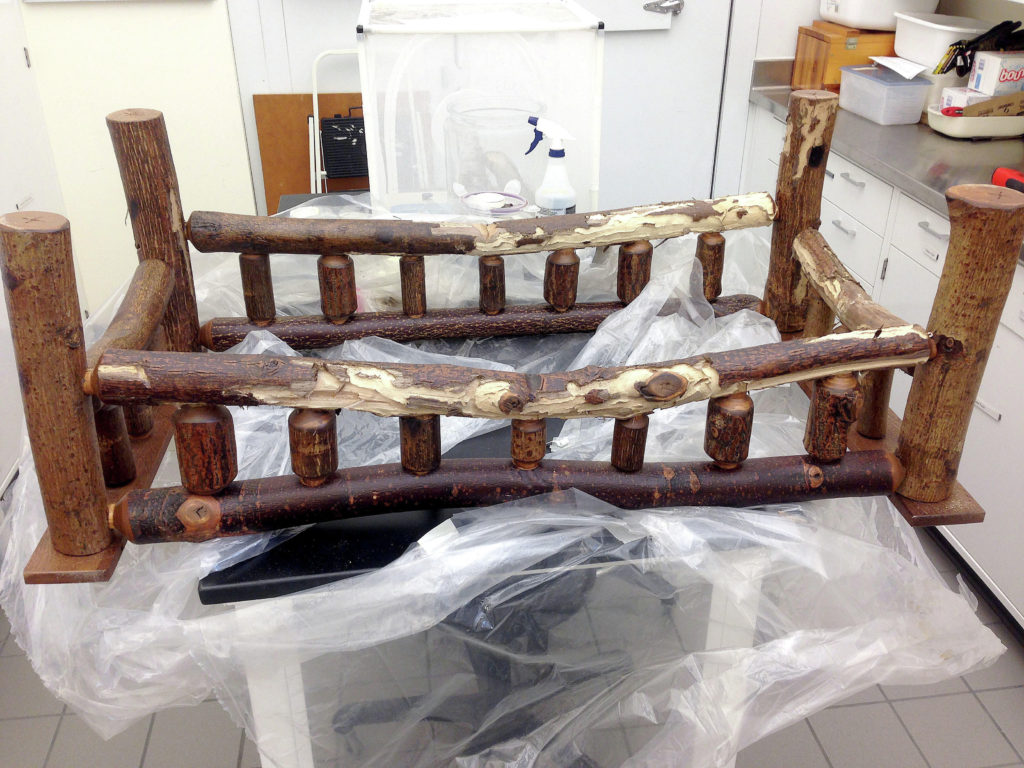
APHIS also sometimes recalled items – there were 24 national recalls in 2017, 28 in 2018. In 2016, PPQ’s Furniture Recall Team coordinated a nationwide consumer-level recall of imported pine furniture after customers complained that insects, later identified as brown fir longhorned beetles, were emerging from the furniture. The combined federal-state-retailer effort recovered and destroyed 83% of the purchased furniture pieces and 100 % of the furniture that remained in the warehouse. This effort won APHIS’ internal Safeguarding Award in 2016.
Pest Eradications (I include here only tree pests; the reports note success on European grape vine moth and pink bollworm.)
Annual reports noted gradual progress in eradicating Asian longhorned beetle outbreaks. As of 2016, APHIS reported eradication of 85% of the ALB-infested area in New York, 34% of the area Massachusetts, and 15% of the OH infestation. In 2018, APHIS announced eradication of ALB from two townships in Clermont County, Ohio.
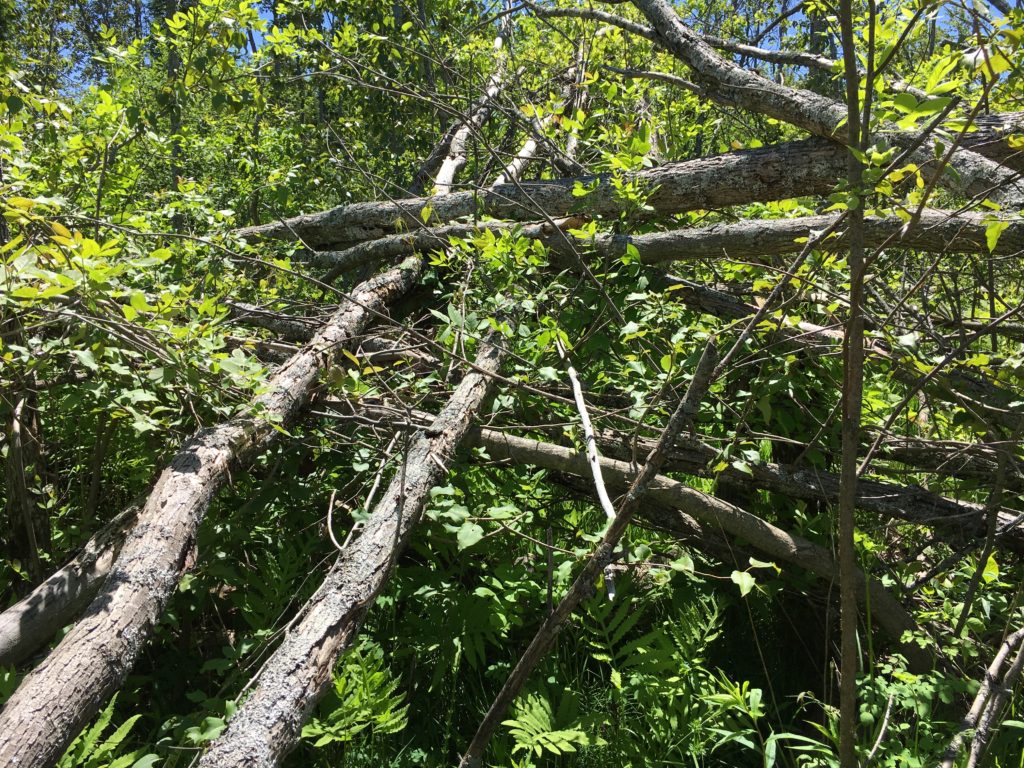
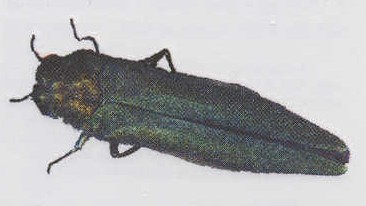
In 2016 APHIS reported that it has begun focusing the emerald ash borer program on biocontrol. The agency reported releasing more than 1.2 million parasitic wasps in 20 states in what the agency called “trial releases” in 2015. By 2017 the agency released wasps in 25 states and the District of Columbia and reported detections of reproducing wasp populations in 14 states. In 2018, APHIS released more than 1 million wasps – again in 25 states; and reported recoveries of offspring in 17 states. In that last year, APHIS issued a formal proposal to end the regulatory program restricting movement of EAB vectors. In earlier blogs I explained my opposition to this proposal. See earlier blogs here and here.
This proposal was adopted after APHIS implemented a new “decision framework” (see 2016 report). Presumably APHIS considers this framework to implement Goal 2,” Optimize domestic pest management and eradication programs.” Given the controversy around the emerald ash borer proposal, however, I am skeptical that it fulfills the two objectives – coordinating with partners and using partners’ “ unique capacities … to strengthen and extend PPQ’s domestic programs.” Instead, to me, this decision reflects the agency’s eagerness to dump difficult programs onto others – in this case, state agencies and conservation organizations. For more on this “dumping” proclivity, see also “FRSMP” below.
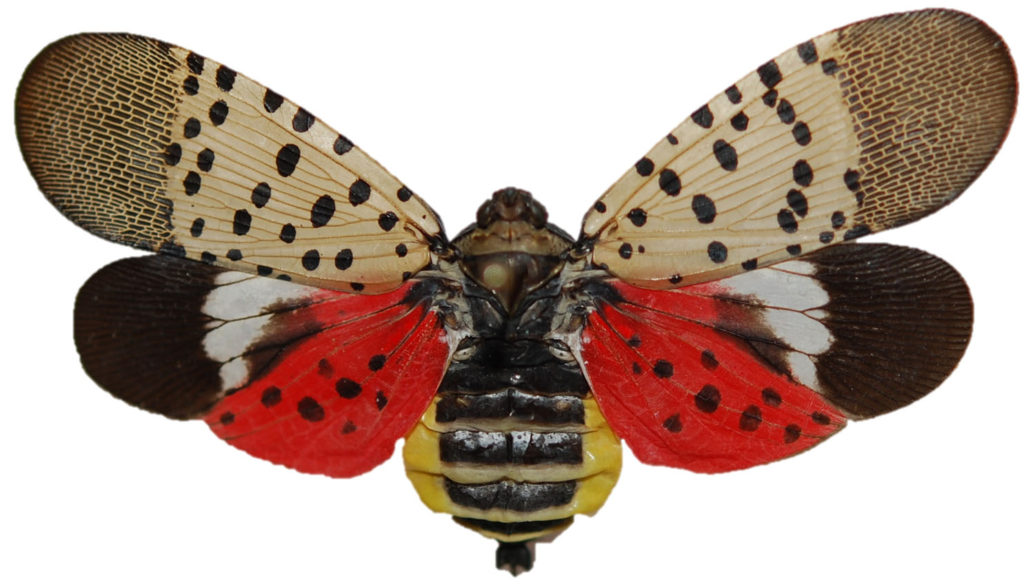
In 2018 APHIS also reported expanding its engagement with the spotted lanternfly — which I think should have been much more vigorous earlier [see here]. APHIS said it would focus on the leading edge of the infestation in Pennsylvania, while the Pennsylvania Department of Agriculture took the lead within the core infested area. APHIS also said it would assist State departments of Agriculture in Virginia, New Jersey, and Delaware, where outbreaks have been detected.
Surveys
Pest surveys are one tool for early detection of pests, so they are important to pest eradication and management. Surveys have long been collaborative efforts with the states and others, funded through the CAPS and Farm Bill programs (see below). The number of pests targeted in the surveys have crept up from 346 in 2015 to 386 in 2018. The number of quarantine pests detected varies year-to-year: 16 in 2016; 30 in 2017; 12 in 2018. According to the report, all were detected before they could cause significant damage.
APHIS has been testing use of both dogs and unmanned aircraft (drones) for surveys of tree pests. Dogs have shown promise in detecting AGM egg masses on ships, coconut rhinoceros beetle in mulch piles, and insect frass in wood packaging.
Other Initiatives
APHIS is actively pressing for widespread adoption of electronic phytosanitary certificates, which it expects to both ease processing burdens and reduce opportunities for fraud. Efforts include test exchanges of electronic certificates with a growing number of countries and development of an action plan to be presented to the International Plant Protection Convention decision-making body in 2018.
Another initiative is to develop a holistic, integrated management systems approach to reduce risks associated with international movement of seed (a very complex trade!).
Farm Bill projects
Funding for projects under the Plant Pest and Disease Management and Disaster Program (Section 10007 of the Farm Bill; now Section 7721 of the Plant Protection Act) was not reported in the 2015 or 2016 annual reports. My analysis of the program website found that $62.5 million worth of projects was funded in FY15; 58.25 million was funded in FY17. By 2018, a total of $75 million worth of projects was funded. The number of projects funded has increased as a result – from about 430 in 2015 and 2016 to 483 in 2017 and 519 in 2018. According to my calculations, the proportion of the funding going to tree pests has averaged a little over 10% in most years. 2016 saw a spike because of spending to suppress the spotted lanternfly in Pennsylvania and to eradicate AGM outbreaks in Washington and Oregon.
Federally Recognized State Managed Phytosanitary (FRSMP) Program
In theory, the FRSMP program supports states’ efforts to prevent pests that are no longer federally regulated from entering the state’s territory. To be covered under the FRSMP Program, a pest must pose an economic or environmental risk to a state, and the state must have a program in place to eradicate, exclude or contain it. In those cases, a State may petition PPQ to list the species under the program. Between 2010 and 2018, APHIS, in collaboration with the National Plant Board, changed the regulatory status of 105 pests. I worry that at least some of these pests should continue to be the target of a federal program. My worry is exacerbated by APHIS’ plan to deregulate the emerald ash borer (described above).
Goal 3: International Coordination to Develop Science-Based Standards
The APHIS annual reports demonstrate APHIS’ active engagement with international standard-setting bodies in pursuit of its goal of pre-empting conflicts with trade partners by getting international agreement to appropriate phytosanitary measures. Since 2016, the International Plant Protection Convention has adopted 36 new international standards. The North American Plant Protection Organization adopted a new standard for using systems approaches to manage pest risks associated with the movement of forest products. APHIS assigns staff to participate on expert panels and committees, comments on draft standards, and help define the organizations’ agendas.
Forest-pest related issues addressed through one or both of these organizations include both an international and regional standard for the movement of wood products, and adoption of two new treatments for wood packaging. APHIS was also a key player in organizing two workshops aimed at improving compliance with the international wood packaging standard (ISPM#15) and another aimed at improving compliance with the ship-sanitation program intended to curtail transport of AGM egg masses. APHIS also coordinates closely with Australia, New Zealand, as well as Canada (called “the Quads”), to advance shared standard-setting priorities at the IPPC and launch key initiatives of mutual interest.
As I said at the beginning of the blog, APHIS issued a new Strategic Plan [available here] in autumn 2018. A table in Appendix A of the report provides support for some of my concerns.
Regarding APHIS’ backing away from regulatory programs and difficult pests, the table shows that 11 deregulatory actions were published in FY2017; the target for FY18 is 10, the target for FY19 is 15. Furthermore, Objective 1.3, states that APHIS will remove obstacles by ending regulations that place burdens on stakeholders but that are not supported by current science or practices. APHIS has also reinstated an internal executive regulatory management group to identify APHIS’ regulatory needs early and track them through approval.
I am even more concerned that the “performance measure” in the table in Appendix A anticipates that the percentage of high-risk pests surveyed for under the CAPS program will fall from 96% in FY17 to just 80% in FY19.
The 2019 Strategic Plan continues an earlier emphasis on science-based decisions, modernizing procedures, improving utilization of data, the need to be flexible and adjust to new situations, to work closely with partners, and to maintain leadership role in international bodies aimed at achieving protection goals while promoting safe trade. The vast majority of examples and specific actions listed in the plan pertain to animal disease issues; some actions could be interpreted as applying to both animal and plant sanitary issues. The table in Appendix A anticipates that ten new regional or international standards will be adopted in both FY2018 and FY2019.
The few plant-specific actions in the plan include the following matters that continue from previous years – but without any recognition of problems revealed in the annual reports:
• Imported plant cuttings that are produced in approved offshore facilities will be processed through a streamlined system. No mention is made that the 2017 pilot program failed to demonstrate the expected reduction of pest risk.
• By FY2019 (the current year), 60% of incoming shipments of plants will be inspected under the Risk Based Sampling (RBS) system. No mention is made of the still “in development” aspect of this system, as revealed in the 2018 and other annual reports.
• Development will continue of a new regulatory approach for seed imports based on Regulatory Framework for Seed Health (ReFreSH) (a systems approach which has been under development for several years).
• Addressing the threat of invasive pests and diseases associated with the international movement of sea containers (an international initiative begun a few years ago).
• Strengthening the North American perimeter against pest threats from outside the region.
• Preventing the sale of prohibited plant material via the internet or e-commerce.
SOURCE
Liebhold, A.M., E.G. Brockerhoff, L.J. Garrett, J.L. Parke, and K.O. Britton. 2012. Live plant imports: the major pathway for forest insect and pathogen invasions of the US. Frontiers in Ecology and the Environment, 10(3): 135-143. Online at: http://www.ncrs.fs.fed.us/pubs/jrnl/2012/nrs_2012_liebhold_001.pdf. Accessed December 7, 2012.
Posted by Faith Campbell
We welcome comments that supplement or correct factual information, suggest new approaches, or promote thoughtful consideration. We post comments that disagree with us — but not those we judge to be not civil or inflammatory.
