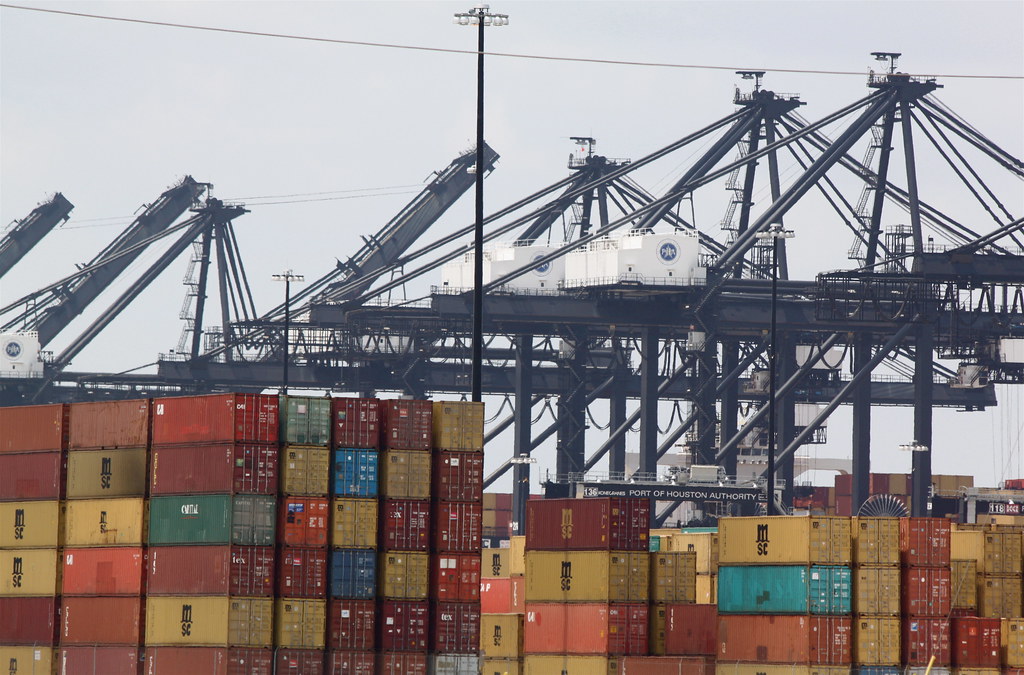
Port of Houston – Bayport Container Terminal; photo by Ray Luck via Flickr
The U.S. continued to import large amounts of goods from Asia in the first three months of 2022. During this period, total volume imported from Asia increased to 1.62 million TEU — 31.1% higher than in the same period in pre-pandemic 2019 (Mogelluzzo, B. April 22, 2022).
Due to congestion in West Coast ports, the proportion of Asian goods entering the country through East Coast and Gulf Coast ports also rose in the first quarter of 2022 compared to the same period in 2021: by about 33% along the Atlantic and 6% along the Gulf (Mogelluzzo, B. April 22, 2022). Increases were particularly steep in the south: 9.2% at Savannah; 12.5% at Norfolk; 26% at Charleston; and an astonishing 52.1% through Houston.
Due to Covid-19-related port and factory shutdowns in China, a rising share of imports to the U.S. in 2022 came from other countries in Asia. Imports grew especially from Vietnam but also Thailand, Malaysia, Indonesia, and South Korea (Wallis, K. May 11, 2022).
Port of Long Beach Pier G – ITS – MOL vessel; photo by port authority
Starting in May 2022, West Coast ports began to recover their dominant role – probably because East Coast and Gulf Coast ports were now suffering their own congestion-related delays. Virtually all the restored traffic entered through the Los Angeles-Long Beach port complex; these ports imported a monthly record of 851,956 TEU from Asia in May. Imports through Seattle and Tacoma actually declined from the previous month, while Oakland’s imports from Asia remained steady (Mongelluzzo, June 15, 2022).
Thus, the “baseline” for US imports from Asia each month is now 20 to 30% higher than it was before COVID-19 disrupted supply chains (Mongelluzzo, June 15, 2022).
East Coast Ports Deepening and Expanding to Accept Larger Ships
Meanwhile, East Coast ports continue efforts to deepen their channels and expand their infrastructure so that they can service the larger container ships.
In late June 2022 the US Army Corps of Engineers approved the plan by the Port of New York-New Jersey (PANYNJ) to dredge channels to accommodate more post-Panamax ships. The largest ship that has called at NY-NJ was 16,000 TEU; port officials hope to accommodate ships up to 21,000 TEU, apparently using current capacity (Angell, June 23, 2022; Angell, May 27, 2022). PANYNJ Port Director Bethann Rooney says the port expects to see annual volumes rise to 17 million TEU by 2050, almost double its throughput in 2021 (Angell, May 27, 2022).
The Corps found the PANYNJ plan to be both environmentally and economically sound. The Corps will now seek Congressional funding for the project in the 2024 Water Resources Development Act; the Port Authority will also contribute to the project (Angell, June 23, 2022). We need to be more active in commenting on these port expansion environmental assessments!
The Port of NY-NJ is also seeking to expand storage facilities for incoming shipping containers. Several sites are at various stages of consideration and development; one – part of the “Port Ivory” site on Staten Island – includes a tidal wetland. A November 2021 application by PANYNJ a change-in-use permit is under review by New York State Department of Environmental Conservation (NYSDEC) (Angell, May 27, 2022). Can those interested in environmental protection express their opposition?
The Port of Charleston is expected to finish dredging its inner harbor and channel this year. Last year, the Port of Virginia has received initial funding for a dredging project that should be completed by 2024 (Angell, May 27, 2022).
As we know, numerous tree-killing insects have been introduced from Asia to the ecologically similar forests of eastern North America – often in wood packaging. ALB in Charleston These include Asian longhorned beetle, emerald ash borer, redbay ambrosia beetle, phytophagous and Kuroshia shot hole borers (for profiles of each visit here). Indeed, 15 of 16 non-native bark beetles in the Xyleborini (a tribe of ambrosia beetles) detected in the United States since 2000 are from Asia (Bob Rabaglia, USFS Forest Health Protection, presentation at IUFRO meeting in Prague, September 2021).
Growing numbers of containers entering Atlantic and Gulf Coast ports raises the risk of additional introductions. Insects associated with imports from semi-tropical ports in Vietnam entering the U.S. through Gulf or southern Atlantic ports might well find these regions hospitable. I worry, for example, about the polyphagous and Kuroshio shot hole borers – surely the Gulf Coast provides a more suitable environment for insects from Vietnam and Taiwan than does southern California? And known hosts are present – box elder, willows, sweetgum, mimosa, tree of heaven …
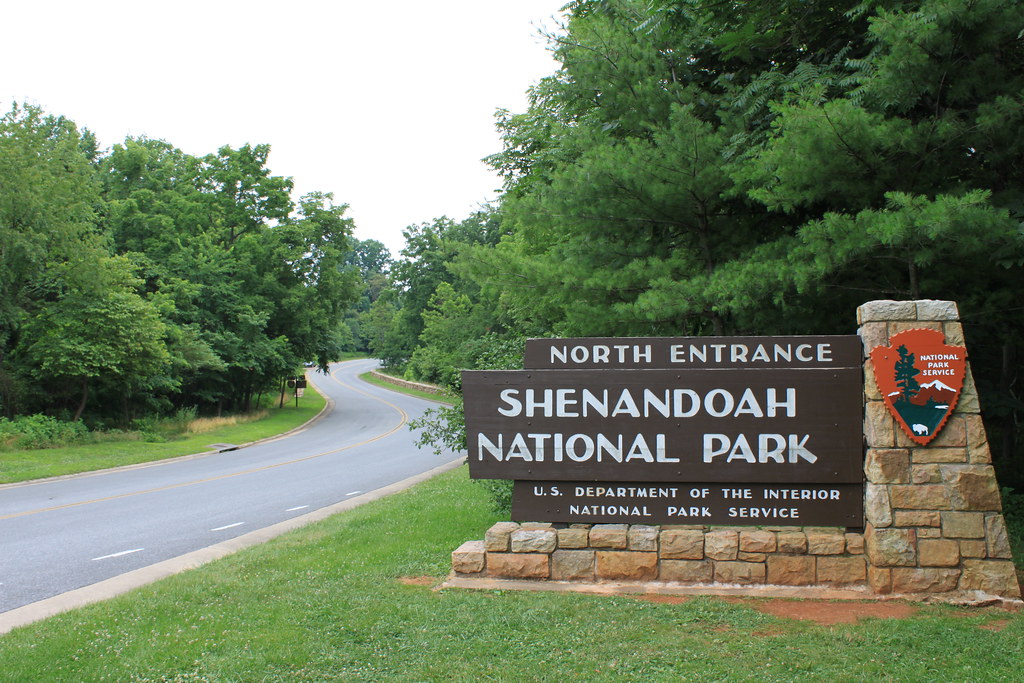
Of course, containers are then sent on from the ports to distribution centers – presenting opportunities for pest introductions in inland areas. New or expanded distribution centers include Atlanta and Appalachian Regional Port and Statesboro Airport in Georgia, Rocky Mount, North Carolina; Huntsville, Alabama; Portsmouth and Front Royal, Virginia (Ashe and Angell July 5, 2022). Front Royal is at the northern end of Shenandoah National Park!
photo by Daveylin via Flickr
European Trade
Meanwhile, U.S. imports from Europe continued at high levels – although they were not breaking records. In the first half of 2022, the U.S. imported just under 1.77 million TEU from Europe. The largest category of commodity from Northern Europe was foodstuffs — 410,930 TEU. Machinery and mechanical products imports – the type of good often associated with infested wood packaging – numbered 228,521 TEU. Vehicles, aircraft, and vessels imports were 107,526 TEU. “Miscellaneous manufactured articles” that include furniture, bedding, mattresses, and light fittings were 132,979 TEU. I expect – although the source does not so state – that this last category includes decorative stone and tile – again, a category often associated with infested wood packaging.
While fewer damaging pests have been introduced from Europe in recent decades, the risk remains.
Updated Haack Analysis
As has been documented repeatedly (e.g., my blogs, including 248), the current approach to curtailing pest introductions associated with wood packaging is not sufficiently effective. Customs officials continue to detect live quarantine pests in wood packaging as it enters the country. However, the exact level of this threat is unclear since the only assessment was based on data from 2009 (Haack et al., 2014). I eagerly await the results of Bob Haack’s updated analysis, which I hope will be published soon.
We welcome comments that supplement or correct factual information, suggest new approaches, or promote thoughtful consideration. We post comments that disagree with us — but not those we judge to be not civil or inflammatory.
For a detailed discussion of the policies and practices that have allowed these pests to enter and spread – and that do not promote effective restoration strategies – review the Fading Forests report at http://treeimprovement.utk.edu/FadingForests.htm
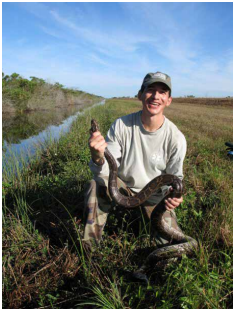
Burmese python in Everglades National Park; photo by Bob Reed, US FWS
Scientists continue to apply data collected in an international database (InvaCost; see “methods” section of Cuthbert et al.; full citation at end of this blog) to estimate the economic costs associated with invasive alien species (IAS). These sources reported $22.24 billion in economic costs of bioinvasion in protected areas over the 35-year period 1975 – 2020. Because the data has significant gaps, no doubt invasions really cost much more.
Moodley et al. 2022 (full citation at end of this blog) attempt to apply these data to analyze economic costs in protected areas. As they note, protected areas are a pillar of global biodiversity conservation. So it is important to understand the extent to which bioinvasion threatens this purpose.
Unfortunately, the data are still too scant to support any conclusions. Such distortions are acknowledged by Moodley et al. I will discuss the data gaps below a summary of the study’s findings.
The Details
Of the estimated $22.24 billion, only 4% were observed costs; 96% were “potential” costs (= extrapolated or predicted based on models). Both had generally increased in more recent years, especially “potential” costs after 1995. As is true in other analyses of InvaCost data, the great majority (73%) of observed costs covered management efforts rather than losses due to impacts. The 24% of total costs ascribed to losses, or damage, exceeded the authors’ expectation. They had thought that the minimal presence of human infrastructure inside protected areas would result in low records of “economic” damages.
The great majority (83%) of reported management costs were reactive, that is, undertaken after the invasion had occurred. In terrestrial environments, there were significantly higher bioinvasion costs inside protected areas than outside (although this varied by continent). However, when considering predicted or modelled costs, the importance was reversed: expected management costs represented only 5% while these “potential” damages were 94%.
Higher expenditures were reported in more developed countries – which have more resources to allocate and are better able to carry out research documenting both damage and effort.
More than 80% of management costs were shouldered by governmental services and/or official organizations (e.g. conservation agencies, forest services, or associations). The “agriculture” and “public and social welfare” sectors sustained 60% of observed “damage” and 89% of “mixed damage and management” costs respectively. The “environmental” and “public and social welfare” sectors together accounted for 94% of all the “potential” costs (predicted based on models) generated by invasive species in protected areas; 99% of damage costs. With the partial exception of the agricultural sector, the economic sectors that contribute the most to movement to invasive species are spared from carrying the resulting costs.
Lord Howe Island, Australia; threatened by myrtle rust; photo by Robert Whyte, via Flickr
Invasive plants dominated by numbers of published reports – 64% of reports of observed costs, 79% of reports of “potential”. However, both actual and “potential” costs allotted to plant invasions were much lower than for vertebrates and invertebrates. Mammals and insects dominated observed animal costs.
It is often asserted that protected areas are less vulnerable to bioinvasion because of the relative absence of human activity. Moodley et al. suggest the contrary: that protected areas might be more vulnerable to bioinvasion because they often host a larger proportion of native, endemic and threatened species less adapted to anthropogenic disturbances. Of course, no place on Earth is free of anthropogenic influences; this was true even before climate change became an overriding threat. Plenty of U.S. National parks and wilderness areas have suffered invasion by species that are causing significant change (see, for example, here, here, and here).
Despite Best Efforts, Data are Scant and Skewed
Economic data on invasive species in protected areas were available for only a tiny proportion of these sites — 55 out of 266,561 protected areas.
As Moodley et al. state, their study was hampered by several data gaps:
Taxonomic bias – plants are both more frequently studied and managed in protected areas, but their reported observed costs are substantially lower than those of either mammals or insects.
The data relate to economic rather than ecological effects. The costliest species economically might not cause the greatest ecological harm.
Geographical bias – studies are more plentiful in the Americas and Pacific Islands. However, studies from Europe, Africa and South America more often report observed costs. The South African attention to invasive species (see blogs here, here, and here), and economic importance of tourism to the Galápagos Islands exacerbate these data biases.
Methodological bias – although reporting bioinvasion costs has steadily increased, it is still erratic and dominated by “potential” costs = predictions, models or simulations.
I note that, in addition, individual examples of high-cost invasive species are not representative. The highest costs reported pertained to one agricultural pest (mango beetle) and one human health threat (mosquitoes).
Great Smokey Mountains National Park; threatened by mammals (pigs), forest pests, worms, invasive plants … Photo by Domenico Convertini via Flickr
As these weaknesses demonstrate, a significant need remains for increased attention to the economic aspects of bioinvasion – especially since political leaders pay so much greater attention to economics than to other metrics. However, the reported costs – $22.24 billion over 35 years, and growing! – are sufficient in the view of Moodley et al. to support advocating investment of more resources in invasive species management in protected areas, including – or especially – it is not quite clear — preventative measures.
SOURCES
Cuthbert, R.N., C Diagne, E.J. Hudgins, A. Turbelin, D.A. Ahmed, C. Albert, T.W. Bodey, E. Briski, F. Essl, P.J. Haubrock, R.E. Gozlan, N. Kirichenko, M. Kourantidou, A.M. Kramer, F. Courchamp. 2022. Bioinvasion cost reveals insufficient proactive management worldwide. Science of The Total Environment Volume 819, 1 May, 2022, 153404
Moodley, D., E. Angulo, R.N. Cuthbert, B. Leung, A. Turbelin, A. Novoa, M. Kourantidou, G. Heringer, P.J. Haubrock, D. Renault, M. Robuchon, J. Fantle-Lepczyk, F. Courchamp, C. Diagne. 2022. Surprisingly high economic costs of bioinvasions in protected areas. Biol Invasions. https://doi.org/10.1007/s10530-022-02732-7
Posted by Faith Campbell
We welcome comments that supplement or correct factual information, suggest new approaches, or promote thoughtful consideration. We post comments that disagree with us — but not those we judge to be not civil or inflammatory.
For a detailed discussion of the policies and practices that have allowed these pests to enter and spread – and that do not promote effective restoration strategies – review the Fading Forests report at http://treeimprovement.utk.edu/FadingForests.htm
Kew Gardens U.K., home to Botanic Gardens Conservation International; Wikipedia
A massive international effort has completed a “Global Tree Assessment: State of Earth’s Trees”. This is the result of five years’ effort; it aims at a comprehensive assessment of the conservation status of all the Earth’s trees. As a result of their work, the authors issue a call to action and include specific recommendations.
The leads were the Botanic Gardens Conservation International (BGCI) and International Union for Conservation of Nature’s (IUCN) Species Survival Commission (SSC) Global Tree Specialist Group. They were assisted by about 60 cooperating institutions and more than 500 individual experts. The Morton Arboretum was a major U.S. contributor. Here, my focus is on the global assessment. An accompanying blog contains my analysis of reports on the Morton Arboretum report for the U.S.
The Global Tree Assessment is the largest initiative in the history of the IUCN Red List process. (This process is described in Box 3 of the report, on p. 12; and on p. 40.) As of the end of 2020, IUCN Red List assessments evaluated 28,463 tree species, representing half of all known tree species. Organizers hope to complete comprehensive conservation assessments of all tree species for inclusion on the IUCN Red List by 2023. Other sources utilized included draft Red List profiles and national-level assessments of those species that are found in only one country.
SUMMARY OF FINDINGS
Using these sources, the Global Tree Assessment evaluated 58,497 tree species worldwide. The study determined that 30% are threatened with extinction. This number could change significantly if a large proportion of the 7,700 species (13.2%) recorded as “Data Deficient” turn out to be at risk. At least 142 species are recorded as already extinct in the wild. Two-fifths (41.5%) are considered to be not at risk. Detailed species’ evaluations are provided at GlobalTreeSearch or GlobalTree Portal.
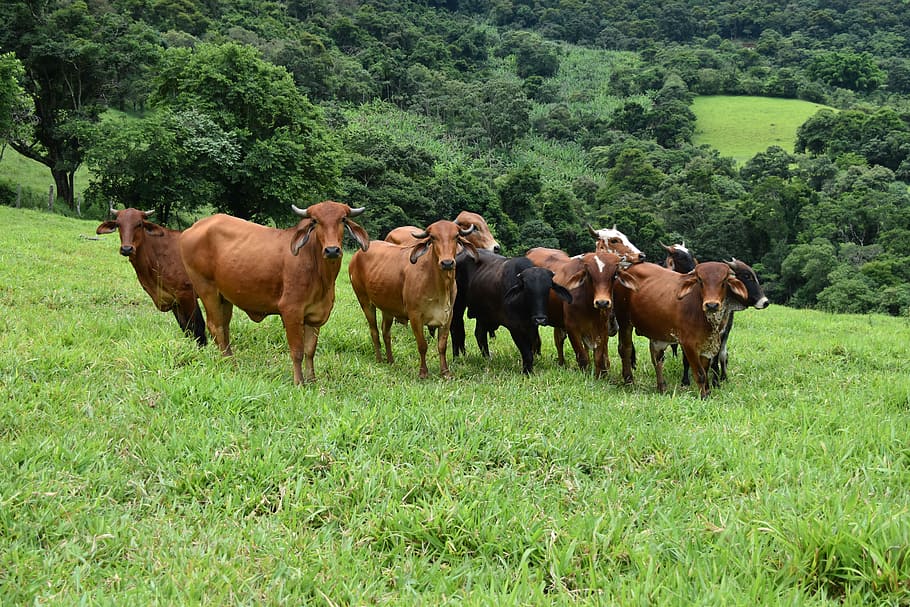
Brazilian forest converted to cattle pasture
The principal threats to trees globally are forest clearance and other forms of habitat loss (at least 65% of species) and direct exploitation for timber and other products (27% or more). The spread of non-native pests is said to affect 5% of the species.Climate change is having a measurable impact on 4% of the species and is expected to increase. (The situation in the United States differs significantly. Overexploitation plays almost no role and on-going habitat loss is important for only a few of the at-risk species.)
The authors decry the lack of attention, historically, to tree endangerment given trees’ ecological, cultural and economic importance. They hope that increased attention to the biodiversity crisis — an estimated 1 million animal and plant species threatened with extinction — and trees’ importance as carbon sinks will lead to increased conservation of trees and forests. They warn, however, that tree-planting programs must put the right species in the right place, including utilizing species that are under threat. In other words, tree planting practices need to change. They note that a community of botanists and conservationists is ready to assist.
Centers of tree species diversity – and of species under threat – are in Central and South America, followed by the other tropical regions of Southeast Asia and Africa. Fifty-eight percent of tree species are single country endemics. The highest proportion of endemism is found in New Zealand, Madagascar and New Caledonia. The region with the highest proportion of native tree species under threat is tropical Africa, especially Madagascar. The highest numbers of species “Not Evaluated” or “Data Deficient” are in IndoMalaya (tropical Asia) and Oceania. In those regions, about a third of species fall in one of those categories.
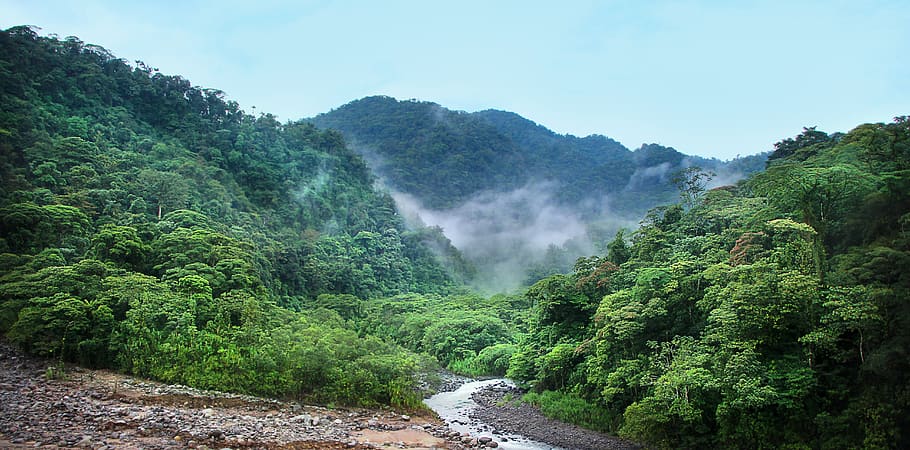
forest in Central America
The assessment authors fear ecosystem collapse caused by major, large-scale disturbance events. Examples are recent unprecedented fires in California, southern Australia, Indonesia, and the Amazon (although they don’t mention Siberia). They also note mass mortality events over large areas of forest caused by other factors, including drought and heat stress and the increased incidence of pests. These events have led to a worrying decline of dominant tree species currently evaluated as “Least Concern.” Citing a 2010 report, they list as examples spruce in Alaska, lodgepole pine in British Columbia, aspen in Saskatchewan and Alberta, and Colorado pinon pine (Pinus edulis) in the American southwest.
The authors emphasize the importance of preventing extinction of monotypic tree families. Such events would represent a disproportionate loss of unique evolutionary history, biological diversity, and potential for future evolution. Of the 257 plant families that include trees, 12 are monotypic. They are scattered around the tropics and former Gondwanaland; none is found in the Neo- or Paleoarctic regions. While extinctions to date have rarely affected plants above the rank of genus, the global assessment authors worry that the on-going sixth extinction wave might result in extinctions at the genus or family level.
In this context, the assessment made a particular effort to evaluate the status of species representing the survival of Gondwanian Rainforest lineages. They found that 29% of these tree species are threatened with extinction. Two case studies focus on Australia. They mention habitat conversion but not two non-native pathogens widespread in Australia, Phytophthora cinnamomi andAustropucciniapsidii.
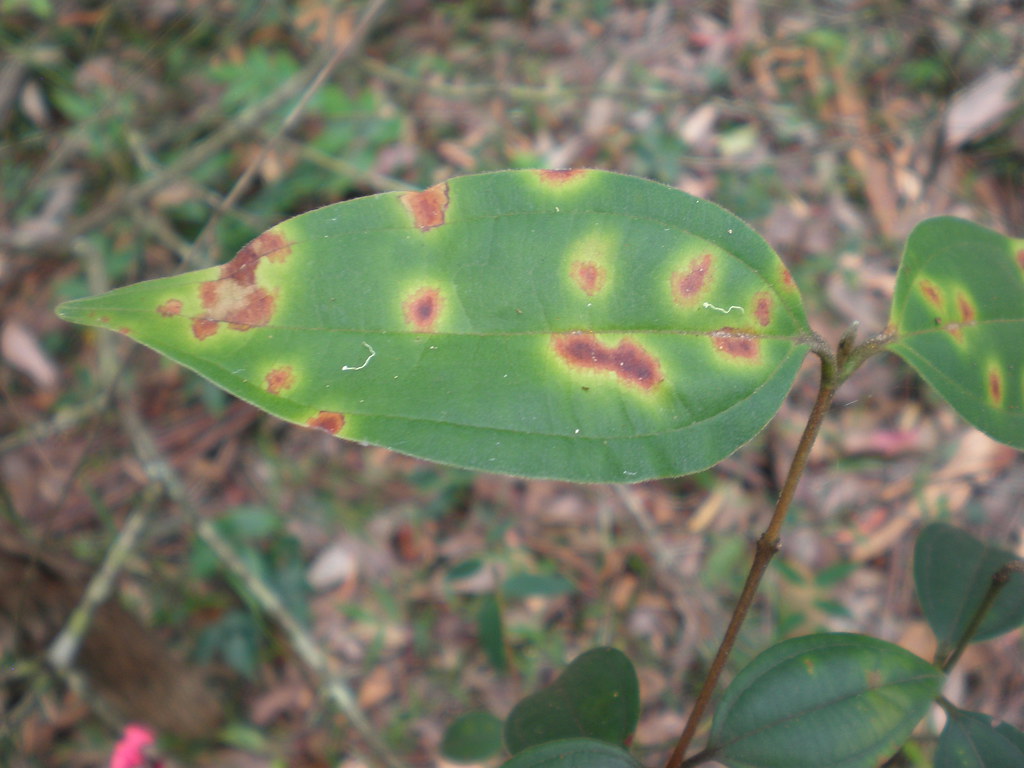
formerly common, now endangered, Australian tree Rhodamnia rubescens, infected by Austropuccinia psidii; photo courtesy of Flickr
The proportion of total tree diversity designated as threatened is highest on island nations, e.g., 69% of the trees on St. Helena, 59% of the trees on Madagascar, 57% of the trees on Mauritius. Hawai`i is not treated separately from the United States as a whole. According to Megan Barstow of BGCI (pers. comm.), the just updated IUCN Red List includes 214 threatened tree species in Hawai`i.
[For the U.S. overall, the IUCN reports 1,424 tree species, of which 342 (24%) are considered threatened. In the companion U.S. assessment, the Morton Arboretum and collaborators found that 11% of 841 continental U.S. tree species are threatened.]
MAIN THREATS TO TREES
Habitat loss
Over the past 300 years, global forest area has decreased by about 40%. Conversion of land for crops and pasture continues to threaten more tree species than any other known threat. Additional losses are caused by conversion for urban and industrial development and transport corridors, and by changes in fire regimes. In total, these factors cumulatively threaten 78% of all tree species, 84% if one includes conversion to wood plantations.
Caribbean mahogany (Swietenia mahogani); photo by Miguel Vieria
Forest Exploitation
Exploitation, especially for timber, is the second greatest threat globally, affecting 27% of tree species (more than 7,400 tree species). The report focuses on centuries of harvest of valuable tropical timbers and exploitation for fuelwood, with an emphasis on Madagascar, where nearly half of all tree species (117 out of 244 tree species) are threatened.
Pests and diseases
Tree species are impacted by a wide range of pests and diseases that are spread by natural and artificial causes. Invasive and other problematic species are recorded as threats for 1,356 tree species (5%) recorded on the IUCN Red List. This figure might be low because some of the information is outdated (see my discussion of American beech in the companion blog about the North American report, here.) Also, climate change is altering the survival opportunities for many pests and diseases in new environments. The example given is the ash genus (Fraxinus), under attack by not only the emerald ash borer in North America and now Russia and Eastern Europe but also the disease Ash Dieback across Europe. The report refers readers to the International Plant Sentinel Network for early warning system of new and emerging pest and pathogen risks, as well as help in coordinating responses.
black ash (Fraxinus nigra) swamp; Flickr
Climate Change
Climate change is impacting all forest ecosystems and is emerging as a significant recorded threat to individual tree species. In the IUCN Red List assessments, climate change and severe weather is recorded as a threat in 1,080 (4%) cases. Trees of coastal, boreal and montane ecosystems are disproportionately impacted. The authors note that the actual impact of climate change is probably more widespread, as it is also impacting fire regimes and the survival, spread, and virulence of pests.
CURRENT CONSERVATION EFFORTS
In Protected areas
Currently, 15.4% of the global terrestrial surface has formal protection status. The IUCN study authors recognize in situ conservation of trees through protection of existing natural habitats as the best method for conserving tree diversity. It is therefore encouraging that at least 64% of all tree species are included in at least one protected area. However, representation is higher for species that are not threatened – 85% are represented in a conservation area while only 56% of threatened trees species are. Nor does the report assess the effectiveness of protection afforded by the various in situ sites. The authors express hope that the parallel IUCN Red List of Ecosystems will contribute to understanding of the efficacy of conservation efforts targetting forests.
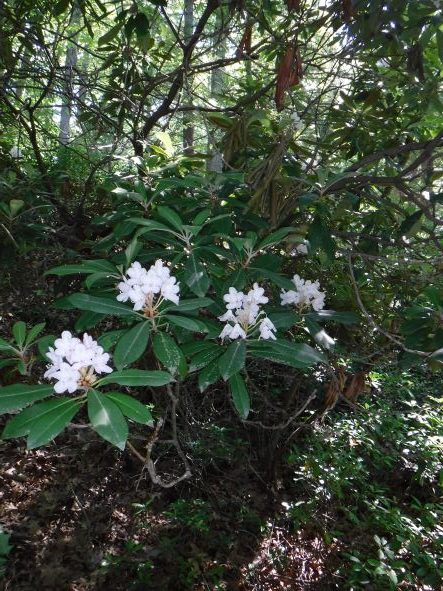
The Global Trees Campaign is a joint initiative of Fauna & Flora International (FFI) and BGCI. Since 1999 the campaign has worked to conserve more than 400 threatened tree species in more than 50 countries. The current focus is on six priority taxa = Acer, Dipterocarps, Magnolia, Nothofagus, Oak, and Rhododendron.
Rhododendron in Cook Forest State Park, PA; photo by F.T. Campbell
In Botanic gardens and seed banks
Especially for species under threat, conservation outside their native habitat – ex situ conservation – is an essential additional component. Currently 30% of tree species are recorded as present in at least one botanic garden or seed bank. Again, representation is higher for species that are not threatened – 45% are represented compared to only 21% of threatened tree species. For 41 species, ex situ conservation provides the only hope of survival, since they are extinct in the wild.
AN URGENT CALL FOR ACTION
The authors and collaborators who prepared the Global Tree Assessment hope that this report will help prompt action and better coordination of priorities and resources to better ensure that all tree species are supported by in situ conservation sites and by appropriate management plans. They state several times the importance of restoration plantings relying on native species. The purpose of plantings needs to include conservation of biological diversity, not just accumulation of carbon credits. The Ecological Restoration Alliance of Botanic Gardens (https://www.erabg.org/) is demonstrating that forest restoration can benefit biodiversity conservation. In many cases, propagation methods need to be developed. Also, projects must include aftercare and monitoring to ensure the survival of planted seedlings.
The IUCN assessment notes that ex situ conservation is an important backup. Education, capacity-building and awareness-raising are needed to equip, support, and empower local communities and other partners with the knowledge and skills to help conserve threatened trees.
Policy
The report say it does not address policy and legislation – a gap that fortunately is not quite true. The report both summarizes pertinent international agreements but also provides specific recommendations.
The international agreements that pertain to tree and forest conservation include:
Convention on Biological Diversity (CBD) and several specific programs: the Forestry Programme, Protected Area Programme and Sustainable Use Programme.
Global Strategy for Plant Conservation (GSPC), which is now developing post-2020 targets.
United Nations Framework Convention on Climate Change (UNFCCC) and countries’ implementing pledges to conserve carbon sinks, e.g., REDD+ (Reducing Emissions from Deforestation and Forest Degradation)
United Nations Strategic Plan for Forests 2017-2030
Global Plan of Action for the Conservation and Sustainable Use of Forest Genetic Resources
Convention on International Trade in Endangered Species, which currently protects 560 tree species, including 308 of the most threatened timbers
The report also mentions the voluntary New York Declaration on Forests, under which more than 200 entities – including governments, businesses, and Indigenous communities — have committed to eliminating deforestation from their supply chains. The supply chains touched on include those for major agricultural commodities, production of which is one of the greatest threat to trees.
SPECIFIC RECOMMENDATIONS
1. Strengthen tree conservation action globally through the formation of a new coalition that brings together existing resources and expertise, and applies lessons from the Global Trees Campaign to radically scale up tree conservation.
2. Use information in the GlobalTree Portal on the conservation status of individual tree species and current conservation action to plan additional action at local, national, and international levels, and for priority taxonomic groups. Build on the Portal by strengthening research on “Data Deficient” tree species, and collating additional information threatened species to avoid duplication of efforts and ensure conservation action is directed where it is needed most.
3. Ensure effective conservation of threatened trees within the protected area network by strengthening local knowledge, monitoring populations of threatened species and, where necessary, increasing enforcement of controls on illegal or non-sustainable harvesting of valuable species. Extend protected area coverage for threatened tree species and species assemblages that are currently not well-represented in protected areas.
4. Ensure that all globally threatened tree species are conserved in well-managed and genetically representative ex situ living and seed bank collections, with associated education and restoration programs.
5. Align work with the UN Decade on Ecosystem Restoration 2021–2030, engaging local communities, government forestry agencies, the business community, and other interested parties to ensure that the most appropriate tree species, including those that are threatened, are used in tree planting and restoration programs.
6. Improve data collection for national inventory and monitoring systems and use this information to reduce deforestation in areas of high tree diversity in association with REDD+ and Nationally Determined Contributions (NDCs).
7. Increase the availability of government, private and corporate funding for threatened tree species, and ensure that funding is directed to species and sites that are in greatest need of conservation.
SOURCE
Global Tree Assessment State of Earth’s Trees September 2021 Botanic Gardens Conservation International available here
Posted by Faith Campbell
We welcome comments that supplement or correct factual information, suggest new approaches, or promote thoughtful consideration. We post comments that disagree with us — but not those we judge to be not civil or inflammatory.
For a detailed discussion of the policies and practices that have allowed these pests to enter and spread – and that do not promote effective restoration strategies – review the Fading Forests report at http://treeimprovement.utk.edu/FadingForests.htm
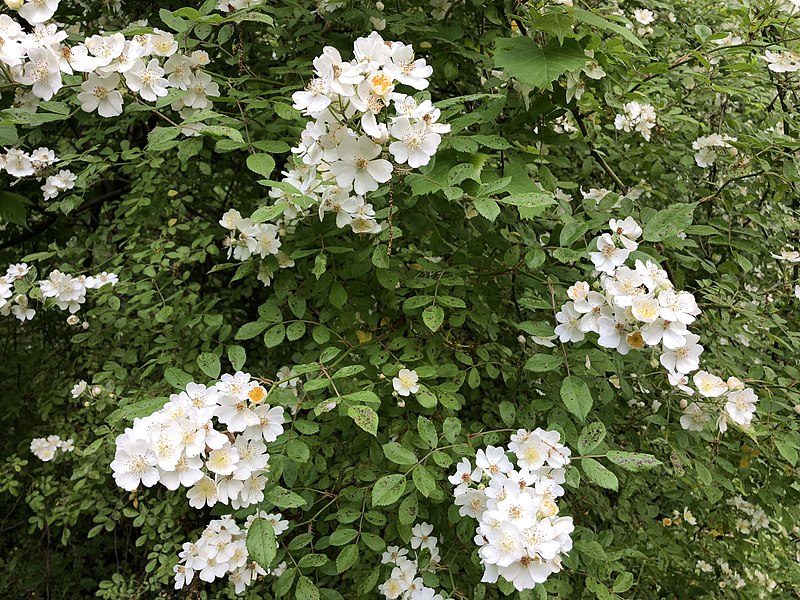
It’s everywhere! multiflora rose (photo by Famartin)
The United States is overrun with introduced plants. Five years ago, Rod Randall’s database listed more than 9,700 non-native plant species as naturalized in the U.S. Not all of these species were “invasive”.
At that time, regional invasive plant groups listed the following numbers of invasive species in their regions:
Southeast Exotic Plant Pest Council – approximately 400 invasive plants
Mid-Atlantic Invasive Plants Council – 285 invasive plants
Midwest Invasive Plants Network reported that state agencies or state-level invasive plant councils in its region listed more than 270 plant species as invasive, noxious, or pest species
California Invasive Plants Council listed 208 species.
Texas Invasives reported more than 800 non-native plant species in the state, of which 20 were considered invasive.
Species – Rankings and Extents
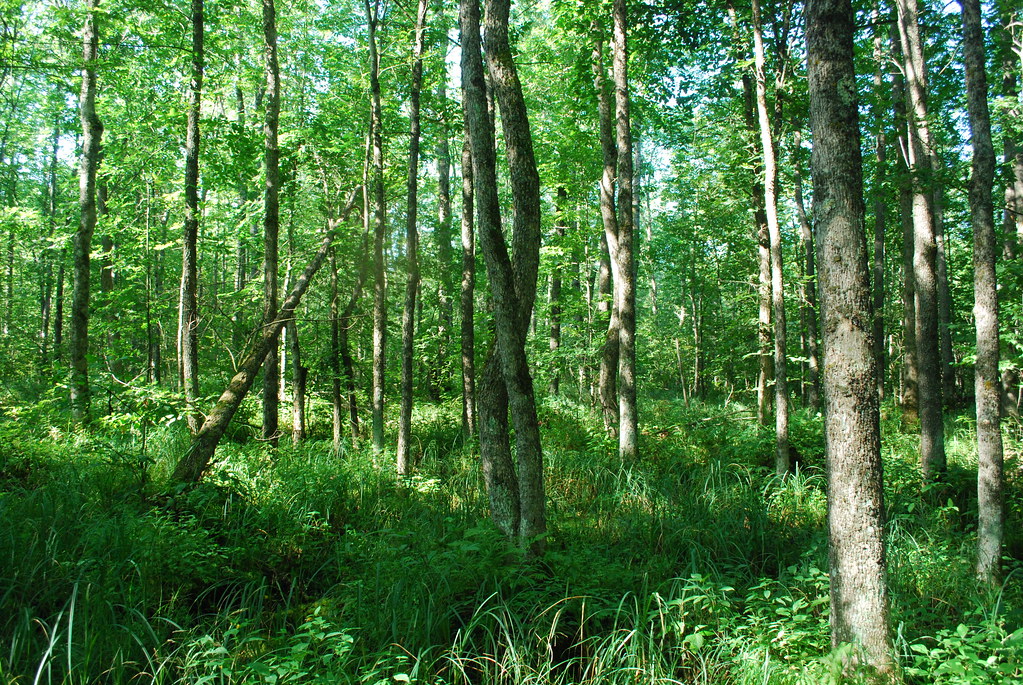
We know that these invaders are affecting wide swaths of many ecosystems. A recent study based on Forest Inventory and Analysis (FIA) data (explained here) showed that nation-wide, 39% of forested plotssampled contained at least one invasive species. Hawai`i was first, at 70%. Eastern forests were second, at 46%. In the West overall, 11% of plots contained at least one invasive species. Plots in both Alaska and the Intermountain states were at 6% of plots invaded. A different study (Barrett and Robertson 2021; full citation at end of blog) reported the proportion of Western forest covered by invasive plants. This approach resulted in different numbers, but the same general ranking: Hawai`i again “led” at 46%; Pacific Coast states at 3.3%; Rocky Mountain states at 0.75%; coastal Alaska at 0.01%.
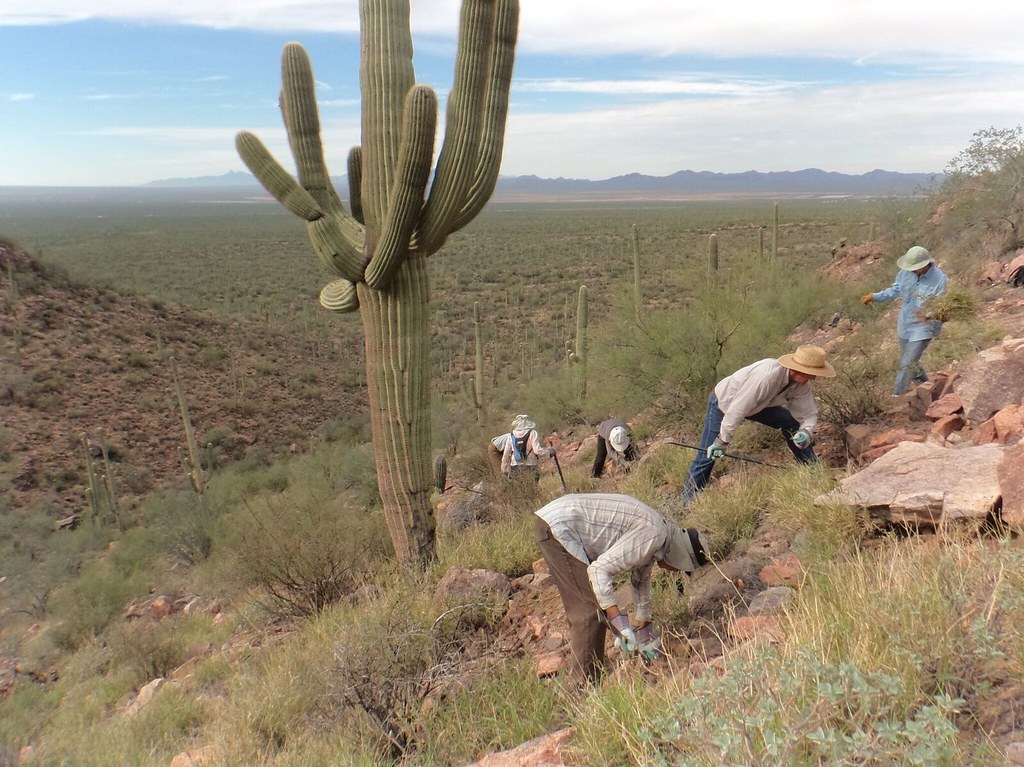
In more arid regions, data from the Bureau of Land Management showed that invaded acreage had more than doubled between 2009 and 2015.
buffelgrass removal in Tucson; Photo by Julia Rowe, Arizona Sonora Desert Museum
The situation is expected to get worse: a study of just one small portion of U.S. naturalized plants found that non-native plant species were more widely distributed than native species and that the average invasive plant inhabited only about 50% of its expected range. Furthermore, human actions were more important in facilitating spread than the species’ biological attributes.
Most of the detailed studies have been conducted in the Northeast – by both Forest Service and National Park Service scientists. The USFS’ Northern Region (Region 9) contains 24 states, from Maine to Minnesota, from Delaware to Missouri. A review of forest inventory (FIA) data (Oswaltet al. 2015) provided details on 50 plant species. (Unfortunately, the Southern Region [Region 8] has chosen to report in different formats, so it is hard to get an overall picture of invasive plants throughout the forests of the entire East. This is especially annoying to those of us who live in Mid-Atlantic states, which are divided between the two regions.)
Oswalt et al. (2015) provided data on the percentage of FIA plots in each state that were reported to have at least one invasive plant species. The northern Midwest ranked highest – e.g., one state (Ohio) at 93%; one state (Iowa) at 81%; two states (Indiana and Illinois) above 70%. Parts of the Mid-Atlantic region were almost as invaded – West Virginia at 79% and Maryland at 65%. The Northern plains states ranked lowest in invasions – North Dakota at 29% and South Dakota at 15%.
A study by the National Park Service of part of the Northeast (from Virginia and West Virginia to Maine) found a situation similar to that found by USFS researchers. In 35 of 39 park units, more than half of the plots had at least one invasive plant species when the 2015-2018 survey began. In 10 parks (a quarter of those surveyed), every plot had at least one. Invasions are worsening: 80% of the park units showed there was a significant increase in at least one trend measuring abundance.
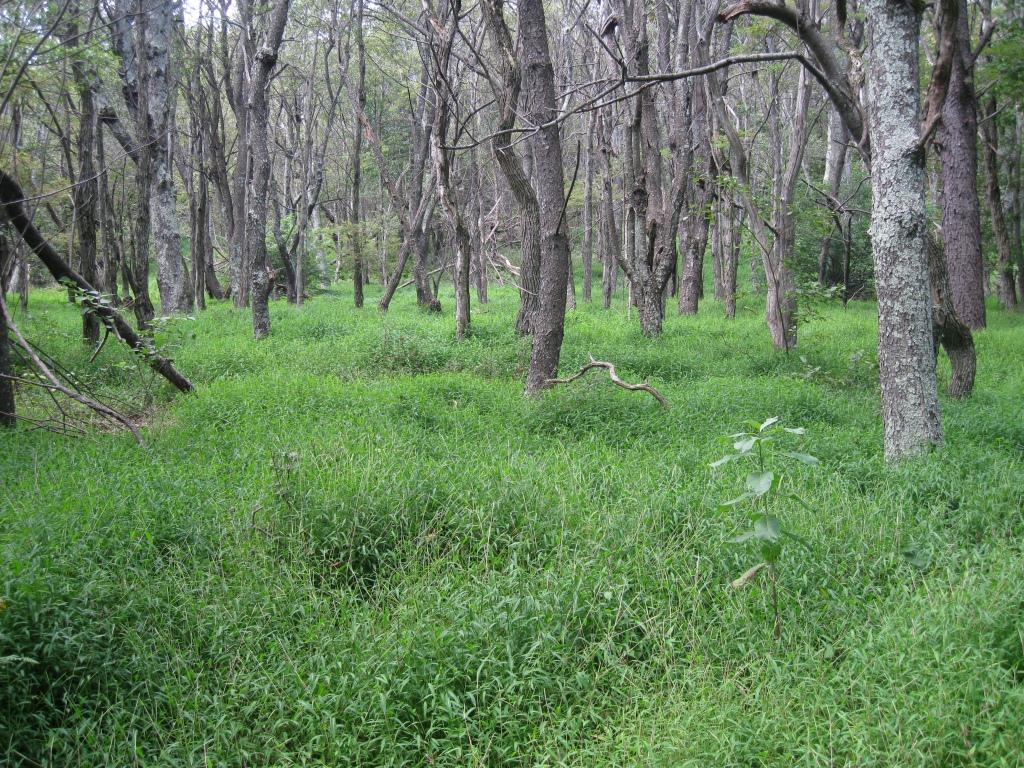
Japanese stiltgrass in Shenandoah National Park; Photo by J. Hughes
The USFS and NPS report different species to be most widespread. In the National Park Service-managed units, Japanese stiltgrass (Microstegium vimineum) was found on 30% of all plots, in more than 75% of all NPS-managed units in the study. This magnitude comes despite the species not being found north of 41o N latitude. In forest plots inventoried by the USDA Forest Service, Japanese stiltgrass was the 14th most widespread species in the Northern region. I speculate that the species might not be common in the upper Midwest, which was not included in the NPS study. Oswalt et al. (2015) noted that Japanese stiltgrass was the 5th most common invasive plant in the Southern region.
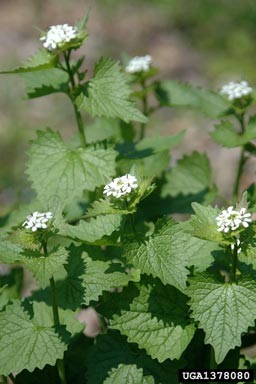
Both studies agreed that garlic mustard (Alliaria petiolata) is widespread. The NPS study found it to be the most frequently detected non-grass herbaceous species, detected in 20% of plots throughout the study area (Virginia and West Virginia to Maine). On forest plots monitored by the USFS, garlic mustard was the 3rd most frequently detected species, on 4.5% of the surveyed plots. The species is reported to be present in 36 states & 5 provinces.
Why do Studies Ignore Deliberate Planting as a Factor?
Both USFS & NPS found shrubs and vines to be highly widespread. NPS specified Japanese barberry (Berberis thunbergii), Japanese honeysuckle (Lonicera japonica), multiflora rose (Rosa multiflora), and wineberry (Rubus phoenicolasius). USFS FIA data showed multiflora rose to be the most frequently recorded invasive plant, present on 16.6% of surveyed plots. It is otherwise recorded in 39 states and 5 provinces. Multiflora rose is almost ubiquitous in some states; in Ohio it is recorded on 85% of the plots. “Roses” were reported to be the 3rd most common invasive plant in the Southern Region. Other shrubs also dominated FIA plot detections: European buckthorn was 4th most frequently detected species, present on 4.4% of survey plots; or in 34 states and 8 provinces. Its presence is highest in New York, at 16.8% of plots. If the plots invaded by the various bush honeysuckle species do not overlap, these shrubs occupy 9.5% of all surveyed plots – second to multiflora rose. The vine Japanese honeysuckle ranked 6th – present on 3.6% of survey plots across the region. Japanese honeysuckle is reported to be the most common invasive plant in the Southern region. Other shrubs ranking 12th or above included Autumn olive and Japanese barberry
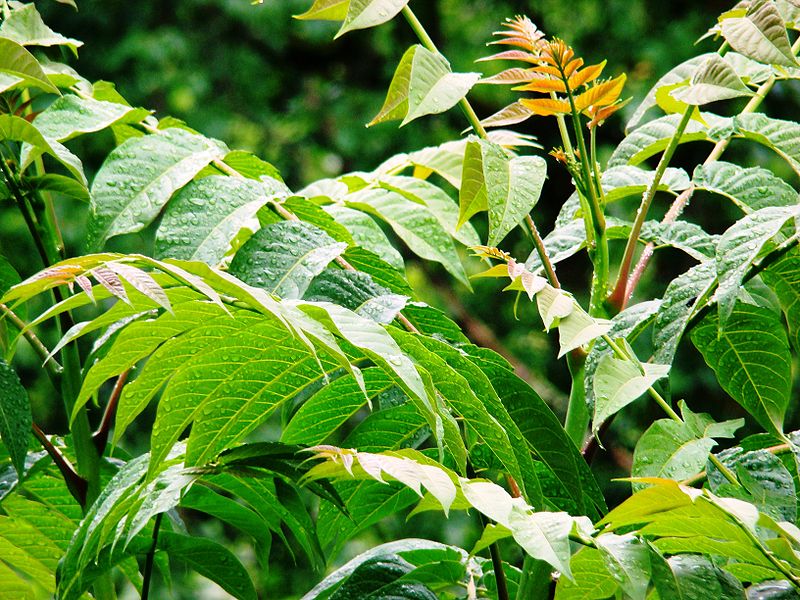
Tree-of-heaven (Ailanthus altissima) was the most common invasive tree found in National parks, again, despite not growing north of 41o N latitude. It is found in 9% of plots.
Ailanthus
I will say that I find it extremely annoying that the scientists carrying out these studies never mention that virtually all these shrub species had been deliberately planted in forests or nearby lands! Instead, they focus on such factors as histories of agriculture and other disturbances and fragmentation. It is well documented (e.g., Lehan et al. 2013) that the vast majority of shrub species introduced to the U.S. were introduced deliberately. Furthermore, more than 500 plant species invasive in some region are being sold on-line globally.
Deliberate planting of species that turn out to be invasive is also rarely recognized in the West, e.g., Pearson et. al. There, the motivation for planting might be livestock forage or erosion control rather than wildlife habitat “enhancement” or ornamental horticulture.
I am pleased that the most recent study (Barrett and Robertson 2021) differs somewhat by noting (sometimes) both invasions by forage grasses and the appearance in the mesic forests of Pacific states such planted species as Armenian blackberry. However, while this report notes the potential that pathogens might be transported to new areas by restoration planting and “assisted migration”, it does not mention the concomitant risk of introducing plant species that might prove invasive in the naïve ecosystems.
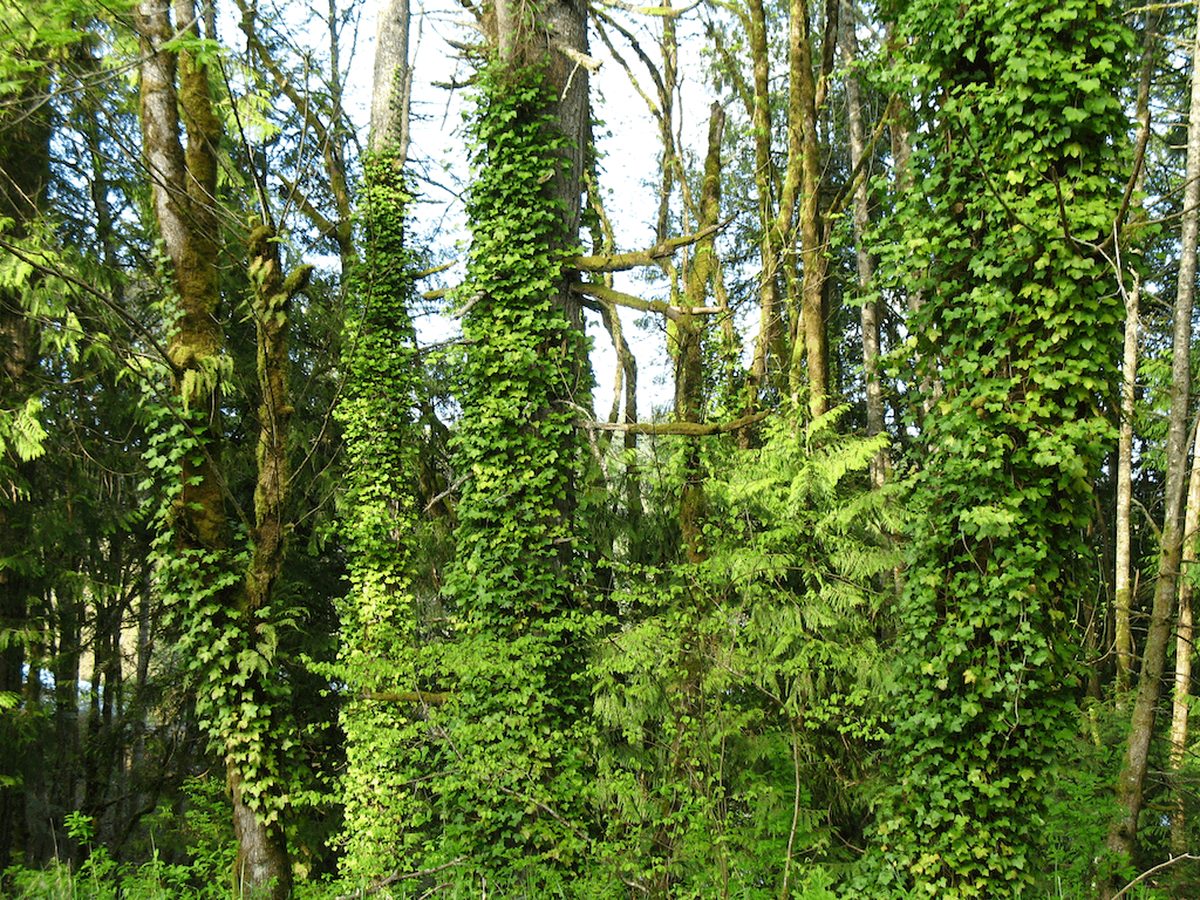
English ivy invading forest in Washington State; photo from Washington Noxious Weed Board
[Go to the earlier blogs linked here and the Western forests report for discussions of management strategies.]
Barrett and Robertson (2021) state that although invasive plants are increasing in extent and intensity in Western forests, they are usually considered to be contributing factors rather than as proximate causes. However, they note two caveats: 1) determining the ultimate causes and resulting implications of these recent increases is more difficult; and 2) data are particularly poor on plant species’ presence. Indeed, the FIA survey process link is ineffective for early detection and tactical monitoring [that is, identifying particular species in specific habitats of concern] of plant invasions.
Of the 23.4 M ha of forested lands that have experienced a disturbance over a five-year window (the time frame for FIA), only 600,000 ha was affected by the combined categories of geologic, vegetation, and other disturbances. (This is 10% of the area affected by either insects or pathogens.) Cheatgrass (Bromus tectorum) was by far the most abundant species in Western forests, covering 480,000 ha, or about 0.49%cover of all forested land in the conterminous Western United States. Because of the difficulties of surveying, Barrett and Robertson (2021) conclude that the area covered by IAS plants on the Pacific Coast and Rocky Mountains could be twice recorded values.
FIA surveys detected the highest number of non-native plant species in the forests of the continental Pacific states — 259 species. Many were grasses (although different species than in the Rockies), but shrubs and other forbs were also present. In the Rocky Mountain states the surveys detected a total of 195 non-native species, primarily grasses. FIA surveys in Hawai`i detected 136 non-native species. The most abundant was strawberry guava, which was detected on 9% of the forested area in the state. Surveys of FIA plots in coastal Alaska detected only 8 non-native plant species; common dandelion was the most abundant. Except in Hawai`i, the plants were expected to have substantially lower impacts than in eastern forests.
I note that the US Geological Service (Simpson and Eyler, 2018) reports there are approximately 1,754 non-native plants in Hawai`i and 424 in Alaska. Not all are necessarily invasive. And the USGS study covered all of Alaska, not just the southeastern coastal region.
Barrett and Robertson (2021) found that plant invasions are less extensive in older forest stands, mesic stands in contrast to drier areas and those with sparse or open tree canopies, and farther from roads. Thus, invasive plant cover was higher in hardwood and low-elevation and dry conifer forest types than in high-elevation and moist conifer types. In Hawai`i, mean plant cover was more than 40 % in all forest types except cloud forest, where it was 7.8 %. Again, proximity to roads was mentioned in the context of the likelihood of disturbance but no mention was made of the fact that households and businesses (e.g., tourist facilities, even agency facilities!) might deliberately introduce plants – e.g., horticulture.
Barrett and Robertson (2021) expect the impacts of NIS plants on forest lands to increase in the future, due to both additional introductions (despite efforts to prevent such) and spread of established species. They note that every disturbance creates an opportunity for the many ruderal and graminoid species to establish – facilitated by their abundance nearby. They note the significant challenge presented by secondary invaders, which often respond to space made available by “weed control” projects better than natives.
I welcome their concern about shade-tolerant plants apparently increasing in wetter areas of the Pacific coast states. They note that the presence of non-native plants in a forest is less obvious, and the impacts might be more subtle, perhaps primarily affecting tree regeneration through competition or other effects (e.g., promoting fire). Barrett and Robertson (2021) note that many of the shade-tolerant non-native species abundant in temperate Eastern U.S. forests (e.g., garlic mustard) are present in the West and are likely to become important.
SOURCES
Barrett, T.M. and G.C. Robertson, Editors. 2021. Disturbance and Sustainability in Forests of the Western US. USDA Forest Service Pacific Northwest Research Station. General Technical Report PNW-GTR-992
March 2021
Simpson, A., and Eyler, M.C., 2018, First comprehensive list of non-native species established in three major regions of the United States: U.S. Geological Survey Open-File Report 2018-1156, 15 p., https://doi.org/10.3133/ofr20181156.
ISSN 2331-1258 (online)
Posted by Faith Campbell
We welcome comments that supplement or correct factual information, suggest new approaches, or promote thoughtful consideration. We post comments that disagree with us — but not those we judge to be not civil or inflammatory.
For a detailed discussion of the policies and practices that have allowed tree-killing pests to enter and spread – and that do not promote effective restoration strategies – review the Fading Forests report at http://treeimprovement.utk.edu/FadingForests.htm (These reports do not discuss invasive plants.)
Posted by Scott J. Cameron, former Acting Assistant Secretary for Policy Management and Budget , US Department of the Interior
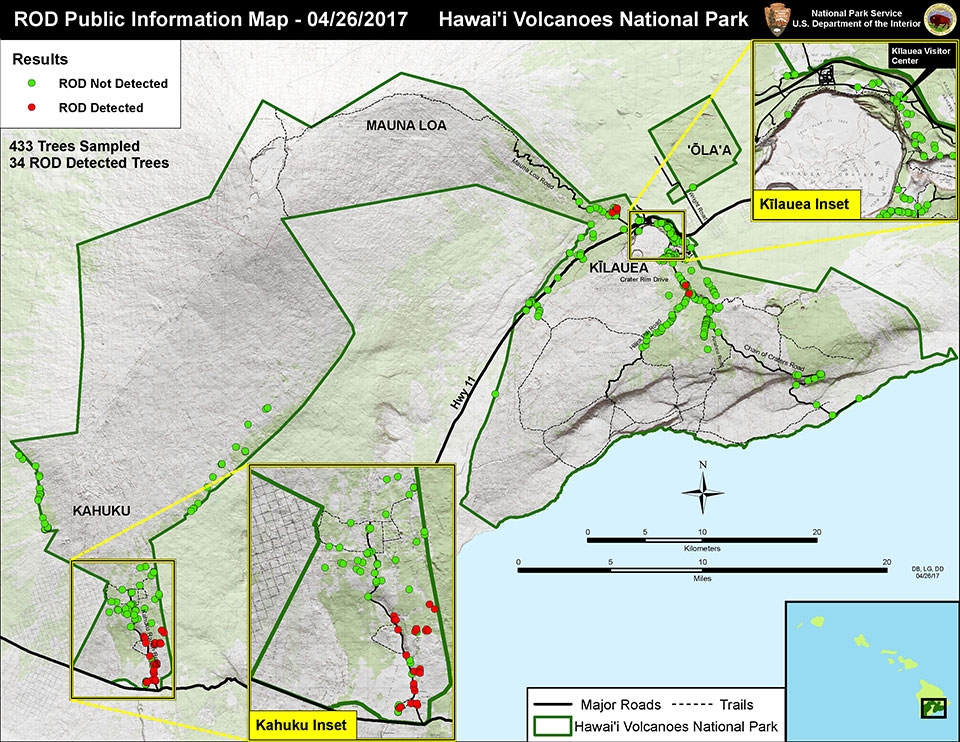
locations in Hawaii Volcanoes National Park where ohia trees were infected by rapid ohia death pathogen in 2017
In 2019 Congress passed the John D. Dingell, Jr. Conservation, Management, and Recreation Act. Among other things, it directed the Department of the Interior to “develop a strategic plan that will achieve, to the maximum extent practicable, a substantive annual net reduction of invasive species population or infested acreage on land or water managed by the Secretary.” This provision triggered a year-long process of public involvement and inter-bureau coordination. The result was a plan published in January 2021. It represents the first attempt by Interior at a Department-wide multi-taxa, multi-year approach to invasive species. It has the potential to spur integration of invasive species work across the Department’s many bureaus and to focus each bureau’s efforts on a set of common goals, strategies, and performance metrics.
While Congress’ language is open-ended, any planning exercise is constrained by the most recent President’s budget and existing law. It is up to those of us who are not, or at least no longer, executive branch employees to advocate for plans unbound by those constraints.
In that spirit, I offer eight recommendations to improve invasive species management. Four are within existing authorities; four more are outside the current budgetary and statutory framework. Many more ideas are without a doubt worth pursuing.
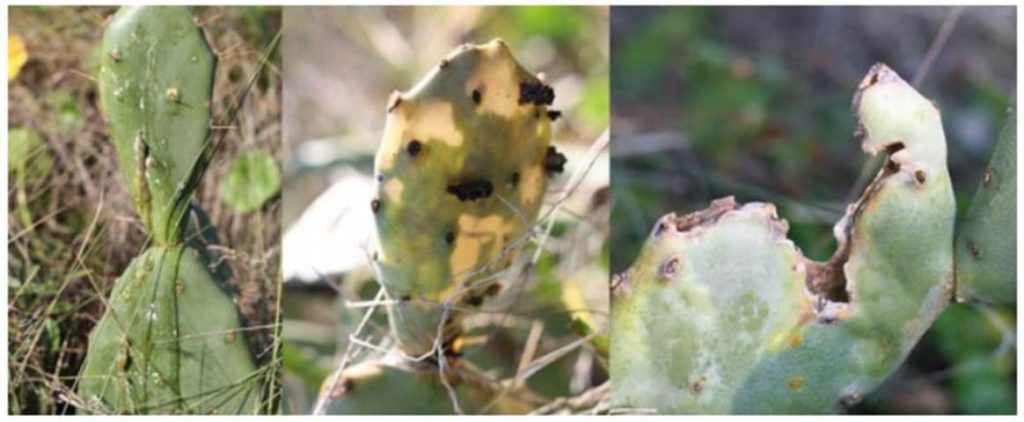
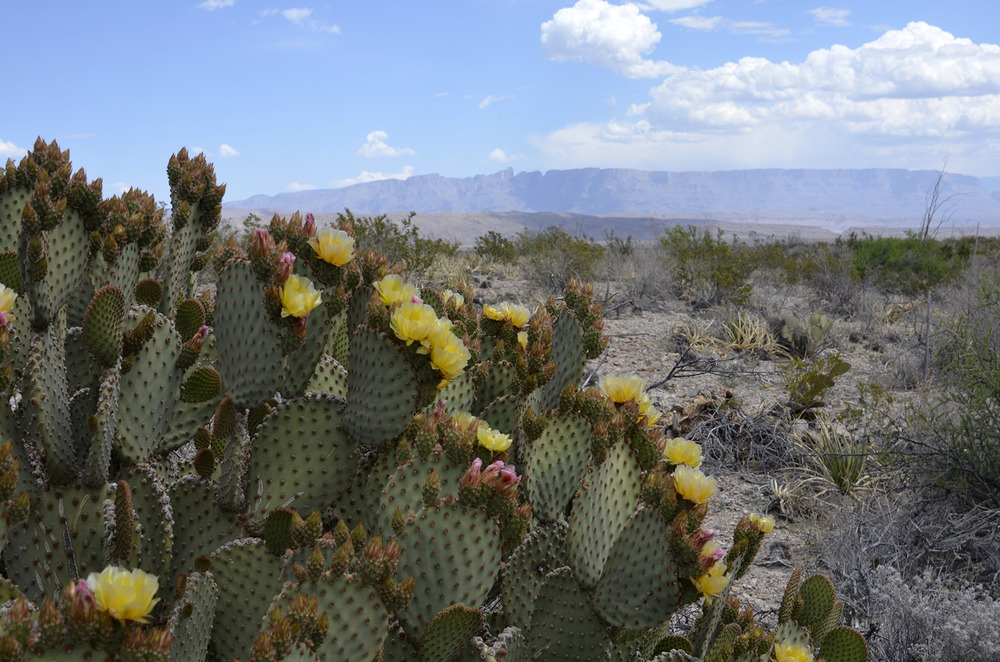
Opuntia (prickly pear) cactus – common plant in western National parks and on Bureau of Land Management lands; under threat by cactus moth
First, within existing funding and legal authorities, the Department has unfinished business that it can act on now.
Secure approval of the package of categorical exclusions under the National Environmental Policy Act (NEPA) — now awaiting approval by the President’s Council on Environmental Quality (CEQ). Over many years agencies have documented how invasive species control improves, rather than harms, the environment. Absent an applicable NEPA categorical exclusion approved by CEQ, though, each such action needs to run the time- and money-consuming gauntlet of NEPA compliance. In the meantime, the invasive plants germinate, the invasive animals reproduce, and what might have been a localized and inexpensive problem has expanded geographically and in terms of cost and complexity. In the Fall of 2020 Interior submitted hundreds of pages of documentation on numerous practices proven to control invasive species without harming the environment. Due to time and staffing constraints at CEQ, these categorical exclusions still await action. Interior and CEQ should take prompt steps to finish them.
Allocate to the US Geological Survey at least $10 million of the roughly $90 million remaining available to the Secretary in CARES Act appropriations for research on invasive zoonotic diseases. These are diseases like COVID-19 and West Nile virus that can move from one species to another. Many zoonotic diseases fit the definition of invasive species, since they are not native to the United States and endanger human health. In the case of COVID-19 funding is available to the Secretary of the Interior, without need for further Congressional action, from funds appropriated by the CARES Act. The availability of these funds will expire at the end of September 2021, so Interior should provide this research funding to USGS as soon as possible.
Join the existing Memorandum of Understanding between the Western Governors Association (WGA) and the US Department of Agriculture’s Forest Service. These groups have established “a framework to allow the U.S. Forest Service (USFS) and WGA to work collaboratively to accomplish mutual goals, further common interests, and effectively respond to the increasing suite of challenges facing western landscapes.” This provides a forum to improve coordination between the States and the federal government on the management of invasive species, and Interior needs to be part of that team.
Interior should work with USDA to accelerate and intensify efforts to systematically improve coordination between the interagency Wildland Fire Leadership Council and the interagency National Invasive Species Council. Both Councils have member agencies that practice vegetation management using similar tools and techniques, although for different purposes. The two Councils should identify a select number of initiatives in FY21 where their efforts would benefit both wildland fire management and invasive plant management .
swamp bay trees in Everglades National Park killed by laurel wilt; photo by Tony Pernas
Four steps to implement the strategic plan outside the scope of current law and the President’s Fiscal Year 2021 budget. I offer the following:
Improve implementation of the Lacey Act program to list injurious species. There are both legislative and administrative elements to this proposal.
In a federal District Court decision on May 19, 2015, on a lawsuit filed by the Association of Reptile Keepers, the Court undid the longstanding Fish and Wildlife Service policy that the Lacey Act allowed FWS to ban interstate transport of injurious species. On April 7, 2017, the D.C. Circuit Court of Appeals upheld the District Court’s view. These rulings mean that FWS authority only applies to international commerce. Unfortunately, the court’s interpretation of the law and legislative history are reasonable, so Congress needs to amend the law to make it clear that FWS is explicitly authorized to regulate interstate commerce in injurious species. The Department of the Interior should work with the Department of Justice and the Office of Management and Budget to develop the necessary bill language and submit it to Congress.
At the same time, the FWS injurious species listing process is notoriously slow, even causing Congress to occasionally list species legislatively. The fact that these legislative initiatives have sometimes been promoted by Members of Congress who normally are opposed to more federal regulation signals just how awkward the current FWS process is. Thus there might well be strong bipartisan support to amend the Lacey Act on the interstate commerce matter. Acting on its own authority, FWS should procure an independent third party review of the injurious species listing process and ask the contractor to make suggestions for “business process reengineering” to improve and streamline current practices, along with evaluating whether higher funding or new technology is needed.
The Bureau of Reclamation, Department of the Interior, and the Office of Management and Budget should develop legislative language to submit to Congress for the 2022 Water Resources Development Act, that explicitly authorizes an aquatic nuisance species program in the Bureau of Reclamation. It could parallel the relatively new authority enjoyed by the Army Corps of Engineers and mandate increased coordination between the two water agencies.
Any climate change legislation pursued by Congress and the Administration should include provisions for addressing invasive species. Climate change will make some North American habitats more suitable for foreign organisms, as cold-intolerant species might be able to survive in more northern latitudes in the U.S. than previously was the case. Second, the disruptive effect of climate change on North American ecosystem structure and trophic relationships at any latitude will make those ecosystems more vulnerable to invasion. Finally, the spread of invasive species may in and of itself exacerbate climate change, such as through the increased carbon dioxide emissions from rangeland wildfires aggravated by the dominance of invasive cheatgrass.
The Senate Committee on Environment and Public Works and the House Natural Resources Committee should each hold oversight hearings on how best to help state and local governments detect and respond to new invasive species that are not within the statutory purview of USDA/APHIS. This is a complex topic, important for both ecological and financial reasons. Over the years several attempts to address it have failed. A thoughtful review by Congress and the Administration, which perhaps would lead to passage of new statutory authority and funding, is worth exploring.
The Author:
Scott Cameron recently left the federal government, where he had served as Acting Assistant Secretary for Policy, Management and Budget at the U.S. Department of the Interior. In that capacity he oversaw Department-wide budget, invasive species, natural resource damage assessment and restoration, environmental compliance and numerous administrative functions of this $14 billion agency with 65,000 employees. Previously, Scott held other civil service job (e.g., at the White House Office of Management and Budget) & political appointments in the federal government, on the staff of the Governor of California, and on Congressional staffs. While not in government, Scott led formation of the Reduce Risk from Invasive Species Coalition.
CISP welcomes comments that supplement or correct factual information, suggest new approaches, or promote thoughtful consideration. We post comments that disagree with us — but not those we judge to be not civil or inflammatory.
Further information on the plant pests mentioned in the photo captions can be obtained at www.dontmovefirewood.org; click the “invasive species” button.
Japanese stiltgrass in Shenandoah National Park; photo by Jake Hughes, NPS
The recent appearance of a study by National Park Service (NPS) scientists quantifying the threat posed by invasive plants prompted me to seek updates on this issue. In May 2018, I blogged about NPS’ Invasive Plant Program Strategic Plan, which was issued in 2016. At the time, I got the impression that the program was struggling to gain support from NPS leadership in Washington, as well as leaders of individual parks. Has the situation improved since then?
The recent study, by Kathryn Miller and colleagues, focuses on National parks in the East, from Virginia to Maine. (I provide a full reference at the end of this blog.) I look forward to a planned follow-up article that will try to clarify drivers of invasion.
The Miller study appears to have been undertaken to partially fulfill one of the goals of the NPS’ 2016 Invasive Plant Program Strategic Plan. One of the actions under Goal 1 in the Plan was to quantify the invasive plant threat, the effort needed to manage it, and then to communicate the gap between needs and available resources. Miller et al. have quantified the threat to National parks in one region (not the entire country). However, they have communicated the gap between effort and need in only the most general way.
Protecting the forests in eastern National parks is valuable from many perspectives. The forests in these parks are older and have higher stand-level tree diversity than surrounding unprotected forests. Protecting their long-term condition also corresponds to the National Park Service’s (NPS) stated mission, as established in its Organic Act.
The study relied on National Park Service Inventory and Monitoring Program data from 1,479 permanent forest plots covering 39 eastern NP units located from Virginia to Maine. The data were collected over 12 years, in three survey cycles (2007–2010, 2011–2014, and 2015–2018).
The authors note that in forest ecosystems, invasive plants can reduce native diversity, alter forest structure, suppress tree regeneration, alter nutrient cycling, and modify disturbance regimes. Some – the shrubs and vines – also threaten human health by promoting increases in tick populations and associated Lyme disease risks.
Unsurprisingly, the data showed invasive plants to be widespread, and increasing. In 80% of the park units, there was a significant increase in at least one trend measuring abundance. Any decrease in plant invaders tended to be in herbaceous or graminoid species; that decrease was often counterbalanced by an approximately equivalent increase in invasive shrubs or vines. In 35 of the park units, more than half of the plots had at least one invasive plant species when the 2015-2018 survey began. In 10 parks (a quarter of those surveyed), every plot had at least one.
The most widespread species is Japanese stiltgrass (Microstegium vimineum). It is present in more than 75% of all park units and 30% of all 1,400 plots. This dominance is true despite the fact that stiltgrass does not extend north of Roosevelt-Vanderbilt National Historic Site in New York state (41o N latitude). Stiltgrass is also the most aggressive invader.
The second most widespread invaders are a group of shrubs and vines, including most notably Japanese barberry (Berberis thunbergii), Japanese honeysuckle (Lonicera japonica), multiflora rose (Rosa multiflora), and wineberry (Rubus phoenicolasius). I note – although the articles does not – that several of these have been deliberately planted – either to “enhance” ecosystems (multiflora rose) or as ornamentals (barberry). [Lehan et al. 2013 (full reference at end of blog) found that 95% of 125 shrub species introduced to the U.S. were introduced deliberately.] I know of no examples of deliberate planting of Japanese stiltgrass.
The most frequently detected non-grass herbaceous species is garlic mustard (Alliaria petiolata), which was detected in 20% of plots. Garlic mustard is found throughout the study area (Virginia to Maine). Tree-of-heaven (Ailanthus altissima) is the most common invasive tree. It is found in only 9% of plots and does not grow north of Roosevelt-Vanderbilt NHS. Again, both were intentionally introduced – and not noted as such in the article.
Because they could not identify the source populations for each plot, the study could not directly measure rates of establishment and expansion. The data did allow tracking rough trends in each park.
Parks with the highest abundance tended to be near densely populated areas. However, this pattern was not universal. For example, Prince William Forest Park in the outer Virginia suburbs of the District of Columbia metro area was one of two of the least invaded park units.
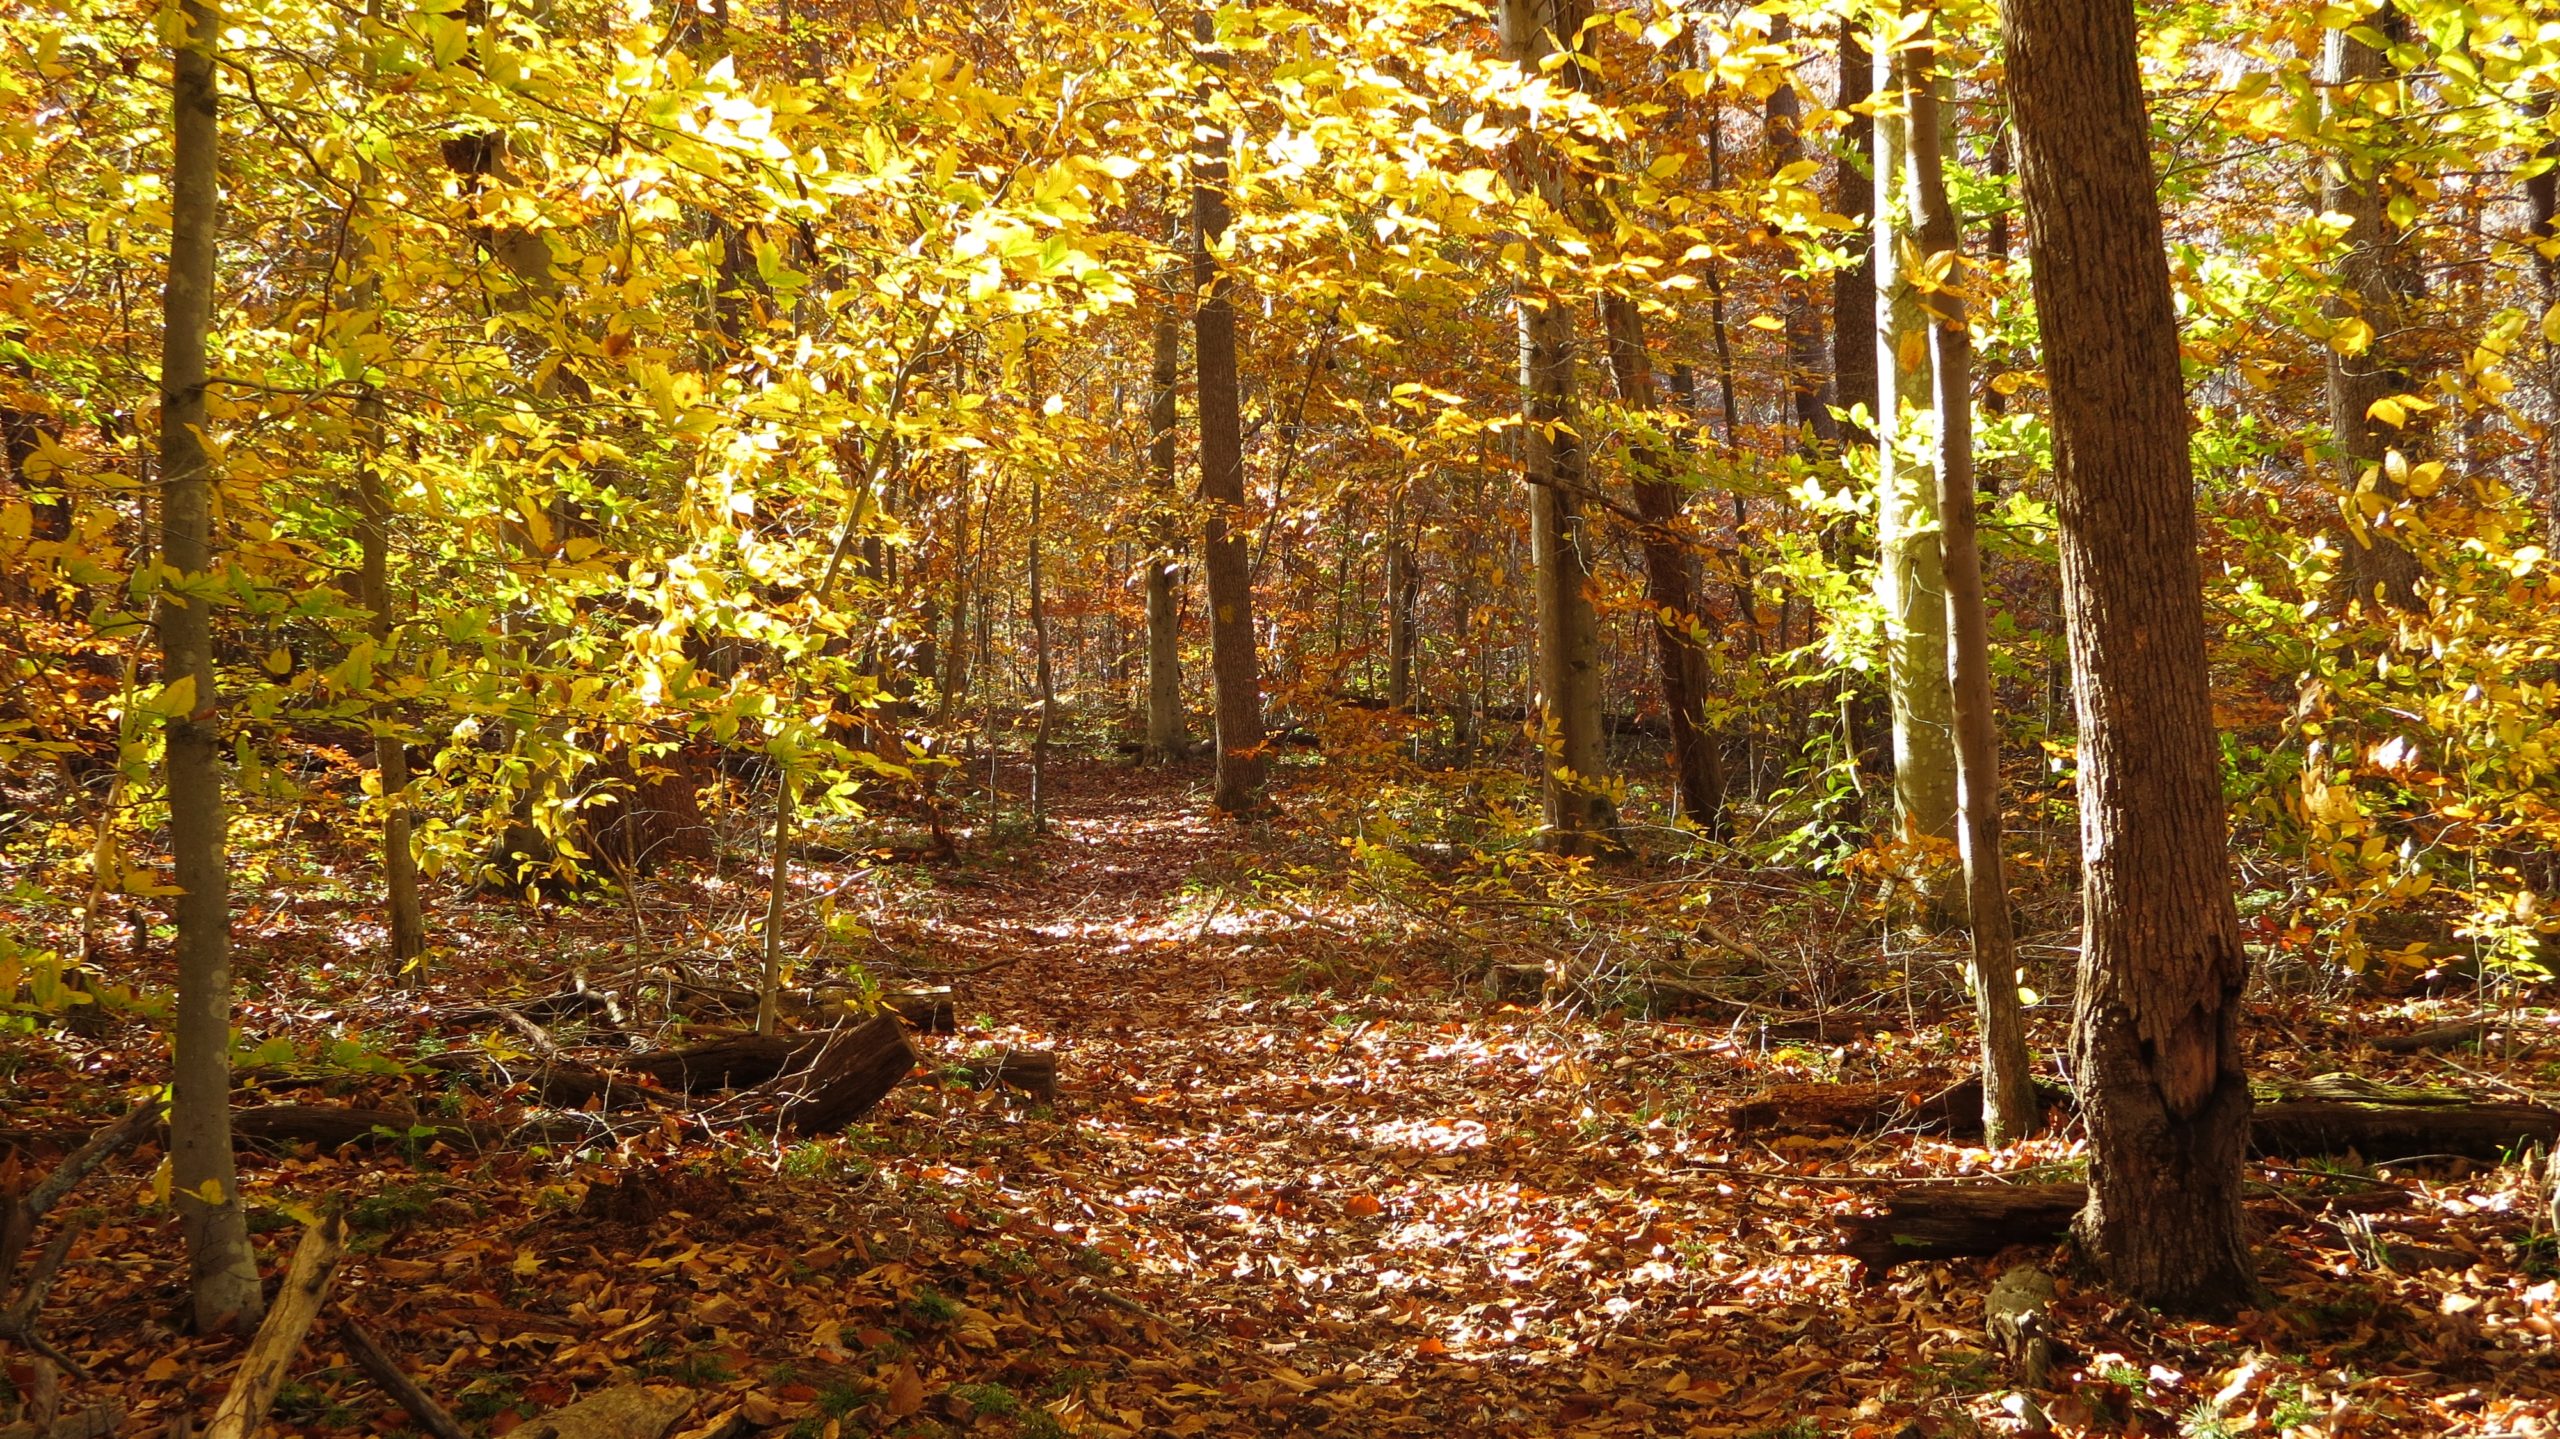
Prince William Forest Park
(note the prevalence of beech – I fear for the arrival of beech leaf disease!)
Total invasives increased significantly in 21 of the 39 parks for at least one metric. In 10 parks (a quarter of all parks), total invasives increased significantly in two of the three metrics. Antietam National Battlefield experienced the steepest increases.
The authors note that invasive plants continue to establish and expand, even in already heavily invaded forests. Thus they found little evidence of saturation. This finding conflicts with invasion theory. They also found antagonistic interactions between invasive species to be common.
The authors said managers should prioritize efforts to control Japanese stiltgrass and the shrubs and vinesdue to their widespread occurrence, rapid expansion, ability to suppress tree regeneration and understory diversity, and – in the case of the shrubs and vines, link to ticks.
The authors noted the need to better understand the drivers and impacts of invasive plants in eastern forests. They mentioned the overabundance of white-tailed deer (Odocoileus virginianus), latitude, climate change, fragmentation and urbanization. I have urged them to include analysis of deliberate planting of various species on lands within the park units or nearby. They have said that they will do so in the planned follow-up article.
The authors propose that deferred management of natural resources receive attention and sustained commitment on par with the attention to deferred maintenance of the park units’ infrastructure. The maintenance backlog has been addressed through recent legislation: the Great America Outdoors Act which provided $6.5 billion over five years to address deferred maintenance projects in all 419 national park units. I believe that these projects will not address invasive species, which are managed under the “Natural Resources” budget account, not “Maintenance”. Some “Maintenance” projects probably will include control of invasive plants. A former Interior Department official has suggested that resource management activities might be funded under another section of the legislation, which provides $900 million under the Land and Water Conservation program. I hope this is true.
National Park Service’ Overall Invasive Plant Program Now
In response to the mandate in the John D. Dingell, Jr. Conservation, Management, and Recreation Act (Public Law 116-9), the Department of Interior has issued a department-wide invasive species strategy. Will issuance of the new strategy provide impetus to the NPS to seek funding to implement its 2016 invasive plant strategic plan? Will Congress provide funds for this purpose?
Finding out the current status of National Park Service took a little effort. The NPS’ website has “popular” information about the efforts of individual regional Invasive Plant Management Teams (see links at the end of this blog). These posts provide only the briefest overview of program achievements and do not compare those accomplishments to the goals in the 2016 plan.
However, Terri Hogan, Invasive Plant Program Manager in the Biological Resources Division, provided following information:
NPS leadership now supports the agency’s invasive plant effort. The national Invasive Plant Program (IPP) contributes to the annual Natural Resource Stewardship and Science Directorate (NRSS)’ Biological Resource Division (BRD) work plan. All is guided by the “Four Pillars to Guide Natural Resource Activities and Investments”, adopted in 2016.
It is not clear that invasive species have the highest priority under this regime. The four “pillars” are
Holding the line – includes conserving biodiversity by removing invasive plants
Managing amid Continuous Change – includes conducting risk assessment and taking other actions to contain future exotic species
Leveraging for Conservation at Scale
Enhancing Stewardship and Science Access and Engagement
Cooperation with owners of neighboring private lands has been enhanced by engagement of the Western Governors Association and state and local political leaders. Many parks participate in Partnerships for Invasive Species Management (PRISMs), CISMS, and Cooperative Weed Management areas (CWMAs). This collaboration has been strengthened by adoption of the John D. Dingell, Jr. Act (see above).
In practice, the focus appears to still be on the Invasive Plant Management Teams (IPMTs). There are now 17 teams. Fifteen are funded through the national office. One is funded by an individual park; one funded through a regional office. Annual reports have been published for FYs 2017 and 2018. The FY19 report has been held up but should be posted soon.
The reports provide brief description of the overall program and vignettes of particular activities. There are more detailed – but still anecdotal – reports for each of the teams. It is difficult to determine whether there has been overall progress. For example, the reported total infested acreage increased from 133,658 acres in FY17 to 301,195 acres in FY18. This presumably reflects more intense monitoring as well as a probable increase in real infections. (The infested acreage figures do not address intensity of invasion on these acres.) The teams cumulatively treated 8,937 acres in FY 2017; 8,331 acres in FY 2018. They carried out inventory and monitoring projects on 169,057 acres in FY17, 210,000 acres in FY18.
Since the Miller article concerns the region from Virginia to Maine, I checked the FY17 and FY 18 reports from the Invasive Plant Management Teams from the Mid-Atlantic, National Capital Area, and Northeastern regions. The Mid-Atlantic team emphasized work on wavyleaf basketgrass and meadows in parks established to protect cultural or historic sites. The National Capital Area team emphasized partnerships and success eradicating Giant Hogweed (Heracleum mantegazzianum) on private land neighboring Rock Creek Park. The Northeastern Team serves 25 parks; the report emphasized leveraging resources and testing efficacy of pre-emergent herbicide for control of Japanese stiltgrass. With this exception, the teams do not appear to be prioritizing the species recommended for action by the Miller study.
Brief, “popular” articles about the NPS’ invasive plant effort are available here
Lehan, N.E., J.R. Murphy, L.P. Thornburn, and B.A. Bradley. 2013. Accidental Introductions are an Important Source of Invasive Plants in the Continental United States. American Journal of Botany 100(7): 1287–1293. 2013.
Miller, K. M., B. J. McGill, A. S. Weed, C. E. Seirup, J. A. Comiskey, E. R. Matthews, S. Perles, & J. Paul Schmit. 2020. Long-term trends indicate that invasive plants are pervasive and increasing in eastern national parks. Ecology. 00(00):e02239. 10.1002/eap.2239
Posted by Faith Campbell
We welcome comments that supplement or correct factual information, suggest new approaches, or promote thoughtful consideration. We post comments that disagree with us — but not those we judge to be not civil or inflammatory.
For a detailed discussion of the policies and practices that have allowed these pests to enter and spread – and that do not promote effective restoration strategies – review the Fading Forests report at http://treeimprovement.utk.edu/FadingForests.htm
EAB-kiled ash tree in Shenandoah National Park in 2016 photo by F.T. Campbell
As we have known for years, forests of the eastern United States are under severe pressure from non-native forest insects and diseases. Several recent studies have put this fact into perspective.
Fei et al. (2019) found that the 15 most damaging introduced species threaten 41.1% of the total live forest biomass in the 48 conterminous states. Nine of the 15 species included in this calculation are pests of the eastern forest. Indeed, the greatest increase in biomass loss, as measured by USDA Forest Service Forest Inventory and Analysis (FIA) plot data occurred here. Compensatory growth in unaffected trees and the recruitment of new regeneration occurs only later – as much as two or more decades after the pest invasions began. Fei et al. (2019) expect these losses will be exacerbated in the future due in part to the likelihood that additional pests will be introduced.
Randall Morin found that non-native pests had caused approximately 5% increase in total mortality, by tree volume, nation-wide.
Most widespread pest threats in the East
Scientists have used several methods of measuring introduced pests’ impacts. One measure is the number of counties where the pest is present. A second measure is the proportion of the volume of the host that has been affected. Both metrics are used by Morin. A third method, used by the CAPTURE Project (Potter et al. 2019a), is the number of hosts affected by the pest.
Morin and colleagues found that the European gypsy moth has invaded 630 counties – or 29% of the volume of its principal host, oaks. (In both cases, the gypsy moth trailed white pine blister rust in extent of infestation. The latter is nationwide but having its greatest impacts in the West). The CAPTURE Project found that the gypsy moth affected the largest number of hosts – 65.
Using the “counties invaded” metric, Morin and colleagues found that dogwood anthracnose had invaded 609 counties in the East (and additional areas in the West); the emerald ash borer had invaded 479 counties at the time of analysis; the hemlock woolly adelged had invaded 432 counties. Using the number of hosts impacted measure, oak wilt (Bretziella fagacearum) affected the second largest number of hosts – 61 (Potter et al. 2019a). [All these pests are described briefly here.]
Project CAPTURE (Potter and colleagues 2019a) evaluated 339 serious pests threatening one or more of 419 native tree species in the continental US. They included both native and introduced pests. They analyzed 1,378 pest-host combinations. They found that:
54% of the host tree species (228) are infested by an exotic pest – although only 28% of the 1,378 host/agent combinations involved pests are known to be non-native in origin.
Exotic agents have, on average, considerably more severe impacts than native pests.
Non-native pests had greater average severity on angiosperms than on conifers. (As an earlier blog documented, Mech and colleagues have reached a similar – although tentative – conclusion.)
Their estimate of the threat posed by non-native pests to forests – especially for the East – is an underestimate because established pests could spread to additional vulnerable areas and there is a high likelihood that new pests will be introduced. The Southeast was consistently a “coldspot” – despite the near extirpation of one understory tree – redbay.
Potter et al. (2019a) ranked forest threats in two ways. Four host families were at highest risk to alien pests, as measured by both the numbers of tree species affected and by the most host/agent combinations: Fagaceae (oaks, tanoaks, chestnuts, beech); Pinaceae (pines); Sapindaceae (soapberry family; includes maples and buckeye); Salicaceae (willows, poplars, aspens). When host families were ranked by the severity of the host/pest threat, Fagaceae was still at greatest risk, and Sapindaceae was still in the top four; however, Ulmaceae (elms) and Oleaceae (includes Fraxinus) replaced pines and willows.
A very interesting study was published by scientists based in the Blue Ridge Mountains of Virginia (Anderson-Teixeira et al. 2020). They contend that their area is a good example of what is happening more broadly in the Mid-Atlantic region.
Anderson-Teixeira et al. (2020) found that non-native pests have substantially impacted at least 24% of the 33 tree genera (eight genera) recorded as present in their study plots. They estimated that over the century beginning with the appearance of chestnut blight in the region and ending with the expected extirpation of ash trees, net live aboveground biomass (AGB) loss among affected species totaled roughly 6.6–10 kg m -2. Forty to sixty percent of this loss started before the Park initiated quantitative surveys of permanent plots in 1987. The authors estimated that chestnut contributed up to 50% of estimated AGB losses over the century. Consequently, the estimate has very high uncertainty.
Despite these losses, Anderson-Teixeira et al. (2020) found that both total aboveground biomass and diversity within individual study plots had largely recovered through increases in non-vulnerable genera.
Average above ground biomass across the plots established in Shenandoah National Park increased as the forest recovers from logging, farming, and other disturbances before formation of the Park. These increases were due primarily to reproduction and growth of tulip poplar (Liriodendron tulipifera) and growth (but not reproduction) of oaks. Net AGB biomass was lost in oak- and hemlock-dominated plots. At plots established in the neighboring Smithsonian Conservation Biology Institute, pests had caused relatively minor impacts on AGB.
Diversity of tree species also did not change much. In the Park, the average number of genera per plot declined only 3% between 1991 and 2013. Diversity at the landscape scale increased by two genera – from 26 to 28. Many individual plots, though, lost three genera due to non-native pests – chestnut, redbud, and hemlock. A fourth genus was lost due to stochastic change. At the same time, the plots gained six native genera). This finding might be skewed by the short duration of the study period, which missed initial declines in several taxa and captured only the initial stages of decline in ash.
Several taxa were lost from the monitoring plots but were not completely extirpated from the region. Even those species not “lost” suffered elevated mortality rates and steep declines in abundance and above-ground biomass. These declines have not been reversed. The exception was some oaks, which regained above ground biomass, but not abundance, following the gypsy moth outbreak in the 1980s and early 1990s.
Fei et al. (2019) found that losses in biomass due to non-native pests – as measured by FIA plot data – was greatest for ashes, elms, beech trees, and hemlocks..
Morin and colleagues found annual mortality rates had increased three-fold above background levels for ash, beech, and hemlock. They also calculated the present mortality rates for several species for which the majority of loss occurred before their study (consequently, they could not calculate a pre-invasion “background” rate to which present rates could be compared). These included American chestnut (mortality rate of 7%), butternut (mortality rate of 5.6%), and elm trees (mortality rate of 3.5%).
The CAPTURE Project (Potter et al. 2019a) identified fifteen host-agent combinations with the highest severity. Ten of these species are found in the Mid-Atlantic region:
American chestnut (Castanea dentata)
Allegheny chinquapin (C. pumila)
Carolina ash (Fraxinus caroliniana) ,
pumpkin ash (F. profunda)
Carolina hemlock (Tsuga caroliniana)
butternut (Juglans cinerea)
eastern hemlock (Tsuga canadensis)
white ash (Fraxinus americana)
black ash (F. nigra)
green ash (F. pennsylvanica)
Four of these species are in genera included among the eight genera evaluated in the study conducted in the Blue Ridge (Anderson-Teixeira et al. 2020): American chestnut, butternut, eastern hemlock, green and white ash. The four other genera in the Blue Ridge study were elm (Ulmus), oak (Quercus), redbud Cercis, and dogwood (Cornus). All except redbud are recognized by other sources as heavily affected by non-native pests – confirming Anderson-Teixeira et al. (2020)’s conclusion that findings on the Blue Ridge reflect the wider situation.
Anderson-Teixeira et al. (2020) note that several of these tree species have been declared imperiled by the International Conservation Union (IUCN): American chestnut, butternut, American elm, eastern hemlock, and ash species.
Anderson-Teixeira et al. (2020) report data on three taxa previously important in the canopy of Blue Ridge forests – chestnut, elms, and butternut. Chestnuts larger than 10 cm DBH had disappeared from the future site of Shenandoah National Park by 1910. Short-lived sprouts continue to be present in plots in the low-elevation Smithsonian Conservation Biology Institute. Two elm species were described as ‘‘sparse’’ in the 1939 qualitative survey. Elms have persisted at low densities, low biomass, and increasingly small sizes. Butternut was ‘‘common’’ in 1939, but had disappeared from Shenandoah NP by 1987. On the Smithsonian’s property, butternut declined from four living individuals in 2008 to two in 2018. The near disappearance of butternut reflects the national picture: FIA data show the species has decreased about 58% across its U.S. range since the 1980s – which is decades after butternut canker started having a detectable impact in the Midwest.
In the Park, oak-dominated plots lost on average 24.9% of individuals and 15% of aboveground biomass. After 1995, when the gypsy moth was better controlled by spraying of Bacillus thuringiensis var. curstaki, oak aboveground biomass increased gradually, driven by individual tree growth rather than new recruitment. Continued declines in oak abundance are attributable to oak decline and management actions (or inactions) that do not promote regeneration.
In a separate study, a group of oak experts went through a process of queries to identify the greatest threat to oaks now and in the future (Conrad et al. 2020). They initially identified the following threats as most important currently (descending order): gypsy moth, oak wilt, oak decline, climate change, and drought. The top five future threats were initially identified as climate change, oak wilt, sudden oak death, oak decline, and some unknown new or emerging (non-native) pest or pathogen. By the third round, after the experts thought about their colleagues’ responses, oak decline had replaced gypsy moth as the most critical threat currently. Attack by an unknown new or emerging (non-native) pest or pathogen replaced climate change as the most critical future threat. While there was not a complete consensus, the consensus was stronger on the threat from a new pest.
remnant eastern hemlock at Linderlost, Shenandoah National Park photo by F.T. Campbell
Anderson-Teixeira et al. (2020) reported that eastern hemlock was initially present in ten of Shenandoah plots, but was no longer recorded in the survey plots after 2007. (More than 20,000 insecticide-treated trees remain alive throughout Shenandoah NP).
Before arrival of the emerald ash borer, ash aboveground biomass was increasing in Shenandoah NP and stable on the Smithsonian Institute. EAB-caused mortality was first detected at the Smithsonian site in 2016 and accelerated steeply thereafter, exceeding 12.5% year by 2018. As of 2019, ash had lost 28% of individuals and 30% of aboveground biomass relative to 2016. Ninety-five percent of remaining live trees were considered “unhealthy’’ (Anderson-Teixeira et al. 2020).
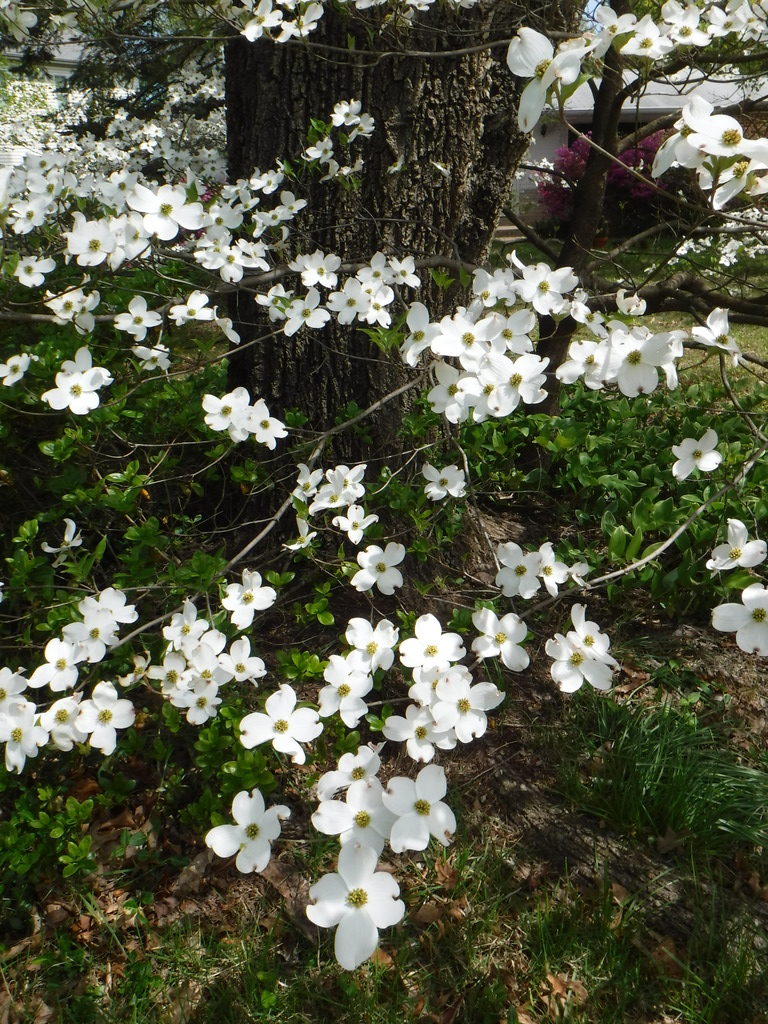
eastern (flowering) dogwood; photo by F.T. Campbell
Unlike many studies, the Shenandoah study included understory species. Flowering dogwood declined by up to 90% from plots on the Smithsonian property; 2008–2019 mortality rates averaged 7.1%. Redbud declined by up to 76% from 1995 to 2018. The 2008–2019 mortality rates averaged 6.2% year.
Anderson-Teixeira et al. (2020) concede difficulty in estimating mortality due to less virulent or lethal pathogens, including Neofusicoccum spp. on redbud and Dutch elm disease on slippery elm.
Nevertheless, they believe their analysis probably underestimates the overall pest impacts because they did not analyze several other pest/host combinations known to be present in the Park: balsam woolly adelgid (Adelges piceae) on high-elevation populations of Abies balsamea; white pine blister rust (Cronartium ribicola) on eastern white pine (Pinus strobus); beech bark disease (Neonectria spp.) on American beech (Fagus grandifolia); thousand canker disease on walnut and butternut; and emerald ash borer on the novel host fringetree Chionanthus virginicus.
Another possible threat to oaks, winter moth (Operophtera brumata), is apparently now being controlled by the biocontrol agent Cyzenis albicans.
I am uncertain about the current status of two Diplodia fungi – Diplodia corticola and D. quercivora – link to blog which have been detected in both Florida and California. In Florida, almost all the symptomatic trees grow in cultivated settings where they are exposed to various stresses (Mullerin and Smith 2015).
However, host range studies indicate that 33 species of oaks and one species of chestnut that grow in the Southeast are vulnerable, to varying degrees, to D. corticola. Oaks in the red oak group (Section Lobatae) are more vulnerable than are white oaks (Section Quercus) (Mullerin and Smith 2015). In the test, the most vulnerable appear to be the following species native to the Southeast: Q. laurifolia, Q. virginiana, Q. geminata, Q. chapmanni, Q. laevis (turkey oak), Q. phellos, Q. pumila, and Q. incana (Dreaden et al. 2016).
What should we do?
Fei et al. (2019) noted that the losses to biomass would be exacerbated by the likely introduction of additional pests. They did not recommend any prevention actions.
Conrad et al. (2020) said their findings “lend support to national regulatory and awareness efforts to prevent the introduction and establishment of novel exotic insects and pathogens.”
Anderson-Teixeira et al. (2020) join others in declaring that future survival of the IUCN-listed species probably depends on conservation and restoration actions. They cite several sources, but not the CAPTURE Project – although the two studies reinforce each other. They specifically mention limiting invasive species’ spread through strengthened regulations and “enhanced plant biosecurity cyberinfrastructure”.
This last recommendation reinforces the message of Bonello et al. (2019) link to publication. We called for creation of a federal Center for Forest Pest Control and Prevention to implement end-to-end responses to forest pest invasions. One focus would be correcting the currently-inadequate focus on detection, development and deployment of genetic resistance while using modern techniques that allow for much faster breeding cycles.
Posted by Faith Campbell
We welcome comments that supplement or correct factual information, suggest new approaches, or promote thoughtful consideration. We post comments that disagree with us — but not those we judge to be not civil or inflammatory.
For a detailed discussion of the policies and practices that have allowed these pests to enter and spread – and that do not promote effective restoration strategies – review the Fading Forests report at http://treeimprovement.utk.edu/FadingForests.htm
SOURCES
Anderson-Teixeira, K.J., V. Herrmann, W.B. Cass, A.B. Williams, S.J. Paull, E.B. Gonzalez-Akre, R. Helcoski, A.J. Tepley, N.A. Bourg, C.T. Cosma, A.E. Ferson, C. Kittle, V. Meakem, I.R. McGregor, M. N. Prestipino, M.K. Scott, A.R. Terrell, A. Alonso, F. Dallmeier, and W.J. McShea. Date? Long-Term Impacts of Invasive Insects and Pathogens on Composition, Biomass, and Diversity of Forests in Virginia’s Blue Ridge Mountains. Ecosystems
Bonello, P. , F.T. Campbell, D. Cipollini, A.O. Conrad, C. Farinas, K.J.K. Gandhi, F.P. Hain, D. Parry, D.N. Showalter, C. Villari, and K.F. Wallin. 2019. Invasive tree pests devastate ecosystems – A proposed new response framework. Frontiers
Conrad, A.O., E.V. Crocker, X. Li, W.R. Thomas, T.O. Ochuodho, T.P. Holmes, and C. D. Nelson. 2020. Threats to Oaks in the Eastern US: Perceptions and Expectations of Experts. Journal of Forestry, 2020, 14–27
Dreaden, Black, Mullerin, and Smith. Poster presented at the 2016 USDA Invasive Species Research Forum
Fei, S., R.S. Morin, C.M. Oswalt, and A.M. Liebhold. 2019. Biomass losses resulting from insect and disease invasions in United States forests. Proceedings of the National academy of Sciences.
Guo, Q., S. Feib, K.M. Potter, A.M. Liebhold, and J. Wenf. 2019. Tree diversity regulates forest pest invasion. PNAS. www.pnas.org/cgi/doi/10.1073/pnas.1821039116
Morin, R.S., K.W. Gottschalk, M.E. Ostry, A.M. Liebhold. 2018. Regional patterns of declining butternut (Juglans cinerea L.) suggest site characteristics for restoration. Ecology and Evolution.2018;8:546-559
Morin, R. A. Liebhold, S. Pugh, and S. Fie. 2019. Current Status of Hosts and Future Risk of EAB Across the Range of Ash: Online Tools for Broad-Scale Impact Assessment. Presentation at the 81st Northeastern Forest Pest Council, West Chester, PA, March 14, 2019
Mullerin, S. & J.A. Smith. 2015. Bot Canker of Oak in FL Caused by Diplodia corticola & D. quercivora. Emergent Pathogens on Oak and Grapevine in North America. FOR318
Potter, K.M., M.E. Escanferla, R.M. Jetton, and G. Man. 2019a. Important Insect and Disease Threats to United States Tree Species and Geographic Patterns of Their Potential Impacts. Forests. 2019 10 304.
Potter, K.M., M.E. Escanferla, R.M. Jetton, G. Man, and B.S. Crane. 2019b. Prioritizing the conservation needs of United States tree species: Evaluating vulnerability to forest insect and disease threats. Global Ecology and Conservation. (2019)
Dream Lake, Rocky Mountain National Park, with limber pine photo by F.T. Campbell
In this blog, I summarize two pest threats to the unique ecosystems on high-elevation mountain ridges in the West. At risk are several keystone tree species: the five-needle pines growing at high elevations (“high-five” pines) and subalpine fir. The invasive species causing this damage – white pine blister rust (WPBR; Cronartiumribicola) and balsam woolly adelgid (BWA; Adelges piceae) – are two of the most widespread non-native species threatening North American trees and affecting the highest proportion of host volumes (Morin).
The pines being killed by white pine blister rust are whitebark pine (Pinus albicaulis), limber pine (P. flexilis), Rocky Mountain bristlecone pine (P. aristata), foxtail pine (P. balfouriana), and southwestern white pine (P. flexilis var. reflexa). As of 2010, infestations had not been reported on Great Basin bristlecone pine (P. longaeva) and the Mexican white pine species. [Unless otherwise indicated, information on white pine blister rust is from a comprehensive review and synthesis published in the August 2010 issue of Forest Pathology (Vol. 40:3-4).]
As noted above, sub-alpine fir (Abies lasiocarpa) is also being affected – although less uniformly than the pines – by the balsam woolly adelgid.
Both of these pests arrived approximately a century ago, but they are still spreading and causing additional damage. White pine blister rust had spread widely throughout the West within 40 years of its introduction. Meanwhile, BWA spread among lowland and subalpine firs along the Pacific coast from California to British Columbia within 30 years of its first detection. Its spread eastward was slower, but relentless. It reached Idaho, Montana, Utah and interior British Columbia within 50 years. Also, BWA reached Alaska within 90 years of its introduction in California. These pests are perfect examples of how invasive species introduced long ago are dreaded “gifts that keep on giving”.
For a detailed discussion of these pests’ impacts, see the descriptions posted here. To summarize, though, WPBR is present in the ranges of eight of the nine vulnerable western white pines and has caused severe mortality to some species (Sniezko et. al. 2011). For example, 88% of the limber pine range in Alberta is affected (Dawe et al. 2020). WPBR is generally causing more damage to its hosts’ northern populations. Impact of the BWA are more subtle than WPBR. Also, impacts’ severity is linked to climatic conditions. For example, measurable decline on the Olympic Peninsula was greater on south-facing slopes. However, the study did not determine whether this reflected heat-loading and tree stress or more abundant subalpine fir on these slopes. An estimated 19-53% (average 37%) of subalpine fir trees had died on sample plots on one ridge over the 19 years since BWA was first detected there. Overall forest growth after 2007 could indicate partial recovery, a momentary pause in BWA invasion, or tree growth after severe weather events (Hutton 2015).
Ranges of Trees at Risk
Many of the host trees of these two pests are widespread; others are more narrowly endemic.
Limber pine reaches from Alberta and British Columbia south to mountain peaks in Arizona and New Mexico. Whitebark pine is found from Alberta and British Columbia to California and Nevada (USDA Plants database. Subalpine fir stretches from southeast Alaska along the Canadian Rockies coast into Washington, Oregon, east into Idaho, Montana, Wyoming, Colorado, Utah, even into scattered mountain ranges of Nevada and New Mexico (Hutton 2015).
Limber pine and subalpine fir are also found in a wide range of ecosystems within these ranges. Limber pine is found at both upper and lower tree lines in grassy, open forests; on exposed rocky slopes; and in dense, mixed-conifer stands. Subalpine fir is a pioneer species on ridges, alpine meadows, avalanche chutes, and lava beds (Ragenovich and Mitchell, 2006).
Before arrival of non-native pests or pathogens, these tree species have persisted for thousands of years under harsh conditions (Hutton 2015). Many of the individual trees were long-lived; some five-needle pines, e.g., bristlecone pines, have famously live for thousands of years. Core studies demonstrated that subalpine firs trees could live 272 years in the forests of Olympic National Park and 240 years in Glacier National Park (Hutton 2015). Surely loss of these trees – or even their conversion from large and old to small and short-lived – will result in significant destruction of these unique biomes.
All these trees play important roles in high altitude, unique ecosystems (Pederson et al. no date; Dawe 2020; Hutton 2015):
They retain ground water, slow the rate of snow melt, and maintain stream flow characteristics and water quality;
They curtail soil erosion and maintain slope stability; and
They provide high-value food and shelter to wildlife.
Whitebark and limber pines are famous for providing critical food for many wildlife species at high elevations —notably bears and nutcrackers (Compendium and Dawe 2020).
More Pest Threats
Other diseases, insects, and disturbances also pose serious threats to these tree species. The threats vary by region and age of the stand. They include – for the pines — mountain pine beetle (Dendroctonus ponderosae), dwarf mistletoe (Arceuthobium spp.), and various shoot, cone or foliage insects and pathogens. For subalpine fir, threats include western balsam bark beetle (Dryocoetes confusus), fir engraver (Scolytus ventralis), and the fir root bark beetle (Pseudohylesinus granulatus) (Hutton 2015). Trees are also damaged by bear and deer, seed predation by squirrels, wildfire, and biotic succession.
On Washington’s Olympic Peninsula, BWA initiates or predisposes subalpine fir for a novel disturbance complex. BWA-caused stress makes the trees more susceptible to moisture stress and endemic bark beetle attack. Surviving trees are subsequently subject to toppling by wind. A tree can die in a few years, survive with insects for up to 20 years, or recover, depending on duration, severity, and location of infestation, and local environmental conditions (Hutton 2015).
BWA study plots in the Cascade Range experienced subalpine fir mortality ranging from 7 to 79% (measured as stem counts, not basal area) over a 19 to 38 years study period. Higher mortality occurred at low-elevation, mesic sites. One stand experienced 40% mortality in 19 years, but lost the remaining 60% during a subsequent spruce budworm infestation. Most plots continued to show sporadic signs of adelgid presence and continued tree mortality. However, 41-69% of trees survived stem infestations (Hutton 2015).
How to Protect These Ecosystems
The seeds of both whitebark and limber pines are dispersed to newly disturbed, open areas by Clark’s nutcracker (Nucifraga columbiana). Furthermore, whitebark cones open to release seeds only after fire. This had led to expectations that prescribed fire could promote regeneration of these species. However, studies by Dawe (2020) and other have found that nutcracker seed caching behavior and seedling establishment are complex. Fire management might have to vary among regions, demanding consideration of stand characteristics,like openness and the presence of other tree species. For example, in the Colorado Front Range, limber pine can be replaced by subalpine fir when fire-free intervals are long. On the other hand, in Alberta, fire appeared to boost regeneration of the dominant tree species in the stands pre-fire. In the study areas, these were white spruce (Picea glauca) and lodgepole pine (Pinus contorta) (Dawe 2020). Dawe recommends protecting existing stands of limber pine through fire mitigation efforts, e.g., thinning and other fuel treatments, and supplementary planting of seedlings.
Efforts to find biocontrol agents to target the balsam woolly adelgid began in 1957; the original focus was on the insects’ damage to Fraser fir (Abies fraseri) in the southern Appalachians. More than 25 predatory species have been introduced from Europe and Asia. There was simultaneous research on native predators. None has had an impact on BWA populations in either the East or the West.
Neither white pine blister rust nor balsam woolly adelgid is considered a quarantine pest by federal officials, so there is no attempt to prevent their movement via interstate trade in Christmas trees, timber, or nursery stock. Hutton (2015) hypothesizes that the absence of regulatory measures targetting BWA arises from the pest’s gradual effect and the hosts’ not being commercially important as timber species (although several firs are important in horticulture and as Christmas trees). I think another factor is that the pests were introduced so long ago and are now widespread.
Efforts are under way to detect resistant genotypes to be used in breeding programs. Several of the lower-elevation five-needle pines vulnerable to WPBR have benefitted from extensive breeding efforts Whitebark pine has more recently been added to programs.
The eastern Fraser fir is the target of breeding – primarily for Christmas trees (APS). However, at least small-scale volunteer efforts have been carried forward by the Alliance for Saving Threatened Forests.
Hutton (2015) expresses hope that evolutionary pressure by BWA might enhance survival of more resistant forms of subalpine fir and lead to their gradual takeover. However, I ask, why leave it to chance?
In this context, I remind you of my involvement with a group (see Bonello et al. 2019) proposing creation of a federal Center for Forest Pest Control and Prevention to implement end-to-end responses to forest pest invasions – including overcoming the currently inadequate focus on detection, development and deployment of genetic resistance using modern techniques that allow for much faster breeding cycles.
I am puzzled that the Project CAPTURE places whitebark pine and subalpine fir only in Class A4.2, not among the highest priority species (Potter et al. 2019). As I blogged last spring, Project CAPTURE is part of a multi-partner effort to categorize and prioritize US tree species for conservation actions based on the threats and the trees’ ability to adapt to those threats. I find it puzzling because I am not sure I agree that these two species have a moderately high mean pest severity score – as required by the category. I am less puzzled by the assignment of a low adaptive capacity score.
Limber pine apparently ranks even lower in the Project CAPTURE priority process.
Posted by Faith Campbell
We welcome comments that supplement or correct factual information, suggest new approaches, or promote thoughtful consideration. We post comments that disagree with us — but not those we judge to be not civil or inflammatory.
For a detailed discussion of the policies and practices that have allowed these pests to enter and spread – and that do not promote effective restoration strategies – review the Fading Forests report at http://treeimprovement.utk.edu/FadingForests.htm
SOURCES
A comprehensive review and synthesis of the history, ecology, and management of white pines threatened by white pine blister rust see the August 2010 issue of Forest Pathology (Vol. 40:3-4).
Bonello, P. , F.T. Campbell, D. Cipollini, A.O. Conrad, C. Farinas, K.J.K. Gandhi, F.P. Hain, D. Parry, D.N. Showalter, C. Villari, and K.F. Wallin. 2019. Invasive tree pests devastate ecosystems – A proposed new response framework. Frontiers
Dawe, D.A., V.S. Peters, M.D. Flannigan. 2020. Post-fire regeneration of endangered limber pine (Pinus flexilis) at the Northern extent of its range. Forest Ecology and Management 457 (2020) 117725
Hutton, K.M. 2015. A dissertation submitted in partial fulfillment of the requirements for the degree of Doctor of Philosophy. University of Washington. Available here
Morin, R. Presentation to the 81st Northeastern Forest Pest Council Northeastern states forst agencies, Philadelphia, Pennsylvania, March 2019.
Potter, K.M., Escanferla, M.E., Jetton, R.M., Man, G., Crane, B.S. 2019. Prioritizing the conservation needs of US tree spp: Evaluating vulnerability to forest P&P threats, Global Ecology and Conservation (2019), doi: https://doi.org/10.1016/
Sniezko, R.A., M.F. Mahalovich, A.W. Schoettle, D.R. Vogler. 2011. Past and Current Investigations of the Genetic Resistance to Cronartium ribicola in High-elevation Five-needle Pines. In Keane, R.F., D.F. Tomback, M.P. Murray, and C.M Smith, eds. 2011. The future of high-elevation, five-needle white pines in Western North America. Proceedings of the High Five Symposium. 28-30 June, 2010. Missoula, MT.
eastern hemlocks in Great Smoky Mountains National Park
As
we all know, eastern (Tsuga canadensis)
and Carolina (T. caroliniana) hemlocks
have suffered huge losses due primarily to the introduced hemlock woolly
adelgid (Adelges tsugae – HWA). In New England, there has been more
than a 60% decrease in total hemlock basal area since 1997 and a virtual
absence of hemlock regeneration in HWA-infested areas. HWA continues to spread
– most recently into western Michigan and Nova Scotia (all information, unless
otherwise indicated, is from Kinahan et
al. 2020; full citation at end of this blog). [However, Morin and Liebhold
(2015) found that hemlock basal volume continued to increase for the first 20
years or so after invasion by the adelgid, due to ingrowth of immature
hemlocks. See “results” in Morin et al.,
full citation at the end of the blog.]
This
loss deprives us of a gorgeous tree … and unique habitats. Hemlock-dominated
forests were characterized by deep shade, acidic and slowly decomposing soil,
and a cool microclimate. They provided unique and critical habitat for many
terrestrial and aquatic species.
A
team of scientists based at the University of Rhode Island has carried out an
experiment comparing cuttings from eastern hemlocks apparently resistant to HWA
to susceptible ones. Matching sets of resistant and susceptible trees were
planted at eight sites in seven states – Ithaca and Bronx, NY; Boston; southern
CT; Lycoming County, PA; Thurmont, MD; southern WV; and Waynesville, NC. All plantings
were within or adjacent to forests containing HWA-infested hemlocks.
After
four years, 96% of the HWA-resistant hemlocks had survived, compared to 48% of
the control plants. The HWA-resistant plants were 32% taller, put out 18% more
lateral growth, had 20% longer drip lines, and were in 58% better condition.
HWA was found on trees at only three out of the eight plots. HWA density on
resistant eastern hemlocks was 35% lower than on HWA-susceptible hemlocks,
although this difference was not statistically significant.
Trees
in all eight plots were infested with elongate hemlock scale (Fiorinia externa – EHS), a second insect
damaging hemlocks in eastern North America. However, the HWA-resistant hemlocks
had EHS densities 60% lower than those of the controls.
Kinahan et al. note that identification and use of host tree populations’ potential for pest resistance has played a role in other programs managing non-native pests and pathogens, including Dutch elm disease and chestnut blight.
The
same scientists note that significant effort has been put into biocontrol or
insecticides for management of hemlock woolly adelgid, but without achieving the
desired improvement of forest health. Attempts to cross eastern hemlocks with
HWA-resistant hemlocks unfortunately produced no viable offspring. However,
Kinahan et al. were inspired to
explore possible genetic resistance within natural populations of eastern
hemlocks by the 1) evidence of resistance in Asian and western hemlocks; 2) the
different foliar terpene profiles in those species; and 3) the presence of
apparently healthy mature hemlock trees growing in proximity to heavily
infested trees.
They asked forest managers and other concerned groups to help locate stands with trees that were mature and apparently completely healthy, were located within HWA-devastated hemlock stands, and had not been chemically treated. They chose a small stand of eastern hemlocks growing within the Walpack Fish and Wildlife Management Area in northern New Jersey. This stand was called the “Bulletproof Stand”. They evaluated HWA resistance in five of these trees, then chose two for propagation and planting in the test.
New Jersey’s “bullet-proof stand” on the left photo by Richard Casagrande
The
trees were planted in September 2015. Due to funding gaps, they were not
revisited for four years. Thus, Kinahan et
al. re-evaluated the resistant and vulnerable trees in Autumn 2019 – with
the results I reported above.
Does this study
prove that clonal propagation of apparently resistant hemlocks is an effective
strategy to restore the species?
It
is not that simple.
The
difference in survival and condition was striking, but the authors note several
caveats:
1)
they had not recorded pre-experiment data on plant height or other variables,
so they cannot be certain that variation in initial plant height or dripline
did not contribute to current treatment-level differences in these variables.
2)
they cannot distinguish between the impacts of HWA and EHS on plant growth.
3)
since they could not monitor the planting sites for four years, they cannot
definitively link increased mortality of HWA-susceptible trees to higher pest
densities. However, the lower pest densities and higher survival of
HWA-resistant hemlocks are consistent with herbivore-driven tree mortality.
They
also cannot assess the impact of other environmental stressors (drought, cold,
etc.) on their results.
4)
The small number of trees planted at each site prevented detailed site-level
analyses.
The
scientists conclude that their work is most appropriately viewed as a ‘proof of
concept’ experiment highlighting the need
for future research exploring how HWA-resistant eastern hemlocks might best be
integrated into existing HWA management.
Unfortunately, the
Rhode Island researchers report they cannot persuade the US Forest Service to
support continuing this effort. Will these promising hints not result in
action?
Kinahan
et al. stress the importance of the
reduced pest densities (both HWA and EHS) on the putatively resistant hemlocks.
They think this might be a result of the higher terpene concentrations in the
twigs and needles. Finally, they note that lower densities of sap-feeding
herbivores may also indirectly provide protection against other consumers,
including gypsy moth (Lymantria dispar)
and hemlock looper (Lambdina fiscellaria).
SOURCE
Kinahan,
I.G., G. Grandstaff, A. Russell, C.M. Rigsby, R.A. Casagrande, and E. L.
Preisser. 2020. A four-year, seven-state reforestation trial with eastern hemlocks
(Tsuga canadensis) resistant to hemlock woolly adelgid (Adelges tsugae).
Forests 11: 312
Morin, R.S. and A.M. Liebhold. 2015. Invasions by two non-native insects alter regional forest species composition and successional trajectories. Forest Ecology and Management 341 (2015).
Posted by Faith Campbell
P.S. I have been working with colleagues to promote a more coordinated and well-funded program to combat non-native forest pests – including much greater reliance on identifying and breeding resistance to the pest. Visit here to see this effort.
We welcome comments that supplement or correct factual information, suggest new approaches, or promote thoughtful consideration. We post comments that disagree with us — but not those we judge to be not civil or inflammatory.
prickly pear cacti in Big Bend National Park photo by Blake Trester, National Park Service
The cacti that are such important components of desert ecosystems across nearly 2 million square miles straddling the U.S.-Mexico border are under threat from non-native insects – as I have noted in earlier blogs. Of course, cacti are important in other ecoregions, too – I wrote recently about the columnar cacti in the dry forests of Puerto Rico.
Flat-padded prickly pear cacti of the genus Opuntia are threatened by the cactus moth, Cactoblastis cactorum.
In 1989, the cactus moth was found
in southern Florida, to which it had spread from the Caribbean islands (Simonson
2005). Recently, the moth was found to have spread west as far as the Galveston,
Texas, area and near I-10 in Columbus, Texas, about 75 miles west of central
Houston (Stephen Hight, pers. com.) Two
small outbreaks on islands off Mexico’s Caribbean coast have been eradicated.
In Florida, the cactus moth has
caused considerable harm to six native species of prickly pear, three of which
are listed by the state as threatened or endangered.
When the cactus moth reaches the
more arid regions of Texas, it is likely to spread throughout the desert
Southwest and into Mexico. In the American southwest, 31 Opuntia species are at risk; nine of them are endemic, one is endangered.
Mexico is the center of endemism for the Opuntia
genus. In Mexico, 54 Opuntia species
are at risk, 38 of which are endemic (Varone et al. 2019; full citation at end of this blog).
The
long-term effects of the cactus moth on these North American Opuntia are unknown because there may be
substantial variations in tolerance. The attacks observed in the Caribbean
islands have shown great variability in various cactus species’ vulnerability (Varone et al. 2019).
The Opuntia cacti
support a diversity of pollinators as well as deer, javalina (peccaries),
tortoises, and lizards. Prickly pears also shelter packrats and nesting birds (which
in turn are fed on by raptors, coyotes, and snakes), and plant seedlings. Their
roots hold highly erodible soils in place (Simonson 2005).
While scientists have been concerned about the possible impacts of the cactus moth since it was detected in Florida 30 years ago, a substantial response began only 15 years later. The U.S. Department of Agriculture began trying to slow the spread of the cactus moth in 2005 (Mengoni Goñalons et al. 2014), with a focus on surveys and monitoring, host (cactus) removal, and release of sterile males. This program was successful at slowing the moth’s spread and eradicating small outbreaks on offshore islands of Alabama, Mississippi, and Mexico.
Cactus moth damage to native cacti in Florida photo by Christine Miller, UF/IFAS
However,
the moth continued to spread west and the program never received an appropriation from Congress. The primary funding source was a US – Mexico
Bi-National Invasive Cactus Moth Abatement Program. Both countries contributed
funds to support the research and operational program to slow the spread in the
U.S. Funds were provided through USDA Animal and Plant Health and Inspection
Service (APHIS) and the Mexican Secretariat of Agriculture, Livestock, Rural
Development, Fisheries and Food (SEGARPA). Unfortunately,
funding was reduced by both entities and became inadequate to maintain the
Bi-National Program.
Therefore, in 2012, APHIS abandoned
its regional program and shifted the focus to biocontrol. This is now
considered the only viable control measure in the desert Southwest where vulnerable
cacti are numerous and grow close together. The biocontrol project has been funded
since 2012 through the Plant Pest and Disease Management and Disaster
Prevention program (which receives funding through the Farm Bill). It has
received a total of slightly more than $2
million over seven years. More than half the funds went to the quarantine
facility to support efforts to rear non-target hosts and verify the biocontrol
agent’s host specificity. About a quarter of the funds supported complementary
work of an Argentine team (both the cactus moth and the most promising
biocontrol agent are native to Argentina). Much smaller amounts have supported
U.S.-based scientists who have studied other aspects of the cactus moth’s
behavior and collected and identified the U.S. moths being tested for their
possible vulnerability to attack by a biocontrol wasp.
Here are
details of what these dedicated scientists achieved in just the past seven
years at the relatively low cost of roughly $2 million. Unfortunately, the project now faces a funding crisis and
we need to ensure they have the resources to finish their work.
Some
Specifics of the BioControl Program
After literature reviews, extensive collections,
and studies in the cactus moth’s native habitat in Argentina (Varone et al. 2015), a newly described wasp, Apanteles
opuntiarum (Mengoni Goñalons et al. 2014), has been determined to be host
specific on Argentine Cactoblastis species and the most promising
candidate for biocontrol. Wasps were collected in Argentina and sent to
establish a colony in a quarantine facility in Florida to enable host
specificity studies on North American Lepidoptera (Varone et al. 2015).
Quarantine
host specificity studies and development of rearing technology has not been straightforward. Initially, it was
difficult to achieve a balanced male/female ratio in the laboratory-bred generations;
this balance is required to maintain stable quarantine laboratory colonies for
host range testing. This difficulty was overcome. A second challenge was high
mortality of the cactus-feeding insects collected in the Southwest that were to
be test for vulnerability to the biocontrol wasp. These desert-dwellers don’t
do well in the humid, air-conditioned climate of the quarantine facility! For
these difficult-to-rear native insects, scientists developed a molecular
genetics method to detect whether eggs or larvae of the cactus moth parasitoid were
present inside test caterpillars after they were exposed to the wasps. For easy
to rear test insects, caterpillars are exposed to the wasps and reared to
adulthood. Host specificity tests have been conducted on at least five species
of native U.S. cactus-feeding caterpillars and 11 species of non-cactus-feeding
caterpillars (Srivastava
et al. 2019; Hight pers.comm.).
To
date there has been no instance of
parasitism by Apanteles opuntiarum on either lepidopteran non-target species or
non-cactus-feeding insects in the Florida quarantine or in field collections in
Argentina (Srivastava et al.
2019; Varone et al. 2015; Hight pers.comm.).
The scientists expected to complete host-specificity testing in the coming months, then submit a petition to APHIS requesting the release of the wasp as a biocontrol agent. Unfortunately, the project’s request for about $250,000 in the current year was not funded. This money would have funded completion of the host specificity testing, preparation of a petition to APHIS in support of release of the biocontrol agent into the environment, and preparation of the release plan.
Meanwhile,
what can we expect regarding the probable efficacy of the anticipated biocontrol
program?
Some
of the wasp’s behavioral traits are encouraging. The wasp is widely present in
the range of the cactus moth, and persisted in these areas over the years of
the study. The wasp can deposit multiple eggs with each “sting”. Multiple wasps
can oviposit into each cactus moth without detriment to the wasp offspring. Unmated wasp females
produce male offspring only, whereas mated females produce mixed offspring
genders. In the field, female wasps attack cactus moth larvae in a variety of
scenarios: they wait at plant access holes to sting larvae when they come
outside to defecate; they attack larvae when they are moving on the surface of
the pads; they can sting the youngest cactus moth larvae through the thin plant
wall of mined the pads; and they enter large access holes created by older
larvae and attack larger larvae. The wasps are attracted by the frass
(excrement) left on the outside of the cactus pads by cactus moth larvae (Varone
et al. 2020).
However, I wonder about the extent
to which the cactus moth is controlled by parasitoids in Argentina. Cactoblastis eggs are killed
primarily by being dislodged during weather events (rain and wind) and by
predation by ants. First instar larvae are killed primarily by the native Argentine
cactus plants’ own defenses – thick cuticles and release of sticky mucilage when
the young larvae chew holes into the pads where they enter and feed internally.
As larvae feed and develop inside the pads, the primary cause of mortality is
natural enemies.
Of
all the parasitoid species that attack C. cactorum, A. opuntiarum
is the most abundant and important. When the larvae reach their final state (6th
instars), they leave the pads and find pupation sites in plant litter near the
base of the plants. It is at this stage that the parasitism from A.
opuntiarum is detected in the younger larvae that were attacked while
feeding inside pads. As the moth larva begins to spin silk into which to
pupate, larvae of the wasp erupt through the skin of the caterpillar and pupate
within the silk spun by the moth. Predation by generalists (ants, spiders,
predatory beetles) accounted for high mortality of the unprotected last instar
and pupae (Varone et al. 2019).
Finally,
the cactus moth has three generations per year when feeding on O. stricta in the subtropical and tropical coastal areas of the Americas
and the Caribbean. In Argentina, on its native host, the moth completes
only two generations per year (Varone et
al. 2019).
How to
Get the Program Support Needed
Opuntia in Big Bend National Park Photo by Cookie Ballou, National Park Service
To date, no organized
constituency has advocated for protection of our cacti from non-native insect pests.
Perhaps now that the Cactoblastis
moth is in Texas, the threat it represents to our desert ecosystems will become
real to conservationists and they will join the struggle. The first step is to
resolve the funding crisis so that the agencies can complete testing of the biocontrol
agent and gain approval for its release. So now there is “something people can
do” – and I hope they will step forward.
I hope Americans are not actually indifferent
to the threat that many cacti in our deserts will be killed by non-native
insects. Many are key components of the ecosystems within premier National
Parks, and other protected areas. Cacti also are beautiful treasures in
botanical gardens. I hope conservationists will agree that these threats must
be countered, and will help to ensure
funding of the final stages of the biocontrol tests.
Sources
Mengoni Goñalons, C., L. Varone, G. Logarzo, M. Guala, M.
Rodriguero, S.D. Hight, and J.E. Carpenter. 2014. Geographical range & lab
studies on Apanteles opuntiarum (hymenoptera: braconiDae) in AR, a candidate
for BC of Cactoblastis cactorum (Lepidoptera: Pyralidae) in North America. Florida
Entomologist 97(4) December 2014
Srivastava, M., P. Srivastava, R. Karan, A. Jeyaprakash,
L. Whilby, E. Rohrig, A.C. Howe, S.D. Hight,
and L. Varone. 2019. Molecular detection method developed to track the
koinobiont larval parasitoid Apanteles opuntiarum (Hymenoptera: Braconidae) imported from Argentina to control Cactoblastis cactorum (Lepidoptera:
Pyralidae). Florida Entomologist 102(2): 329-335.
Varone, L., C.M. Goñalons, A.C. Faltlhauser, M.E. Guala,
D. Wolaver, M. Srivastava, and S.D. Hight. 2020. Effect of rearing Cactoblastis cactorum on an artificial
diet on the behavior of Apanteles
opuntiarum. Applied Entomology DOI: 10.1111/jen.12731.
Varone,
L., G. Logarzo, J.J. Martínez, F. Navarro, J.E. Carpenter, and S.D. Hight.
2015. Field host range of Apanteles
opuntiarum (Hymenoptera: Braconidae) in Argentina, a potential biocontrol
agent of Cactoblastis cactorum
(Lepidoptera: Pyralidae) in North America. Florida Entomologist — Volume 98,
No. 2 803
Varone, L., M.B. Aguirre, E. Lobos, D. Ruiz Pérez, S.D. Hight, F. Palottini, M. Guala, G.A. Logarzo. 2019. Causes of mortality at different stages of Cactoblastis cactorum in the native range. BioControl (2019) 64:249–261
Posted by Faith Campbell
We welcome comments that supplement or correct factual information, suggest new approaches, or promote thoughtful consideration. We post comments that disagree with us — but not those we judge to be not civil or inflammatory.