Pest introductions via incoming ships: Higher volumes, expanding ports, more risks, shippers’ response

Volumes of imports continue to rise and enter the U.S. at a wider range of ports. Also, imports continue to arrive with insects in their wood packaging. The international policy intended to fix this problem is not working. It is vital to resolve this issue.

Insects in Wood Packaging

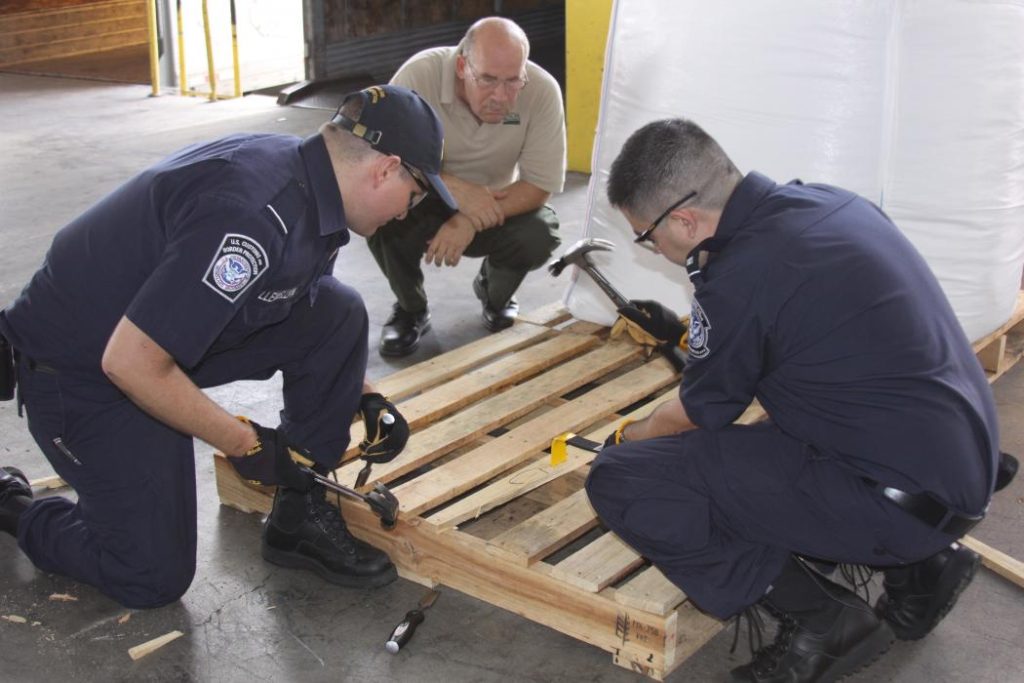
Over the ten-month period October 2020 through June 2021, Customs and Border Protection (CBP)  interceptions were typical, according to Kevin Harriger,  of the Department of Homeland Security, CBP. In a good sign, the number of infested shipments is 4.5% lower than the same period of the previous year. CBP inspectors found 1,563 shipments with non-compliant wood packaging. Three quarters, or1,148 shipments, lacked the required ISPM#15 stamp. A pest was found in 415 shipments (26%). Nearly three-quarters of the shipments (72% or 1,119 shipments) were carrying miscellaneous cargo. The leading pest family was Cerambycids. There were fewer Buprestids than in previous years, but more Siricids. (Reference at the end of the blog.)

Government View vs. Industry View

CBP assessed liquidated damages (a penalty related to the value of the cargo associated with the wood packaging; legal process explained here) on 654 cases (42% of the violations). These penalties totaled about $541,000 (Harriger). In response to industry objections, Harriger suggests that importers “know before you go” and work with the National Plant Protection Organization (NPPO; phytosanitary agency) of exporting countries so as to avoid interception-related delays.

At a separate webinar sponsored by IHS Markit (Journal of Commerce), an APHIS representative (Tyrone Jones, Trade Director-Forestry Products) said that in his view, ISPM#15 is working because less than 1% of wood packaging was non-compliant. Jones conceded that given the huge quantities of wood packaging in use, even a small infestation rate can result in a non-trivial amount of non-compliant wood. Jones also noted that APHIS has co-hosted workshops with Asian and Central/South American phytosanitary officials to improve their implementation of ISPM#15. The official process calls for the U.S. National Plant Protection Organization (NPPO; APHIS) to inform the foreign NPPO of problems and ask that agency to investigate and bring about a solution. Jones said the U.S. has received feedback from the exporting countries. In one case – apparently in China – APHIS got more directly involved –although how it did so is unclear. You may listen to the webinar by going here. Listening is without cost, but you must register at the site.

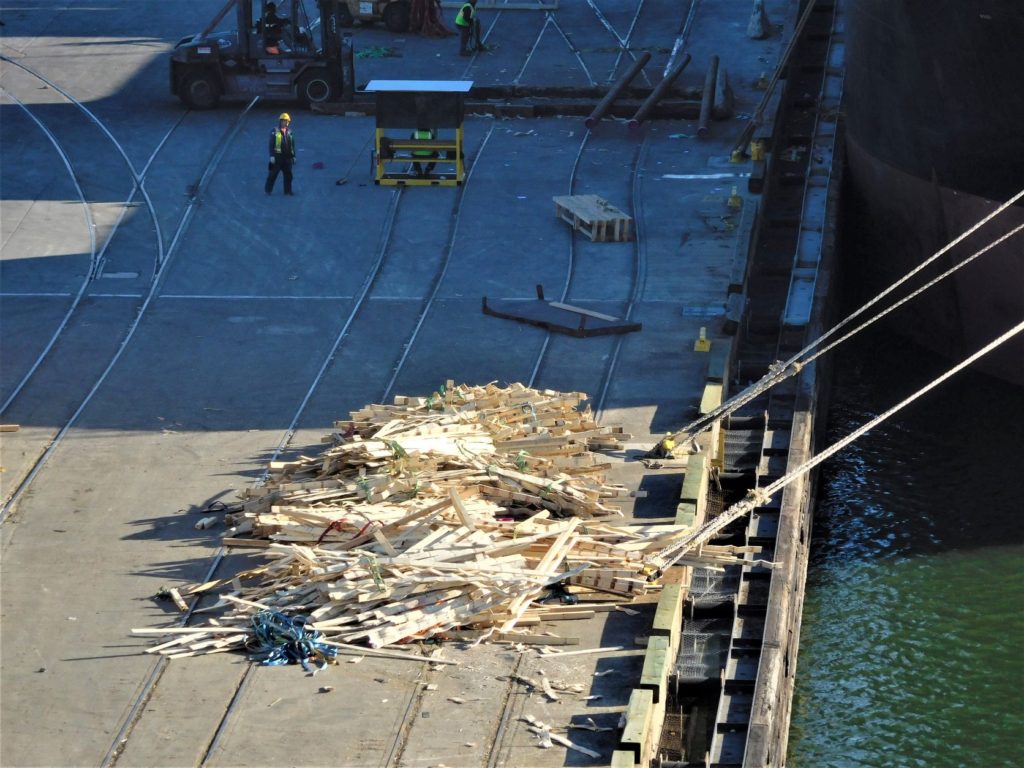
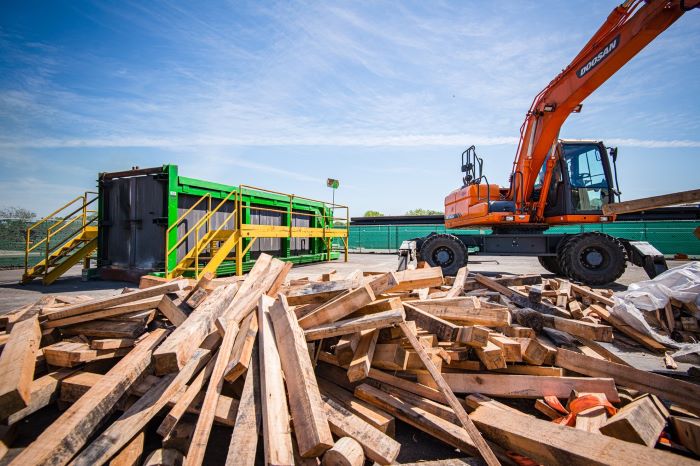
dunnage on a dock

However, as the previous guest blog by Gary Lovett and Diana Davila makes clear, importers are frustrated. They insist that even when they exercise great care in obtaining dunnage, the system is not working. I have blogged previously about the need for government to help importers obtain information that would facilitate compliance (go to “wood packaging” category on this blog site). Jones said APHIS could not provide lists of dunnage suppliers with records of non-compliance.

America needs to ensure that pests are not introduced while trade continues. Furthermore, it is a matter of fairness. U.S. importers are trying but are stymied by the process. For these reasons, the Center for Invasive Species Prevention applauds the initiative of Houston importers to engage players in the supply chain in new approaches. We wish them success!

Issue is International

Concern about the impact of these pest detections – and resulting disruption of cargo shipments – is international. According to an article in the Maritime Executive, five international freight transport organizations under auspices of the World Shipping Counsel in the Cargo Integrity Group are pushing the International Plant Protection Convention (IPPC) to work with them to focus mandatory measures on known high-risk areas and cargoes.

Import Volumes Rising

Meanwhile, volumes of imports continue to rise substantially to meet booming consumer demand – with concomitant risk. Also, imports enter at a wider range of ports. The following data refer to containerized cargo, which is associated with crates and pallets. While the form of wood packaging differs from the dunnage used for the break-bulk cargo which has been the problem in Houston, the issues are the same.

The Southern California port complex (Los Angeles/Long Beach) expects a 10% growth in container volumes this year – to more than 19 million TEU [a standardized measurement equivalent to a 20-foot long container] (Angell 5 August 2021). A few weeks later, this figure was raised to 20 million TEU (Mongelluzo, September 3, 2021). The Seattle-Takoma port complex has received 12.9% more containers from Asia this year than during the same period in 2019. Oakland has received 17.8% more (Mongelluzo August 24, 2021).  

In the East, the port of Savannah moved 5.3 million TEU in the fiscal year ended June 30, an 18% increase over the same period in 2018–19 (before the COVID-19 pandemic upset import volumes). In expectation of further growth in volume, the Port of Savannah is creating additional container storage capacity; it aims to reach 7.5 million TEU by mid-2023 (Ashe 26 July 2021). The Port Authority of Virginia has voted to dredge its main channel which would make the port the deepest on the East Coast (surpassing Charleston) and allow greater access to larger ships coming from Southeast Asia. Virginia’s four container terminals currently handle 4.8 million TEU, collectively. We – federal taxpayers – are paying for these port expansions and associated risks of introduction of wood-boring pests, Asian tussock moths, and aquatic invaders.

Congress Paying to Expand Ports

The bipartisan infrastructure bill now pending in Congress contains $11.8 billion in new federal funding over the next five years to expand and improve ports and inland waterways (Szakonyi August 3, 2021). For example, funding for a portion of the dredging planned by the Port Authority of Virginia is included in this bill.

If adopted, the bill [§40804(b)(6)] also would provide $200 million for invasive species detection, prevention, and eradication, including conducting research and providing resources to facilitate detection of invasive species at points of entry. The funding is divided equally between the departments of Interior and Agriculture. Agencies will need these funds to address the plant pests (to say nothing of aquatic invaders) that arrive at these expanded ports!

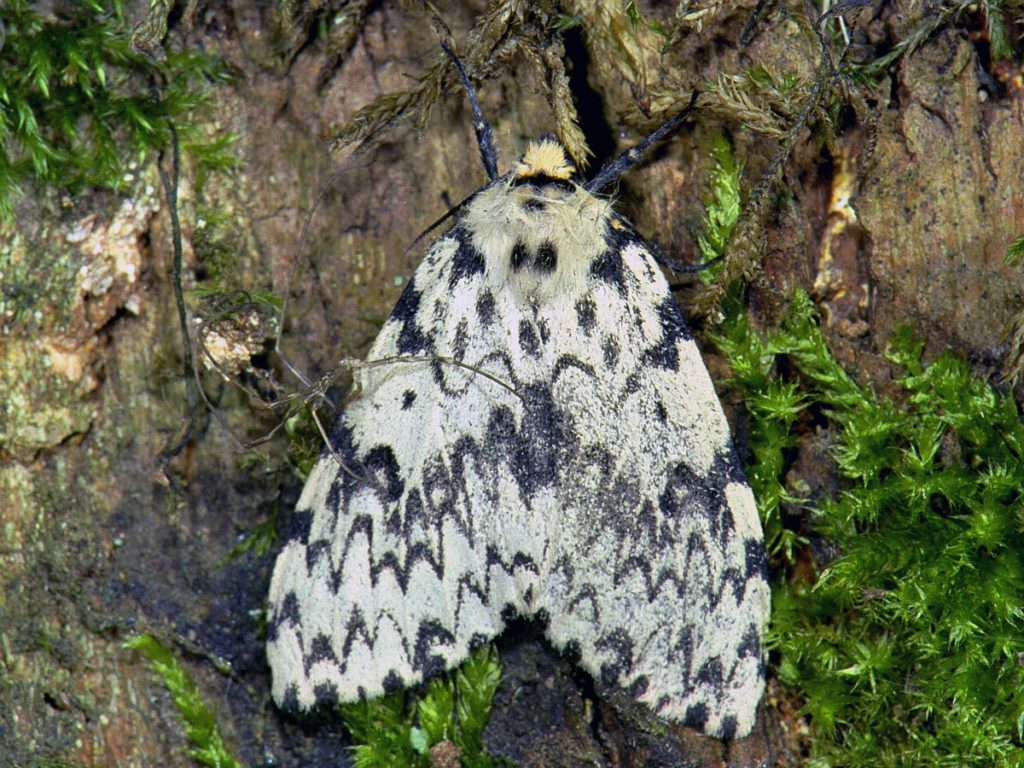
Lymantria monacha 1 Novlinder, Saxafraga -Ab H Bass

Asian Gypsy Tussock Moths – Improved Detection Rates Result from Better Targetting

Another threat to America’s forests is the arrival of tussock moths from Asia. Kevin Harriger told the National Plant Board that CBP has improved its targetting of ships coming from Asia, based on flight dates, proximity of specific loading docks to forested areas, and other factors. Since 2018, CBP has detected moth egg masses on 177 ships. This equals an approach rate of 12.5% – much higher than the historical moth approach rate of 1%. Ships detected to be transporting moths must leave U.S. or Canadian waters and be cleaned. CBP is now searching vessels more intensely during re-inspection– and finding additional egg masses that had been missed. Thanks to the better targetting data, APHIS, CBP and state officials are aware of the approach of suspect vessels before they arrive.

SOURCES

Angell, M. Port of Virginia to proceed with second dredging project. July 27, 2021. https://www.joc.com/port-news/us-ports/port-virginia/port-virginia-proceed-second-dredging-project_20210727.html?utm_source=Eloqua&utm_medium=email&utm_campaign=CL_JOC%20Daily%207%2F28%2F21%20_PC00000_e-production_E-107609_TF_0728_0617

Angell, M.  Long Beach will need 24-hour shifts for future cargo flow: Cordero. August 5, 2021 https://www.joc.com/port-news/us-ports/port-long-beach/long-beach-will-need-24-hour-shifts-future-cargo-flow-cordero_20210805.html?utm_campaign=CL_JOC%20Port%208%2F11%2F21%20_PC00000_e-production_E-108850_TF_0811_0900&utm_medium=email&utm_source=Eloqua

Ashe, A.  Savannah aims to restore fluidity amid record cargoes. July 26, 2021. https://www.joc.com/port-news/us-ports/georgia-ports-authority/savannah-aims-restore-fluidity-amid-record-cargoes_20210726.html?utm_campaign=CL_JOC%20Port%207%2F28%2F21%20%20_PC00000_e-production_E-107524_TF_0728_0900&utm_medium=email&utm_source=Eloqua

Harriger, K. DHS CBP. Presentation at annual meeting of the National Plant Board, 26 July, 2021. https://www.youtube.com/watch?v=btb6FwQkeeo&list=PLeT07astA4fs0OOHQDWHJw2thXQX-4UBb

Haack, R.A., Britton, K.O., Brockerhoff, E.G., Cavey, J.F., Garrett, L.J., et al. 2014. Effectiveness of the International Phytosanitary Standard ISPM No. 15 on Reducing Wood Borer Infestation Rates in Wood Packaging Material Entering the United States. PLoS ONE 9(5): e96611. doi:10.1371/journal.pone.0096611

Jones, J.T, USDA APHIS during JOC webinar, 19 August, 2021

Mongelluzzo, B. Carriers returning to Oakland, Seattle-Tacoma as LA-LB congestion mounts. 24 August, 2021. https://www.joc.com/port-news/us-ports/carriers-returning-oakland-seattle-tacoma-la-lb-congestion-mounts_20210824.html?utm_source=Eloqua&utm_medium=email&utm_campaign=CL_JOC%20Daily%208/25/21_PC00000_e-production_E-110369_KB_0825_0617

Mongelluzzo, B. September 3, 2021. LA-LB preparing for record 20 million TEU this year. https://www.joc.com/port-news/us-ports/la-lb-preparing-record-20-million-teu-year_20210903.html?utm_source=Eloqua&utm_medium=email&utm_campaign=CL_JOC%20Daily%209%2F7%2F21%20_PC00000_e-production_E-111179_TF_0907_0617

Szakonyi, M. August 3, 2021. JOC. Advancing infrastructure bill promises US port funding splurge. https://www.joc.com/port-news/advancing-infrastructure-bill-promises-us-port-funding-splurge_20210803.html?utm_campaign=CL_JOC%20Port%208%2F4%2F21_PC00000_e-production_E-108286_TF_0804_1045&utm_medium=email&utm_source=Eloqua

Posted by Faith Campbell

We welcome comments that supplement or correct factual information, suggest new approaches, or promote thoughtful consideration. We post comments that disagree with us — but not those we judge to be not civil or inflammatory.

For a detailed discussion of the policies and practices that have allowed these pests to enter and spread – and that do not promote effective restoration strategies – review the Fading Forests report at http://treeimprovement.utk.edu/FadingForests.htm
A novel approach for keeping pests out of wood packaging material

A guest blog written by Gary Lovett, Cary Institute of Ecosystem Studies; and Diana Davila, UTC Overseas, Inc.

Gary Lovett died suddenly in December 2022. The future of this initiative is unclear.

Importers are learning that relying on the ISPM#15 mark to ensure that solid wood packaging material is pest-free can be a costly mistake. We propose a private sector solution for keeping insect pests out of wood packaging material and dunnage used in international trade. This voluntary program will supplement ISPM#15 procedures, and implementing it will require cooperation from U.S. government agencies.

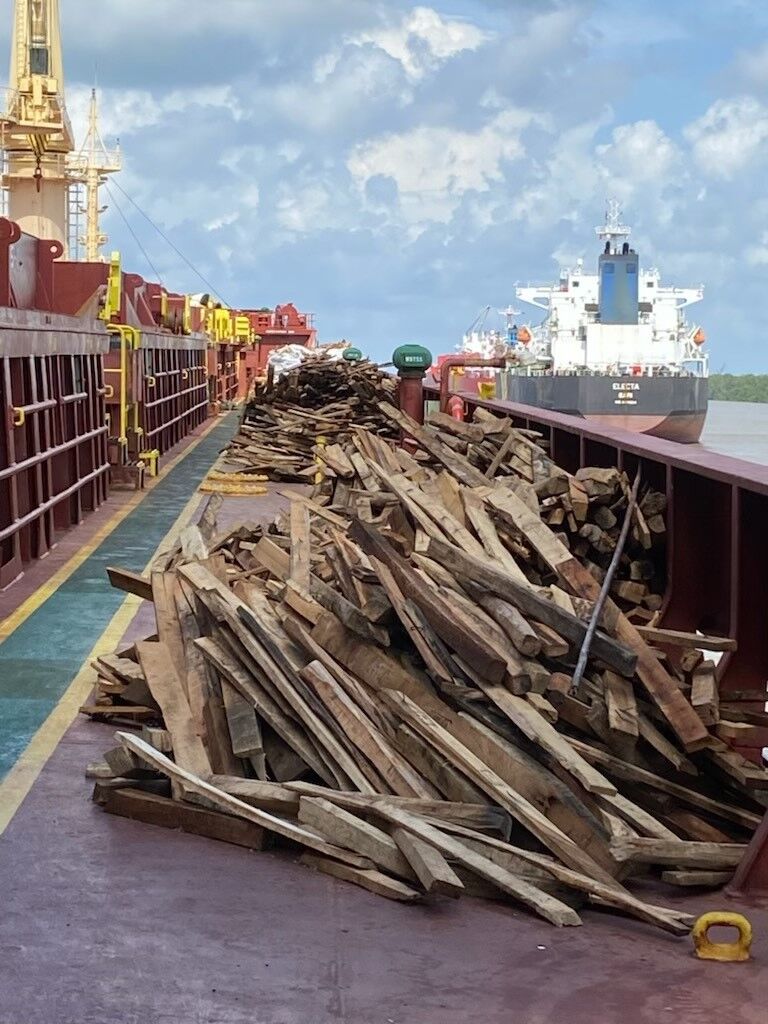
dunnage left on the deck of Pan Jasmine after earlier off-loading of cargo;
intercepted by CBP at Port of New Orleans; CBP photo

Readers of this series of blogs are well aware that international trade using solid wood packaging material (WPM) such as pallets, crates and dunnage can transport wood-boring insects into the U.S., and that these pests are one of the biggest threats to forest health in this country. The international regulation known as ISPM#15 (International Sanitary and Phytosanitary Measures #15), adopted by the U.S. in 2006, was supposed to solve this problem by mandating treatment of WPM to kill embedded insects through heat, fumigation, or other approved treatments. Treated wood is marked with an official stamp. Research has shown that this has only been partially effective, and the U.S. regularly receives WPM that is marked as having been treated, but is nonetheless infested with insects. This can occur either because the treatments are not 100% effective, or because they were improperly applied- or not applied at all, and the wood is fraudulently marked- by our trading partners.

This is a big problem not only for our forests, but for shippers and importers as well. Importers purchase wood and dunnage marked with the ISPM#15 stamp expecting it to be pest-free, but Customs and Border Protection (CBP) inspectors at ports often find insects in the wood. In an average year, CBP finds insect infestations in WPM in about 700 incoming shipments. Depending on the type of insect, this can result in a large fine for the importer or shipper (up to the value of the cargo) and they could also be required to re-export the infested cargo immediately. The re-exportation can be especially costly if an entire ship needs to be turned around and sent elsewhere because of infested WPM on board. In a recent example (see photo above), the Pan Jasmine, a 590-foot, Panamanian-flagged vessel, was found by CBP on July 17, 2021 to have infested dunnage on board and was turned around before it could dock at the Port of New Orleans (see photo above). These episodes often cost importers hundreds of thousands of dollars each time they happen, and in some cases the total cost for a single incident can be in the millions of dollars.

Cerambycid larva found in dunnage from Pan Jasmine; photo by A. Cunningham, USDA APHIS

Importers are learning that relying on the ISPM#15 mark to ensure that WPM is pest-free can be a costly mistake. To try to address this problem, a coalition of shippers that use the Port of Houston established a committee to investigate the issue and try to come up with solutions. The committee, called the Houston WPM and Dunnage Coalition, includes a core group that includes the two of us plus Peter Svensson of Clipper Americas and Richard Brazzale of Lake Shore Associates. The full group includes representatives of several other shipping companies, and we also work with staff from the USDA Animal and Plant Health Inspection Service (APHIS) and CBP.

We suggest a new approach by which importers can help prevent insect infestations of their WPM. Importers routinely use international inspection companies to check merchandise before it is shipped. Working at the loading port, these companies make sure that the cargo is what was ordered and that it is in good condition. There are several large international inspection companies that provide this service to importers for a fee. If the inspectors could be trained to also check for signs of insect infestation in the WPM, the problem could be addressed prior to shipment, reducing the risk of fines and re-exportation when the cargo reaches the U.S. We have spoken with several inspection companies that are eager to provide this service, and we believe that many shippers and importers will conclude that these pre-loading inspections can save them money by avoiding the high risk of fines and re-exportation.

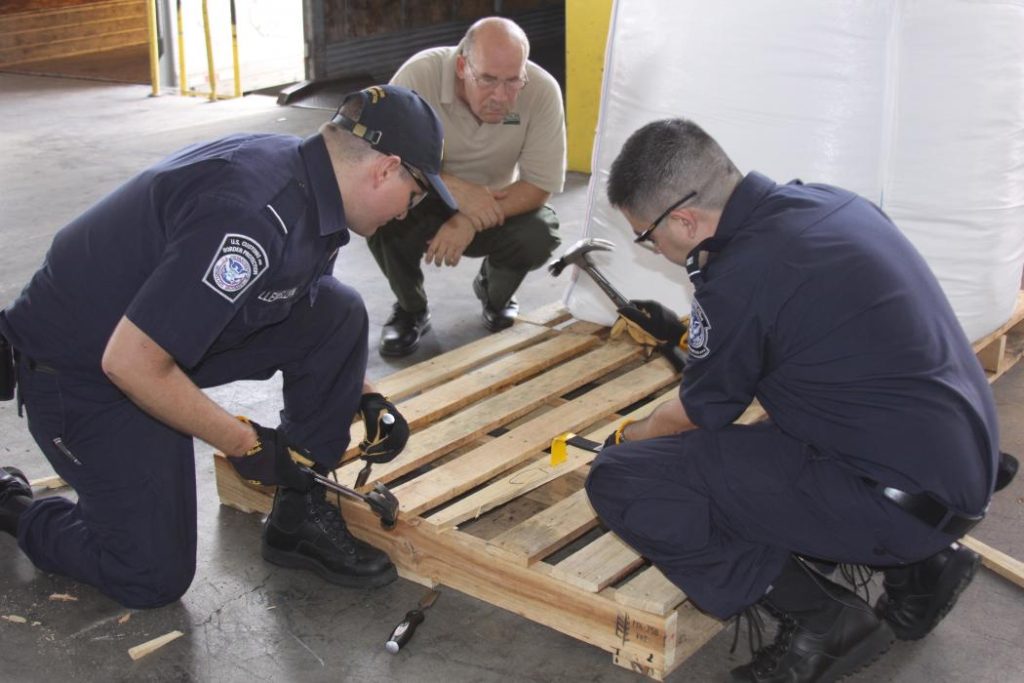
To move forward with this program, inspection companies need to have their personnel trained to spot pest infestations in WPM. CBP has the most experience in this, and we hope they will agree to offer training sessions, or at least provide training material. We also believe that importers and shippers would benefit from creating an organization to oversee the program, certify inspectors and collect information on reliable producers of pest-free WPM. We hope a pilot program can be started within the next year, and that a full program can be ramped up after that. While we are proposing this for cargo bound for the U.S., the system is in concept applicable to cargo moving anywhere in the world. And while we focus on insects in WPM, the same approach could be used to inspect for other invasive species; for instance, seeds on the floor of a shipping container or insect egg masses on containers or cargo.

evidence of insect damage to dunnage on Pan Jasmine; CBP photo

This program offers a private-sector solution to the problem of infested WPM, and represents the first step being sought within the industry to mitigate the risk of pests arriving to the U.S., and the loss of confidence in the ISPM#15 certification being provided by WPM manufacturers. Other possible measures will be discussed in a subsequent blog post. The program would supplement, not replace, ISPM#15 regulations, and importers would still be required to use ISPM#15 compliant WPM. However, this program would reduce companies’ reliance on the ISPM#15 system, which has proven undependable. Developing this system for international shipments of WPM would provide a win-win—good for shippers and importers, and good for forests around the world.

[For Faith Campbell’s blogs on this topic, click on the category “wood packaging,” which is found below the monthly list of blogs on this site.]

New report: Forest Disturbances in the West and their implications for sustainability

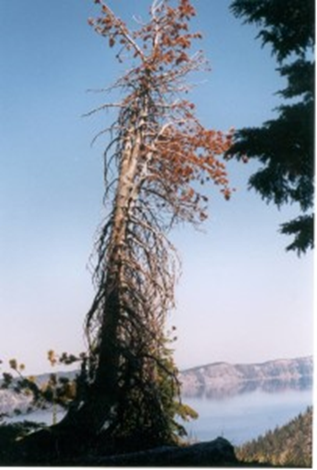
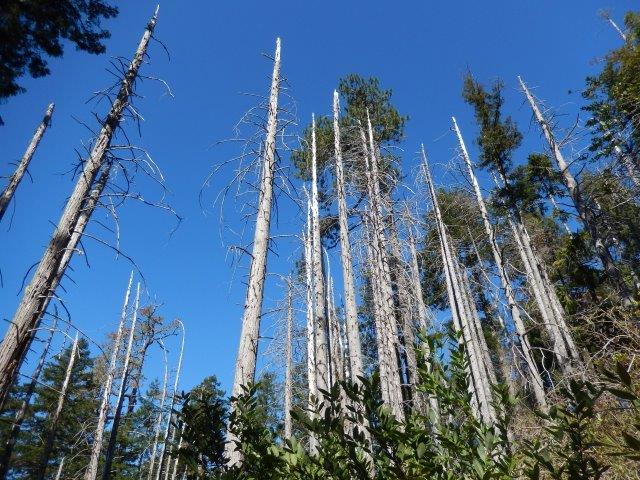
whitebark pine killed by white pine blister rust; Crater Lake National Park; photo by F.T. Campbell

Increasing frequency and severity of forest disturbances pose significant challenges to the sustainable management of forests in the West and to the goods and services they provide. A recent study (Barrett and Robertson 2021; full citation at end of blog) found that natural and human-caused disturbances affected 22.3% of forest land in the West over a 5-year period.  The study analyzed fire, drought, insects, disease, invasive plants, their interactions, and their socioeconomic impacts. Climate change was found to affect most disturbance processes now and is expected to continue to do so in the future.

The impacts of these disturbances varied; most disturbances did not result in stand-replacing mortality.

Overarching Findings on Disturbance Agents in Western Forests

  • Insect and disease outbreaks were the most extensive disturbance types. Each was estimated to affect 6.1 million hectares. Insect and disease outbreaks also caused the highest levels of tree mortality. This finding resulted from what was described as a relatively “low” threshold for “disturbance.” The authors set this threshold at disturbances that cause damage or mortality to 25% of trees in a stand or 50% of an individual tree species.

The overwhelmingly important causal agent was the mountain pine beetle (MPB; Dendroctonus ponderosae). Even after an approximately 50% drop in mortality after its peak years in the 2000s, MPB caused almost half the total area affected by all bark beetles combined  2000-2016.

The great majority of “pest” organisms causing disturbance in the West are native. Some non-native pests are important, though, and they are expected to become more important in the future. The most damaging non-native agent is white pine blister rust (WPBR; Cronaritum ribicola). Despite the largest control effort (in the 1930s), WPBR has caused drastic declines in white pines in the West. Currently attention focuses on high-elevation pines, especially whitebark pine (Pinus albicaulis), which is suffering extensive mortality from a combination of drought, MPB, and WPBR.

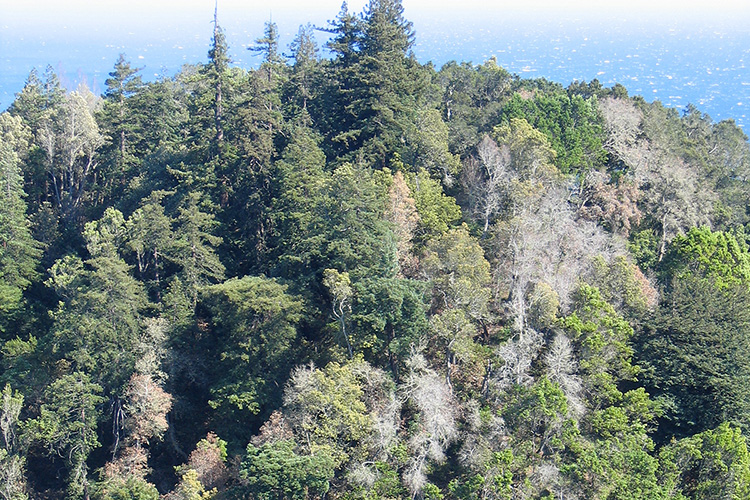
tanoak mortality in Big Sur, California; photo by Matteo Garbelotto

Other non-native pests discussed in the report are balsam woolly adelgid, larch casebearer, spruce aphid, and sudden oak death (SOD). The report notes the presence of a second strain of the causal agent of SOD (Phytophthora ramorum). In June 2021, a third strain was detected in Oregon forests (COMTF newsletter). There are mere mentions of goldspotted oak borer and polyphagous shot hole borer. The California fivespined ips (Ips paraconfusus) is reported to vector the fungus Fusarium circinatum which causes pitch canker disease in Monterey pine (Pinus radiata).

  • The second most extensive disturbance agent in the West is human activity – silvicultural management and conversion to non-forest land uses. These activities affected 4.4 million ha.
  • The third most extensive disturbance agent is grazing (primarily livestock). This affected 3.9 million ha.
  • Fire thus ranks fourth as a disturbance agent – as measured by extent. During a five-year period ending in 2017 or 2018, fire affected 3.7 million ha. (I don’t know whether this ranking will change in response to the fire cataclysms of the most recent years; apparently the latest year included in the data was 2017.) The area affected by fire during this period was double that of the period 1960 to 2000. However, fire frequency and extent were still considerably lower than in the 1920s through1940s, before the advent of fire suppression, especially in the drier forests of the interior West.
  • Other disturbance events – including those caused by weather and vegetation (presumably invasive plants) – affected far smaller areas: a total of 2.3 million ha.

Furthermore, drought and invasive plants – while increasing in extent & intensity – are often considered contributing factors rather than as proximate causes.

Data on past disturbance extents are poor for all these causes except fire. Analysis is further complicated by the high variability of disturbance events – year to year and across space. It is also often difficult to determine the ultimate causes. This makes the implications of these recent increases difficult to ascertain.

As the report points out, forest conditions are inherently dynamic, not stable. They note particularly human manipulation of fire – originally setting fires and then, more recently, suppressing them, has shaped the region’s forests for centuries. Fire suppression has significantly altered forest structure throughout the region, resulting in increasing fuel loads, decreasing resilience to fire and other disturbances.

Impacts of Climate Change

Fire suppression has also increased rates of carbon sequestration (see below).

The report notes that while past timber harvest, land clearing, insect outbreaks, and fires have reduced carbon stocks in forests across the United States to about half their maximum storage potential, recent vegetation and forest cover dynamics have resulted in net increases in carbon stocks in the West – despite CO2 emissions from trees killed by fire and insect damage since 2000.

In the future, climate change is expected to increase tree mortality substantially. In drier forests, mortality would result from increased fire incidence facilitated by a combination of longer fire season and decreased snowpack, reduced summer precipitation, and higher temperatures. In high-elevation and mesic forests, mortality would result from reduced snowpack, precipitation, and temperature.

About half of the West is likely to experience unprecedented climates by the end of this century. This change in climate could trigger changes in vegetation types and extent, net primary productivity, wildfire frequency, and expansion of the range of tree-damaging pests. Grasslands, chaparral, and montane forests are expected to expand; subalpine forests, tundra, and Great Basin woodlands are expected to contract. 

Except in Arizona, California, and New Mexico, bark beetles are having a larger impact on forest CO2 emissions than is fire. Future impacts are unclear. Under moderate climate conditions forests would grow faster than under more severe scenarios, but they would thereby generate more fuel for the fires likely to occur during dry years. These fires might ultimately lead to lower carbon stocks.

I have addressed the invasive plant data in a separate blog.

Reducing Impacts via Management

Barrett and Robertson (2021) suggest management actions that could reduce the impact of these disturbances. First, they mention actions aimed at reducing invasions by non-native insects, pathogens, and plants. Also, they name actions to ameliorate climate change, such as reducing greenhouse gas emissions or increasing carbon sequestration and storage to mitigate expected future damage from wildfire, drought, and beetles.

They recommended a series of on-the-ground management actions: fuel reduction treatments; thinning to reduce tree mortality from drought; favoring species that do not host specific pests; and planting genetically resistant varieties. They call for caution to prevent transport of pathogens to new areas during restoration planting of nursery stock or in “assisted migration” projects. Economic impacts of disturbance events on recreation could be mitigated by altering the timing and duration of recreational site visits. The authors also note that the best choices will differ both by site-specific factors and by management goals. They call for community education programs, cooperative stewardship across multiple agencies and landowners, and local and regional planning.

Details on Pest Impacts

Disease dominated in the high elevations of interior mountain ranges and in the precipitation-heavy regions of Oregon and Washington. Even in these locations, mortality levels are often low, resulting in multi-aged stands with complex structure. Patterns of disturbance are expected to change as pathogens and their hosts adapt to climate change. The microbes might evolve more rapidly than the host trees.

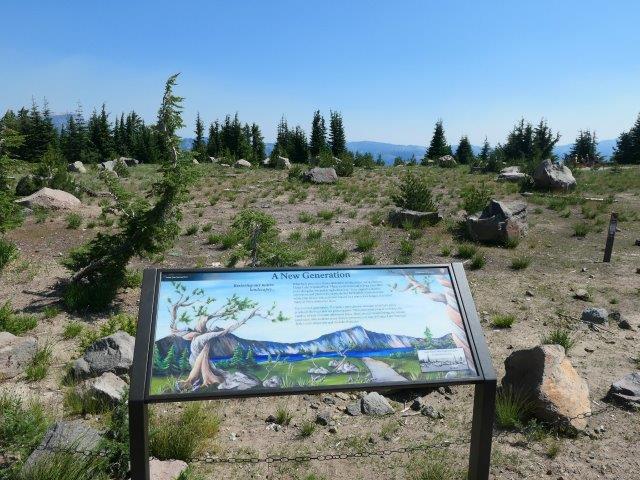
test planting of rust-resistant seedlings of whitebark pine at Crater Lake NP; photo by Richard Sniezko

Sudden oak death (SOD) is now the leading biotic cause of tree mortality in coastal forests of California [and possibly Oregon?]. In heavily infested areas SOD has caused conversion of previously tanoak-dominated stands. The report provides a summary of Oregon’s attempts to eradicate SOD from 2001 to 2012.

I am surprised by the failure to mention non-native pest impacts on two narrowly endemic species: Port-Orford cedar root disease and pitch canker disease in Monterrey pines – other than to mention the vector (above).

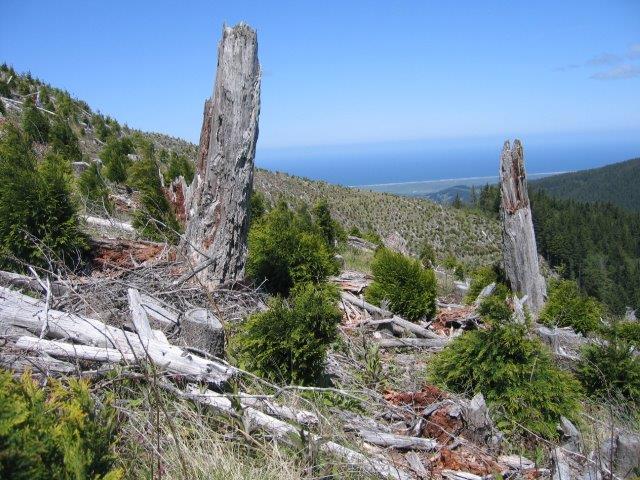
test planting of disease-resistant Port-Orford cedar; photo by Richard Sniezko

Insect outbreaks were most common in pine forests. Decades of fire suppression, and now climate change, have substantially altered forest conditions over millions of hectares, primarily increasing the density of shade-tolerant and fire-intolerant trees (e.g., true firs, Abies spp.). Balsam woolly adelgid (BWA; Adelges piceae) is now threatening subalpine fir stands in British Columbia, Oregon, Washington, Idaho, Montana, and Utah. BWA is ranked as the 10th most damaging forest insect, first among non-native species over the next few decades (2013-2027). The spruce aphid (Elatobium abietinum) is having its most significant impact in coastal Southeast Alaska on Sitka spruce and in Arizona on Engelmann spruce. Projected increases in temperature and the frequency of droughts in the West will likely make spruce aphid a more significant disturbance agent in coming decades.

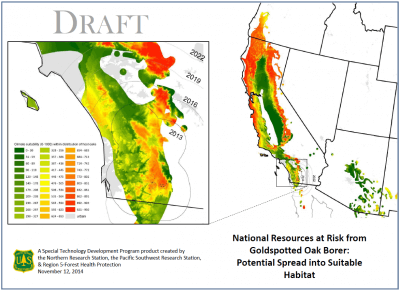
risk map for goldspotted oak borer

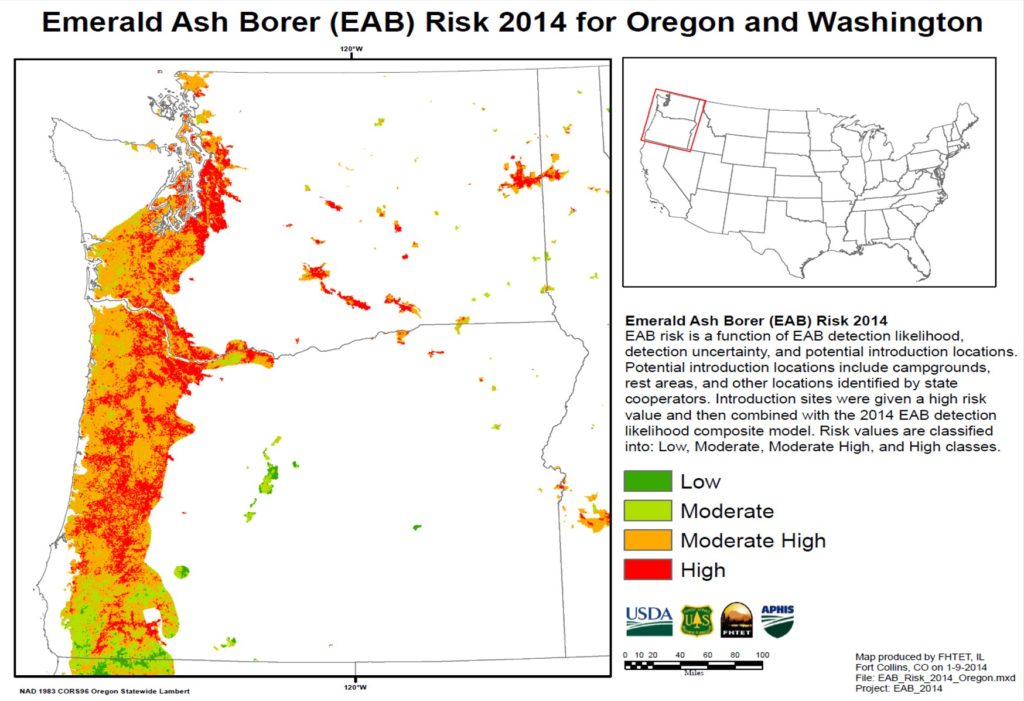
In discussing the goldspotted oak borer (GSOB; Agrilus coxalis sic) in California and emerald ash borer (EAB; Agrilus planipennis) in Colorado, Barrett and Robertson (2021) say that the heterogeneity of western landscapes provides some buffer against invasion.  However, I note that GSOB threatens oaks throughout California (see the map at left). EAB threatens riparian areas of the Pacific states (see map below). These riparian areas are admittedly small in geographic extent but ecologically vital.

Barrett and Robertson (2021) expect seven tree species to suffer substantial levels of tree mortality in the near future.  Six are pines threatened in large part by mountain pine beetle, led by the two high-elevation five-needle pines, whitebark pine (58% of total basal area) and limber pine (44%). These are followed by lodgepole pine (39%), ponderosa pine (28%), pinyon pine (27%), Jeffrey pine (26%). The seventh is grand fir (25% of total basal area); the report does not specify which agents are responsible.

Data Issues

The report notes that insects and pathogens are only partially covered by existing monitoring programs. Pathogens are particularly hard to detect and to make conclusive attributions of causality.

SOURCE

Barrett, T.M. and G.C. Robertson, Editors. 2021. Disturbance and Sustainability in Forests of the Western United States. USDA Forest Service Pacific Northwest Research Station. General Technical Report PNW-GTR-992. March 2021

Posted by Faith Campbell

We welcome comments that supplement or correct factual information, suggest new approaches, or promote thoughtful consideration. We post comments that disagree with us — but not those we judge to be not civil or inflammatory.

For a detailed discussion of the policies and practices that have allowed these pests to enter and spread – and that do not promote effective restoration strategies – review the Fading Forests report at http://treeimprovement.utk.edu/FadingForests.htm
Invasive Plants – an Overview

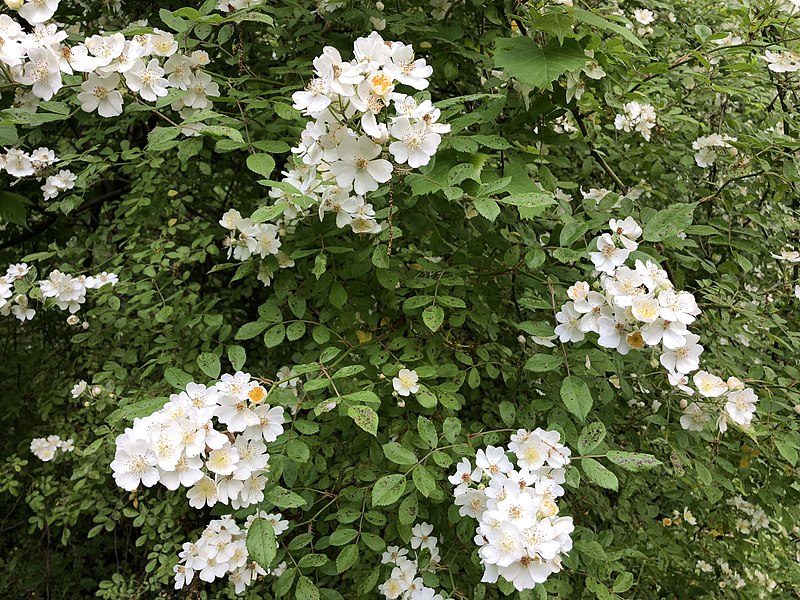
It’s everywhere! multiflora rose (photo by Famartin)

The United States is overrun with introduced plants. Five years ago, Rod Randall’s database listed more than 9,700 non-native plant species as naturalized in the U.S. Not all of these species were “invasive”.

At that time, regional invasive plant groups listed the following numbers of invasive species in their regions:

  • Southeast Exotic Plant Pest Council – approximately 400 invasive plants
  • Mid-Atlantic Invasive Plants Council – 285 invasive plants
  • Midwest Invasive Plants Network reported that state agencies or state-level invasive plant councils in its region listed more than 270 plant species as invasive, noxious, or pest species
  • California Invasive Plants Council listed 208 species.
  • Texas Invasives reported more than 800 non-native plant species in the state, of which 20 were considered invasive.

Species – Rankings and Extents

We know that these invaders are affecting wide swaths of many ecosystems. A recent study based on Forest Inventory and Analysis (FIA) data (explained here) showed that nation-wide, 39% of forested plots sampled contained at least one invasive species.  Hawai`i was first, at 70%. Eastern forests were second, at 46%. In the West overall, 11% of plots contained at least one invasive species. Plots in both Alaska and the Intermountain states were at 6% of plots invaded.  A different study (Barrett and Robertson 2021; full citation at end of blog) reported the proportion of Western forest covered by invasive plants. This approach resulted in different numbers, but the same general ranking: Hawai`i again “led” at 46%; Pacific Coast states at 3.3%; Rocky Mountain states at 0.75%; coastal Alaska at 0.01%.

In more arid regions, data from the Bureau of Land Management showed that invaded acreage had more than doubled between 2009 and 2015.

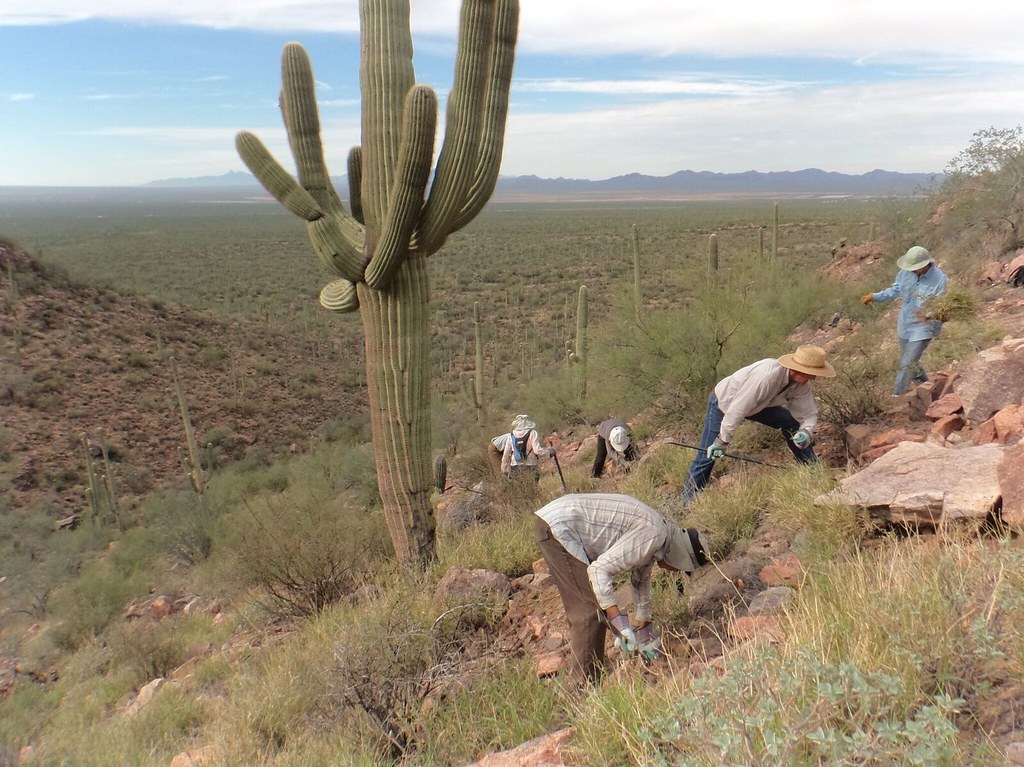
buffelgrass removal in Tucson; Photo by Julia Rowe, Arizona Sonora Desert Museum

The situation is expected to get worse: a study of just one small portion of U.S. naturalized plants found that non-native plant species were more widely distributed than native species and that the average invasive plant inhabited only about 50% of its expected range. Furthermore, human actions were more important in facilitating spread than the species’ biological attributes.

Most of the detailed studies have been conducted in the Northeast – by both Forest Service and National Park Service scientists. The USFS’ Northern Region (Region 9) contains 24 states, from Maine to Minnesota, from Delaware to Missouri. A review of forest inventory (FIA) data (Oswalt et al. 2015) provided details on 50 plant species.   (Unfortunately, the Southern Region [Region 8] has chosen to report in different formats, so it is hard to get an overall picture of invasive plants throughout the forests of the entire East. This is especially annoying to those of us who live in Mid-Atlantic states, which are divided between the two regions.)

Oswalt et al. (2015) provided data on the percentage of FIA plots in each state that were reported to have at least one invasive plant species. The northern Midwest ranked highest – e.g., one state (Ohio) at 93%; one state (Iowa) at 81%; two states (Indiana and Illinois) above 70%. Parts of the Mid-Atlantic region were almost as invaded – West Virginia at 79% and Maryland at 65%.  The Northern plains states ranked lowest in invasions – North Dakota at 29% and South Dakota at 15%.

A study by the National Park Service of part of the Northeast (from Virginia and West Virginia to Maine) found a situation similar to that found by USFS researchers. In 35 of 39 park units, more than half of the plots had at least one invasive plant species when the 2015-2018 survey began. In 10 parks (a quarter of those surveyed), every plot had at least one. Invasions are worsening: 80% of the park units showed there was a significant increase in at least one trend measuring abundance.

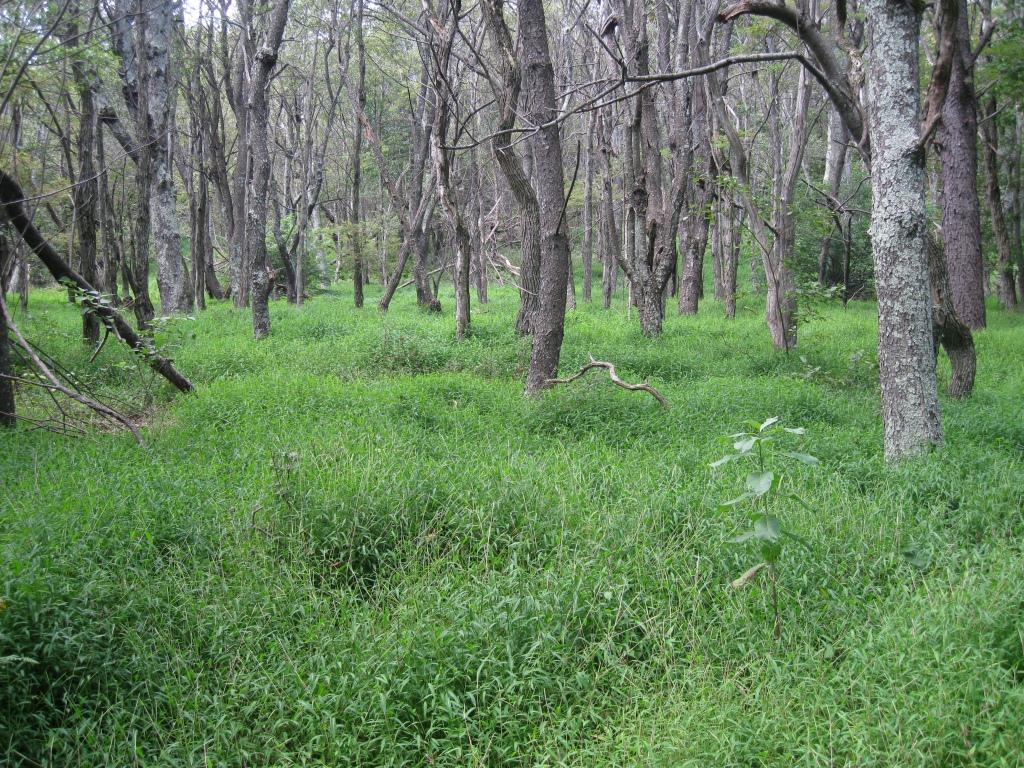
Japanese stiltgrass in Shenandoah National Park; Photo by J. Hughes

The USFS and NPS report different species to be most widespread. In the National Park Service-managed units, Japanese stiltgrass (Microstegium vimineum) was found on 30% of all plots, in more than 75% of all NPS-managed  units in the study. This magnitude comes despite the species not being found north of 41o N latitude. In forest plots inventoried by the USDA Forest Service, Japanese stiltgrass was the 14th most widespread species in the Northern region. I speculate that the species might not be common in the upper Midwest, which was not included in the NPS study. Oswalt et al. (2015) noted that Japanese stiltgrass was the 5th most common invasive plant in the Southern region.

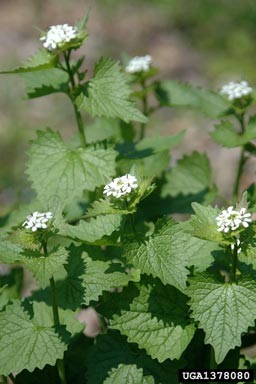
Both studies agreed that garlic mustard (Alliaria petiolata) is widespread. The NPS study found it to be the most frequently detected non-grass herbaceous species, detected in 20% of plots throughout the study area (Virginia and West Virginia to Maine). On forest plots monitored by the USFS, garlic mustard was the 3rd most frequently detected species, on 4.5% of the surveyed plots. The species is reported to be present in 36 states & 5 provinces.

Why do Studies Ignore Deliberate Planting as a Factor?

Both USFS & NPS found shrubs and vines to be highly widespread. NPS specified Japanese barberry (Berberis thunbergii), Japanese honeysuckle (Lonicera japonica), multiflora rose (Rosa multiflora), and wineberry (Rubus phoenicolasius). USFS FIA data showed multiflora rose to be the most frequently recorded invasive plant, present on 16.6% of surveyed plots. It is otherwise recorded in 39 states and 5 provinces. Multiflora rose is almost ubiquitous in some states; in Ohio it is recorded on 85% of the plots. “Roses” were reported to be the 3rd most common invasive plant in the Southern Region. Other shrubs also dominated FIA plot detections: European buckthorn was 4th most frequently detected species, present on 4.4% of survey plots; or in 34 states and 8 provinces. Its presence is highest in New York, at 16.8% of plots. If the plots invaded by the various bush honeysuckle species do not overlap, these shrubs occupy 9.5% of all surveyed plots – second to multiflora rose. The vine Japanese honeysuckle ranked 6th – present on 3.6% of survey plots across the region. Japanese honeysuckle is reported to be the most common invasive plant in the Southern region. Other shrubs ranking 12th or above included Autumn olive and Japanese barberry

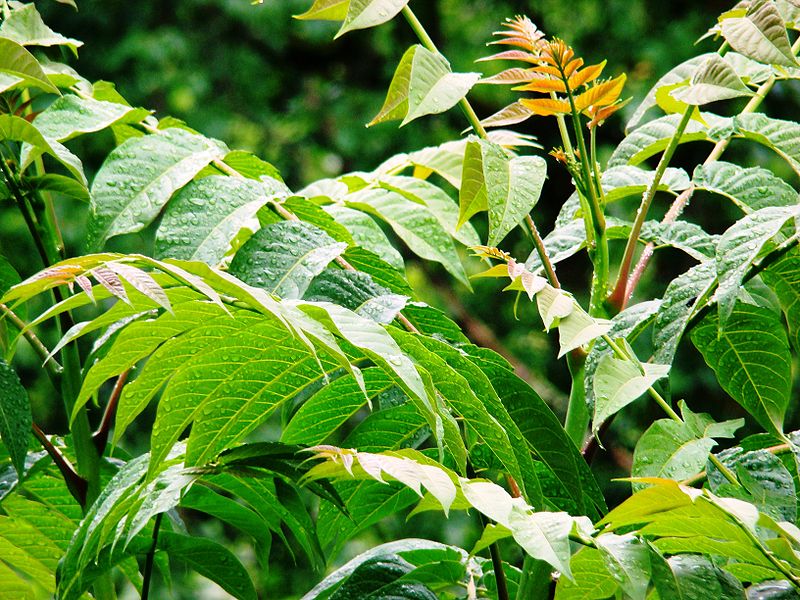
Tree-of-heaven (Ailanthus altissima) was the most common invasive tree found in National parks, again, despite not growing north of 41o N latitude. It is found in 9% of plots.

Ailanthus

I will say that I find it extremely annoying that the scientists carrying out these studies never mention that virtually all these shrub species had been deliberately planted in forests or nearby lands! Instead, they focus on such factors as histories of agriculture and other disturbances and fragmentation.  It is well documented (e.g., Lehan et al. 2013) that the vast majority of shrub species introduced to the U.S. were introduced deliberately. Furthermore, more than 500 plant species invasive in some region are being sold on-line globally.

Deliberate planting of species that turn out to be invasive is also rarely recognized in the West, e.g., Pearson et. al. There, the motivation for planting might be livestock forage or erosion control rather than wildlife habitat “enhancement” or ornamental horticulture.

I am pleased that the most recent study (Barrett and Robertson 2021) differs somewhat by noting (sometimes) both invasions by forage grasses and the appearance in the mesic forests of Pacific states such planted species as Armenian blackberry. However, while this report notes the potential that pathogens might be transported to new areas by restoration planting and “assisted migration”, it does not mention the concomitant risk of introducing plant species that might prove invasive in the naïve ecosystems.

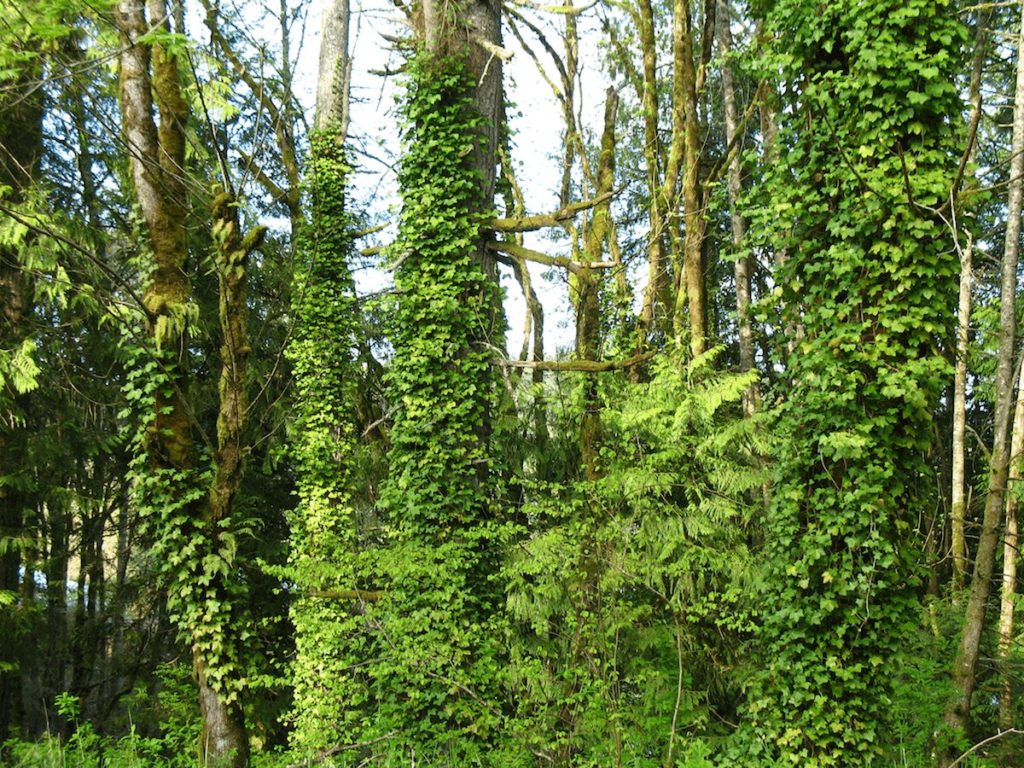
English ivy invading forest in Washington State; photo from Washington Noxious Weed Board

[Go to the earlier blogs linked here and the Western forests report for discussions of management strategies.]

Annual reports from the NPS Invasive Plant Management Teams (IPMTs; before FY19, “Exotic”, so EPMTs) provide some information about the agency’s efforts to control invasive Plants. Go to Invasive Plant Management Teams – Biological Resources Division (U.S. National Park Service) (nps.gov) . Scroll down to the short paragraph under the heading “Learn about how the teams are actively working …” This link takes you to reports from FYs 2016 – 2018. Reports from FY19 and FY20 will be added soon. Currently at FY 2019 is at https://irma.nps.gov/DataStore/Reference/Profile/2286813  & FY 2020 is at  https://irma.nps.gov/DataStore/Reference/Profile/2286814

New Information from Study of Forests in the West

Barrett and Robertson (2021) state that although invasive plants are increasing in extent and intensity in Western forests, they are usually considered to be contributing factors rather than as proximate causes. However, they note two caveats: 1) determining the ultimate causes and resulting implications of these recent increases is more difficult; and 2) data are particularly poor on plant species’ presence. Indeed, the FIA survey process link is ineffective for early detection and tactical monitoring [that is, identifying particular species in specific habitats of concern] of plant invasions.

Of the 23.4 M ha of forested lands that have experienced a disturbance over a five-year window (the time frame for FIA), only 600,000 ha was affected by the combined categories of geologic, vegetation, and other disturbances. (This is 10% of the area affected by either insects or pathogens.) Cheatgrass (Bromus tectorum) was by far the most abundant species in Western forests, covering 480,000 ha, or about 0.49%cover of all forested land in the conterminous Western United States. Because of the difficulties of surveying, Barrett and Robertson (2021) conclude that the area covered by IAS plants on the Pacific Coast and Rocky Mountains could be twice recorded values.

FIA surveys detected the highest number of non-native plant species in the forests of the continental Pacific states — 259 species. Many were grasses (although different species than in the Rockies), but shrubs and other forbs were also present. In the Rocky Mountain states the surveys detected a total of 195 non-native species, primarily grasses. FIA surveys in Hawai`i detected 136 non-native species. The most abundant was strawberry guava, which was detected on 9% of the forested area in the state. Surveys of FIA plots in coastal Alaska detected only 8 non-native plant species; common dandelion was the most abundant. Except in Hawai`i, the plants were expected to have substantially lower impacts than in eastern forests

I note that the US Geological Service (Simpson and Eyler, 2018) reports there are approximately 1,754 non-native plants in Hawai`i and 424 in Alaska. Not all are necessarily invasive. And the USGS study covered all of Alaska, not just the southeastern coastal region.

Barrett and Robertson (2021) found that plant invasions are less extensive in older forest stands, mesic stands in contrast to drier areas and those with sparse or open tree canopies, and farther from roads. Thus, invasive plant cover was higher in hardwood and low-elevation and dry conifer forest types than in high-elevation and moist conifer types. In Hawai`i, mean plant cover was more than 40 % in all forest types except cloud forest, where it was 7.8 %. Again, proximity to roads was mentioned in the context of the likelihood of disturbance but no mention was made of the fact that households and businesses (e.g., tourist facilities, even agency facilities!) might deliberately introduce plants – e.g., horticulture.

Barrett and Robertson (2021) expect the impacts of NIS plants on forest lands to increase in the future, due to both additional introductions (despite efforts to prevent such) and spread of established species. They note that every disturbance creates an opportunity for the many ruderal and graminoid species to establish – facilitated by their abundance nearby. They note the significant challenge presented by secondary invaders, which often respond to space made available by “weed control” projects better than natives.

I welcome their concern about shade-tolerant plants apparently increasing in wetter areas of the Pacific coast states. They note that the presence of non-native plants in a forest is less obvious, and the impacts might be more subtle, perhaps primarily affecting tree regeneration through competition or other effects (e.g., promoting fire). Barrett and Robertson (2021) note that many of the shade-tolerant non-native species abundant in temperate Eastern U.S. forests (e.g., garlic mustard) are present in the West and are likely to become important.

SOURCES

Barrett, T.M. and G.C. Robertson, Editors. 2021. Disturbance and Sustainability in Forests of the Western US. USDA Forest Service Pacific Northwest Research Station. General Technical Report PNW-GTR-992

March 2021

Simpson, A., and Eyler, M.C., 2018, First comprehensive list of non-native species established in three major regions of the United States: U.S. Geological Survey Open-File Report 2018-1156, 15 p., https://doi.org/10.3133/ofr20181156.

ISSN 2331-1258 (online)

Posted by Faith Campbell

We welcome comments that supplement or correct factual information, suggest new approaches, or promote thoughtful consideration. We post comments that disagree with us — but not those we judge to be not civil or inflammatory.

For a detailed discussion of the policies and practices that have allowed tree-killing pests to enter and spread – and that do not promote effective restoration strategies – review the Fading Forests report at http://treeimprovement.utk.edu/FadingForests.htm  (These reports do not discuss invasive plants.)
On the Rise: US Imports & the Risks of Tree-killing Pests

containers at Port of Long Beach; photo courtesy of Bob Kanter, Port of Long Beach

Here I update information on two of the major pathways by which tree-killing pests enter the United States: wood packaging and living plants (plant for planting).

Wood Packaging

Looking at wood packaging material, we find rising volumes for both shipping containers – and their accompanying crates and pallets; and dunnage.

Crates and pallets – Angell (2021; full citation at the end of the blog) provides data on North American maritime imports in 2020. The total number of TEUs [a standardized measure for containerized shipment; defined as the equivalent of a 20-foot long container] entering North America was 30,778,446.U.S. ports received 79.6% of these incoming containers, or 24,510,990 TEUs. Four Canadian ports handled 11.4% of the total volume (3,517,464 TEUs; four Mexican ports 8.9% (2,749, 992 TEU). Angell provides data for each of the top 25 ports, including those in Canada and Mexico.

To evaluate the pest risk associated with the containerized cargo, I rely on a pair of two decade-old studies.  Haack et al. (2014) determined that approximately 0.1% (one out of a thousand) shipments with wood packaging probably harbor a tree-killing pest. Meissner et al. (2009) found that about 75% of maritime shipments contain wood packaging. Applying these calculations, we estimate that 21,000 of the containers arriving at U.S. and Canadian ports in 2020 might have harbored tree-killing pests.

While the opportunity for pests to arrive is obviously greatest at the ports receiving the highest volumes of containers with wood packaging, the ranking (below) does not tell the full story. The type of import is significant. For example, while Houston ranks sixth for containerized imports, it ranks first for imports of break-bulk (non-containerized) cargo that is often braced by wooden dunnage (see below). Consequently, Houston poses a higher risk than its ranking by containerized shipment might indicate.

Also, Halifax Nova Scotia ranks 22nd for the number of incoming containerized shipments (258,185 containers arriving). However, three tree-killing pests are known to have been introduced there: beech bark disease (in the 1890s), brown spruce longhorned beetle (in the 1990s), and European leaf-mining weevil (before 2012) [Sweeney, Annapolis 2018]

The top ten ports receiving containerized cargo in 2020 were

Port                                         2020 market share                2020 TEU volume

Los Angeles                           15.6%                                      4,652,549

Long Beach                            13%                                         3,986,991

New York/New Jersey         12.8%                                      3,925,469

Savannah                             7.5%                                        2,294,392

Vancouver BC                        5.8%                                        1,797,582

Houston                                   4.2%                                        1,288,128

Manzanillo, MX                      4.1%                                        1,275,409

Seattle/Tacoma    4.1%                                        1,266,839

Virginia ports                        4.1%                                        1,246,609

Charleston                             3.3%                                        1,024,059

Import volumes continue to increase since these imports were recorded. U.S. imports rose substantially in the first half of 2021, especially from Asia. Imports from that content reached 9,523,959 TEUs, up 24.5% from the 7,649,095 TEUs imported in the first half of 2019. The number of containers imported in June was the highest number ever (Mongelluzzo July 12, 2021).

Applying the calculations from Haack et al. (2014) and Meissner et al. (2009) to the 2021 import data, we find that approximately 7,100 containers from Asia probably harbored tree-killing pests in the first six months of the year. (The article unfortunately reports data only for Asia.) Industry representatives quoted by Mongelluzzo expect high import volumes to continue through the summer. This figure also does not consider shipments from other source regions.

Dunnage on the pier at Port of Houston; photo by Port of Houston

Infested dunnage – Looking at dunnage, imports of break-bulk (non-containerized) cargo to Houston – the U.S. port which receives the most – are also on the upswing. Imports in April were up 21% above the pandemic-repressed 2020 levels.

Importers at the port complain that too often the wooden dunnage is infested by pests, despite having been stamped as in compliance with ISPM#15. CBP spokesman John Sagle confirms that CBP inspectors at Houston and other ports are finding higher numbers of infested shipments. CBP does not release those data, so we cannot provide exact numbers (Nodar, July 19, 2021).

The Houston importers’ suspicion has been confirmed by data previously provided by CBP to the Continental Dialogue on Non-Native Insects and Diseases. From Fiscal Year 2010 through Fiscal Year 2015, on average 97% of the wood packaging (all types) found to be infested bore the stamp. CBP no longer provides data that touch on this issue.

Detection of pests in the dunnage leads to severe problems. Importers can face fines up to the full value of the associated cargo. Often, the cargo is re-exported, causing disruption of supply chains and additional financial losses (Nodar, July 19, 2021).

In 2019 importers and shippers from the Houston area formed an informal coalition with the Cary Institute of Ecosystem Studies to try to find a solution to this problem. The chosen approach is for company employees to be trained in CBP’s inspection techniques, then apply those methods at the source of shipments to identify – and reject – suspect dunnage before the shipment is loaded.  In addition, the coalition hopes that international inspection companies, which already inspect cargo for other reasons at the loading port will also be trained to inspect for pests.  Steps to set up such a training program were interrupted by the COVID-19 pandemic, but are expected to resume soon (Nodar, July 19, 2021).

Meanwhile, the persistence of pests in “treated” wood demands answers to the question of “why”. Is the cause fraud – deliberate misrepresentations that the wood has been treated when it has not? Or is the cause a failure of the treatments – either because they were applied incorrectly or they are inadequate per se?

ISPM#15 is not working adequately. I have said so.  Gary Lovett of the Cary Institute has said so (Nodar July 19, 2021). Neither importers nor regulators can rely on the mark to separate pest-free wood packaging from packaging that is infested.

APHIS is the agency responsible for determining U.S. phytosanitary policies. APHIS has so far not accepted its responsibility for determining the cause of this continuing issue and acting to resolve it. Preferably, such detection efforts should be carried out in cooperation with other countries and such international entities as the International Plant Protection Convention (IPPC) and International Union of Forest Research Organizations (IUFRO). However, APHIS should undertake such studies alone, if necessary.

In the meantime, APHIS and CBP should assist importers who are trying to comply by facilitating access to information about which suppliers often supply wood packaging infested by pests. The marks on the wood packaging includes a code identifying the facility that carried out the treatment, so this information is readily available to U.S. authorities.

Plants for Planting

A second major pathway of pest introduction is imports of plants for planting. Data on this pathway are too poor to assess the risk – although a decade ago it was found that the percentage of incoming shipments of plants infested by a pest was 12% – more than ten times higher than the proportion for wood packaging (Liebhold et al. 2012).

According to APHIS’ annual report, in 2020 APHIS and its foreign collaborators inspected 1.05 billion plants in the 23 countries where APHIS has a pre-clearance program. In other words, these plants were inspected before they were shipped to the U.S.  At U.S. borders, APHIS inspected and cleared another 1.8 billion “plant units” (cuttings, rooted plants, tissue culture, etc.) and nearly 723,000 kilograms of seeds. Obviously, the various plant types carry very different risks of pest introduction, so lumping them together obscures the pathway’s risk. The report does not indicate whether the total volume of plant imports rose or fell in 2020 compared to earlier years.

SOURCES

Angell, M. 2021. JOC Rankings: Largest North American ports gained marke share in 2020. June 18, 2021. https://www.joc.com/port-news/us-ports/joc-rankings-largest-north-american-ports-gained-market-share-2020_20210618.html?utm_campaign=CL_JOC%20Port%206%2F23%2F21%20%20_PC00000_e-production_E-103506_TF_0623_0900&utm_medium=email&utm_source=Eloqua

Haack R.A., Britton K.O., Brockerhoff, E.G., Cavey, J.F., Garrett, L.J., et al. (2014) Effectiveness of the International Phytosanitary Standard ISPM No. 15 on Reducing Wood Borer Infestation Rates in Wood Packaging Material Entering the United States. PLoS ONE 9(5): e96611. doi:10.1371/journal.pone.0096611

Liebhold, A.M., E.G. Brockerhoff, L.J. Garrett, J.L. Parke, and K.O. Britton. 2012. Live Plant Imports: the Major Pathway for Forest Insect and Pathogen Invasions of the US. www.frontiersinecology.org

Meissner, H., A. Lemay, C. Bertone, K. Schwartzburg, L. Ferguson, L. Newton. 2009. Evaluation of Pathways for Exotic Plant Pest Movement into and within the Greater Caribbean Region. A slightly different version of this report is posted at 45th Annual Meeting of the Caribbean Food Crops Society https://econpapers.repec.org/paper/agscfcs09/256354.htm

Mogelluzzo, B. July 12, 2021. Strong US imports from Asia in June point to a larger summer surge.

Nodar, J. July 19, 2021. https:www.joc.com/breakbulk/project-cargo/breakbult-volume-recovery-triggers-cbp-invasive-pest-violations_20210719.htm 

Posted by Faith Campbell

We welcome comments that supplement or correct factual information, suggest new approaches, or promote thoughtful consideration. We post comments that disagree with us — but not those we judge to be not civil or inflammatory.

For a detailed discussion of the policies and practices that have allowed these pests to enter and spread – and that do not promote effective restoration strategies – review the Fading Forests report at http://treeimprovement.utk.edu/FadingForests.htm
USFS report: treatment of introduced forest pests

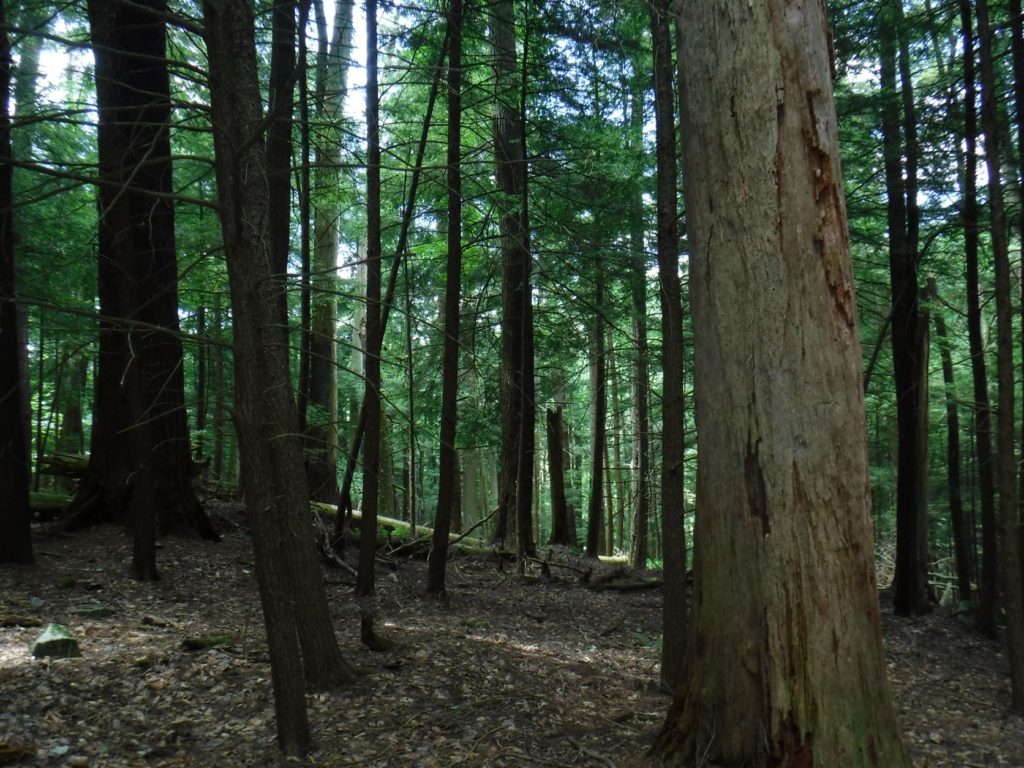
still-healthy hemlocks in Cook Forest State Park, PA; photo by F.T. Campbell

In February the USFS published a lengthy analysis of invasive species: Invasive Species in Forests and Rangelands of the United States. A Comprehensive Science Synthesis for the US Forest Sector (Poland et al. 2021; full citation at the end of the blog). The book is available for download at no cost here.

In a separate blog, I evaluated several aspects of the report as they apply to invasive species generally. Here I focus on invasive insects and pathogens that attack North American tree species (that is, forest pests).

As I said in the separate blog, I doubt that the book will stimulate policy-makers to increase Forest Service resources allocated to invasive species research, much less management. Sections 14.5 and 16.5 of the report state that the continued absence of a comprehensive investigation of the impacts of invasive species, especially the full value of ecosystem services lost, is a barrier to policymakers seeking to develop priorities and realistic management strategies.

I think the book’s editors tried to provide as much information about impacts as possible given existing knowledge. But the book’s length, comprehensive inclusion of all bioinvaders, organizational structure, and the detailed discussions of theories and models reduce the contribution the book might make to management decisions. I did not find “lessons learned” that could be applied in the policy realm. 

Chapters address impacts in terrestrial and aquatic systems; impacts on ecosystem processes; impacts on various sectors of the economy and cultural resources; interactions with climate change and other disturbances; management strategies for species and landscapes; tools for inventory and management. Each chapter evaluates the current status of knowledge about the topic and suggests research needs. There are also summaries of the invasive species situation in eight regions.

The choice to organize the book around the chapters listed above means that some information one might expect to find in a book about invasive species is scattered or even absent. This is not a good resource for concise descriptions of individual invasive species and their impacts. That information is scattered among the chapters depending on whether some aspect of the species was chosen to illustrate a scientific challenge or success. The regional summaries partially remedy this problem – but they do not provide perspective on organisms that have invaded more than one region, e.g., emerald ash borer or white pine blister rust. To some extent, information about individual species is provided in the several subchapters on forest insects and pathogens. Or the reader of the PDF version can use the word search function!

Of course, information on several individual high-profile bioinvaders can be found in other publications; see the species write-ups and references posted at www.dontmovefirewood.org. Under these circumstances, a description of invasive species impacts from the ecosystem perspective is a welcome addition. I have long wished for a “crown to root zone” description of invasive species’ impacts.

HWA-killed hemlocks in Linville Gorge, NC; photo by Steven Norman, USFS

In this blog, I will focus on issues that the report raises that I found most interesting.

Information in the Report on Invasive Insects & Pathogens that Attack North American Trees

At several places the report states that non-native pests that have the potential to threaten the survival of an entire tree genus should be a high priority (p. 136) (what actions should be prioritized are not specified). They name the emerald ash borer (EAB) and Dutch elm disease. Elsewhere, EAB and hemlock woolly adelgid (HWA) are described as among the most significant threats to forests in the Eastern U.S. While EAB and HWA have certainly received considerable attention from the Forest Service, threats to elm have not. (I regret that the timing of the report precluded reference to Kevin Potter’s priority-setting publication. Potter is not listed as a co-author of the book.)

Hemlock woolly adelgid, emerald ash borer, chestnut blight, white pine blister rust (WPBR), and laurel wilt are cited as examples of highly virulent, host-specific agents that kill dominant, abundant, and ecologically unique hosts (p.18), resulting in exceptionally severe long-term impacts. WPBR and HWA specifically can have profound and far-reaching negative effects on ecosystem structure and function. These can rise to the level of an irreversible change of ecological state (p. 97). Of this list, no federal agency has allocated many resources to efforts to slow the spread of laurel wilt. The Forest Service is certainly tracking its spread and impacts.

Exaggerations or Errors

I think the report exaggerates the level of resources allocated to host resistance breeding. The report mentions programs targetting Dutch elm disease, beech bark disease, EAB, HWA and laurel wilt. It describes programs for white pines and Port-Orford cedar as examples of success. However, I would say that all the programs, except American chestnut, are starved for funds and other resources. The report’s authors concede this on p. 195.

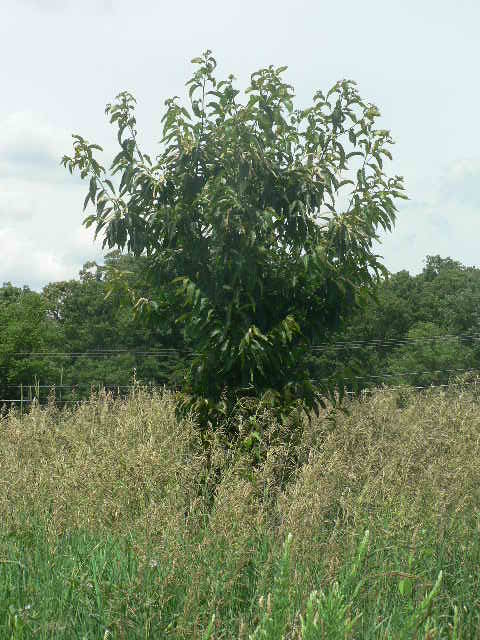
TACF American chestnut in field trial; photo by F.T. Campbell

I think the report is too optimistic about the efficacy – so far – of biocontrol agents targeting HWA & EAB. On the other hand, I appreciate the report’s recognition that application of augmentative biocontrol of the Sirex woodwasp is more complicated in North America than in Southern Hemisphere countries (p. 162).

I am concerned about the statement that many plant pathogens are transported, but few have major impact. Examples in the U.S. are said to be WPBR, chestnut blight, and Phytophthora ramorum (p. 97). However, the report does not mention laurel wilt – which has a broad host range; nor rapid ‘ōhi‘a death — which threatens the most widespread tree species on the Hawaiian Islands. Nor does it mention several pathogens attacking single tree species, including beech bark disease, Port-Orford cedar root disease, and butternut canker. The report was written before recognition of beech leaf disease. The report notes that the three diseases it did mention have huge impacts. I am greatly disappointed that the report does not address how scientists and managers should deal with this “black swan” problem other than long discussions of data gaps, and ways to improve models of introduction and spread.

In addition, I am concerned that the discussion of economic factors that influence trade flows and accompanying invasive species (p. 308) focusses too narrowly on inspection alone, rather than other strategies for curtailing introduction. This section also shortens a description of the point made in Lovett et al. (2016). The report notes that Lovett et al. (2016) say that rates of introduction of wood-boring species decreased after ISPM#15 was implemented. However, the report leaves out the major caveat in that paper and the studies by Haack et al. (2014) and Leung et al. (2014) on which it is based: the reduction was insufficient to protect America from damaging introductions! [A further error has crept in: the Haack study explicitly excluded imports from China from their calculations. The Lovett paraphrase is not really clear on this matter.]

Curiosities/Concerns Re: Regional Write-Ups

I wish the sections on the Northwest and Southwest region discussed why areas with so many characteristics favoring introduction of plant pests – major ports, extensive transportation networks, major horticultural industry, extensive agriculture, and abundant urban and native forests – have so few damaging forest pests. (Admittedly, those present are highly damaging: white pine blister rust, sudden oak death, Port-Orford cedar root disease, pitch canker, balsam woolly adelgid, larch casebearer, polyphagous shot hole borer (I add Kuroshio shot hole borer), and banded elm bark beetle). The report does mention the constant threat of introduction of the European and Asian gypsy moths. (The Entomological Society of America has decided to coin a new common name for these insects; they currently to be called by the Latin binomial Lymatria dispar). The report notes that 22 species of non-native bark and ambrosia beetles have recently been introduced in the Southwest.

The report cites a decade-old estimate by Aukema et al. (2010) in saying that a small proportion of introduced pest species has killed millions of trees or pushed ecologically foundational species toward functional extinction. The figure was 14% of the more than 450 non-native forest insect species. I greatly regret that overlapping preparation and publication periods precluded inclusion of data from studies by Potter, Guo, and Fei.  http://nivemnic.us/what-fia-data-tell-us-about-non-native-pests-of-americas-forests/

Section 7.3 of the report discusses frameworks for setting priorities. It identifies five factors: 1) pest species having the greatest negative impacts; 2) uniqueness of the affected ecosystem or community; 3) state of the invasion in space and time; 4) management goals; 5) availability of effective tools. Examples of species meeting these criteria include EAB and Dutch elm disease (pest threatens entire host genus); white pine blister rust on whitebark pine (key species in a system with low arboreal diversity).

The report notes increasing understanding of critical aspects of several important pests’ biology and host interactions – but it does not sufficiently acknowledge the decades of effort required to achieve this knowledge. The time required for additional scientific advances will probably be equal or greater, given falling number of “ologists” in government and academia.

I appreciate inclusion of a discussion (Sections 8.3.1 and 8.3.2) on breeding trees resistant to introduced pests

dead Port-Orford cedar in Redwoods National Park; photo by Richard Sniezko, USFS

This section states that host resistance, forest genetics, and tree improvement might be the most effective approaches to managing many established pests. The section says such breeding does not require the use of genetically modified organisms, although transgenic or gene editing technologies can provide useful tools. I appreciate the report conceding that necessary infrastructure and expertise has been declining for two decades (p. 195).

In discussing international cooperation to reduce transport of invasive species, the report refers to increasing availability of data allowing identification of potentially damaging species in their regions of origin. Again, since this chapter was written, the Forest Service has increased its engagement on this approach: the USFS International Program is supporting sentinel plantings managed by the International Plant Sentinel Network (http://www.plantsentinel.org) … see my recent blog here.

SOURCE

Poland, T.M., P. Patel-Weynand, D.M Finch, C.F. Miniat, D.C. Hayes, V.M Lopez, editors. 2021. Invasive Species in Forests and Rangelands of the United States. A Comprehensive Science Synthesis for the US Forest Sector. Springer

Posted by Faith Campbell

We welcome comments that supplement or correct factual information, suggest new approaches, or promote thoughtful consideration. We post comments that disagree with us — but not those we judge to be not civil or inflammatory.

For a detailed discussion of the policies and practices that have allowed these pests to enter and spread – and that do not promote effective restoration strategies – review the Fading Forests report at http://treeimprovement.utk.edu/FadingForests.htm
“Rule of Tens” – Time to Refine It

are wood-borers examples of species more likely to “proceed through the steps of invasion” than the theory suggests?

Much of the literature about biological invasion has relied on the “tens rule”. First enunciated in the mid-1990s by Williamson and Fitter (1996), it was actually conceived a decade earlier by Williamson and Brown (1986).

The “tens rule” hypothesizes that about 10% of all species transported to a new environment will be released or escape and become introduced species. Subsequently, 10% of those introduced species establish viable populations in the wild. Finally, about 10% of the established species become highly damaging. That is, 1% of the number originally transported to the new environment is a highly damaging invader.

Is the “tens rule” supported by evidence?

Empirical support for the hypothesis has been mixed; the number of studies questioning it has increased over the decades (Jeschke and Pyšek 2018). So Jeschke and Pyšek (2018) decided to evaluate the basis for the hypothesis. First, they divided the hypothesis into two sub-hypotheses so they could separate the concept of impact from the process of introduction, establishment, and spread. They justified this separation by noting that novel species can have an impact at any stage. The two sub-hypotheses:

1st sub-hypothesis: At each of the three transitions between the invasion stages listed here the number of species completing the transition is reduced by 90% (invasion tens rule).

  • transport to exotic range

transition

  • introduction (release or escape into the environment)

transition

  • establishment of a least one self-sustaining population

transition

  • spread

2nd sub-hypothesis: about 10% of established non-indigenous species cause a significant detrimental impact. This sub-hypothesis applies to the transition from establishment (iii, above) to significant impact (iv). Stepping back to the earlier introduction, so as to consider the situation overall, about 1% of all introduced non-native species cause a significant detrimental impact; this sub-hypothesis thus relates to the transition from introduction (ii) to significant impact (iv).

Jeschke and Pyšek carried out a quantitative meta-analysis of 102 empirical tests of the tens rule drawn from 65 publications. They found no support for the “invasion tens rule”. Indeed, their analysis found that about 24% of non-native plant and 23% of non-native invertebrate species are successful in taking consecutive steps of the invasion process. Among non-native vertebrates, about 51% are successful in taking consecutive steps of the invasion process.

The “impact tens rule” is also not supported by currently available evidence. However, Jeschke and Pyšek decided that more data are needed before a reasonable alternative hypothesis can be formulated.

Findings

Jeschke and Pyšek state that the “tens rule” is not based on a model or other defensible concept. It is also hampered by confusion of terms. Thus, different authors define the invasion process differently. Particularly confounding is the mixing of “impact” with steps in the invasion process. At the same time, there have been few studies of the “impact tens rule” hypothesis.

Finally, the “tens rule’s” predictions are not adjusted to consider changes in temporal and spatial scales. That is, it does not recognize that more invaders will be detected in any given place during more recent times than in the past. Furthermore, more invaders will find suitable niches in large areas than small.

The note that analysis is hampered by the paucity of reliable data about establishment success – especially for taxa other than mammals and birds. They do not discuss how this lack might affect efforts to analyze proportions of entering species that succeed in becoming invasive, especially among the small and inconspicuous taxa such as insects and fungal organisms that concern thus of us that focus on threats to forests. This same data gap has limited other studies as well; see, for example, Aukema et al. (2010) – who restricted their discussion of pathogens to “high impact” species.

Although Jeschke and Pyšek (2018) do not specify which studies they relied on to determine the proportion of successful invaders among species belonging to particular taxa, it seems likely that they relied principally on Vila et al. (2010) in determining that on average 25% invertebrates that are introduced (that is, proceed to the second stage in the process given above) become invasive. Vila et al. analyze introductions to Europe. They found that 24.2% of terrestrial invertebrates caused recognized economic impacts.

Jeschke and Pyšek (2018) Results and Discussion

Considering the “invasion tens rule”, two-thirds of the empirical tests in the dataset focused on the “invasion tens rule”. The majority of these focused on the transition from introduction to establishment (the transition from (ii) to (iii). The observed average percentage of species making this transition is more than 40% – or greater than four times larger than the “tens rule’s” prediction.

At the next transition, from establishment to spread (from iii to iv), the observed percentage of species making the transition is  greater than 30% – or greater than three times the predicted value under the “tens rule”.

Considering the “impact tens rule”, on average a quarter of established non-indigenous species have a significant detrimental impact, which is again significantly more than the 1 out of 10 species predicted by the rule. Specifically by taxon, 18% of established plants have shown detrimental impacts. Among invertebrates and vertebrates that estimate is greater than 30%. All these observations are higher than predicted by the rule. However, sample sizes are low so more studies are needed to test whether these values hold true.

Regarding the fullest possible extent of the invasion process, 16 out of 100 species that were introduced (stage ii) had a significant impact. This is 16 times greater than the 1% predicted by the “tens rule”. Considering specific taxa, 6% of established plants and 15% of established invertebrates had a significant impact. Data were too poor to support an evaluation for vertebrates.

I note that the alarmingly high “impact” estimates for invertebrates are probably biased by scientists’ and funding entities’ lack of interest in species that don’t cause noticeable impacts.

Poor data preclude an analysis of the transition from transport (i) to introduced (ii).

Strengthening The Estimates

Might these introduction and impact estimates be tightened by analysis of additional sources, such as the studies led Seebens, forest pest impact analyses by Potter et al. (2019) and Fei (2019) and reviews of pest introduction numbers by Haack and Rabaglia (2013)? 

Is it worth pursuing efforts to refine the Jeschke and Pyšek (2018) estimates? I think it is. An underestimation of the risk of introduction might lead decision-makers to downplay the need for a response.

Some scientists have accepted the new “rule of 25” (Schulz, Lucardi, and Marsico. 2021. Full citation at end of blog; also cited by USFS report – Poland et al. 2021). Others have not. Venette and Hutchison (2021; full reference at end of blog) continue to cite the estimate of approximately one “invasion success” for every 1,000 attempts – that is, a low-probability, high-consequence event. This challenges those responsible for managing invasive species.

Or are there other conundrums of introduction, establishment, and predicting impacts that have more direct relationship to improving programs? I note that the recent Forest Service report on invasive species (Poland et al. 2021) does not address the “rule of tens”.

Other Reasons Why Bioinvasion Damage is Underestimated

Jaric´ and G. Cvijanovic´ (2012) note that scientists lack a full understanding of ecosystem functioning, so they probably often miss more subtle – but still important – impacts.

Jeschke and Pyšek (2018) note that the percentage of introduced or established species with a quantifiable impact is not always the most important information. A single introduced species can have devastating impact by itself. They cite the amphibian disease chytrid (Batrachochytrium dendrobatidis) and such mammals as rats and cats.

SOURCES

Aukema, J.E., D.G. McCullough, B. Von Holle, A.M. Liebhold, K. Britton, & S.J. Frankel. 2010. Historical Accumulation of Nonindigenous Forest Pests in the Continental United States. Bioscience. December 2010 / Vol. 60 No. 11

Brockerhoff, E.G. and A. M. Liebhold. 2017. Ecology of forest insect invasions. Biol Invasions (2017) 19:3141–3159

Fei, S., R.S. Morin, C.M. Oswalt, and A.M. Liebhold. 2019. Biomass losses resulting from insect and disease invasions in United States forests. Proceedings of the National Academy of Sciences of the United States of America, 12 Aug 2019, 116(35):17371-17376

Haack, R.A. and R.A. Rabaglia. 2013 Exotic Bark and Ambrosia Beetles in the USA: Potential and Current Invaders. CAB International. 2013. Potential Invasive Pests of Agricultural Crops (ed. J. Pena)

Jaric´, I. and G. Cvijanovic´. 2012. The Tens Rule in Invasion Biology: Measure of a True Impact or Our Lack of Knowledge and Understanding? Environmental Management (2012) 50:979–981 DOI 10.1007/s00267-012-9951-1

Jeschke J.M. and P. Pyšek. 2018. Tens Rule. Chapter 13 of book by CABI posted at http://www.ibot.cas.cz/personal/pysek/pdf/Jeschke,%20Pysek-Tens%20rule_CABI%202018.pdf

Poland, T.M., Patel-Weynand, T., Finch, D., Miniat, C. F., and Lopez, V. (Eds) (2019), Invasive Species in Forests and Grasslands of the United States: A Comprehensive Science Synthesis for the United States Forest Sector. Springer Verlag. (in press).

Potter, K.M., M.E. Escanferla, R.M. Jetton, G. Man, and B.S. Crane. 2019. Prioritizing the conservation needs of United States tree species: Evaluating vulnerability to forest insect and disease threats. Global Ecology and Conservation. (2019)

Schulz, A.N., R.D. Lucardi, and T.D. Marsico. 2021. Strengthening the Ties That Bind: An Evaluation of Cross-disciplinary Communication Between Invasion Ecologists and Biological Control Researchers in Entomology. Annals of the Entomological Society of America · January 2021

Seebens, H., T.M. Blackburn, et al. 2018. Global rise in emerging alien species results from increased accessibility of new source pools. www.pnas.org/cgi/doi/10.1073/pnas.1719429115

Vilà, M., C. Basnou, P. Pyšek, M. Josefsson, P. Genovesi, S. Gollasch, W. Nentwig, S. Olenin, A. Roques, D. Roy, P.E. Hulme and DAISIE partners. 2010. How well do we understand the impacts of alien spp on ecosystem services? A pan-European, cross-taxa assessment. Frontiers in Ecology and the Environment, Vol. 8, No. 3 (April 2010), pp. 135-144

Venette R.C. and W.D. Hutchison. 2021. Invasive Insect Species: Global Challenges, Strategies & Opportunities. Front. Insect Sci.1:650520. doi: 10.3389/finsc.2021.650520

Williamson M.H. and K.C. Brown. 1986. The analysis and modelling of British invasions. Philosophical Transactions of the Royal Society of London Series B 314:505–522

Williamson M. and A. Fitter. 1996 The varying success of invaders. Ecology 77(6):1661–1666

Early Warning Systems – Are They Helping Prevent Introductions?

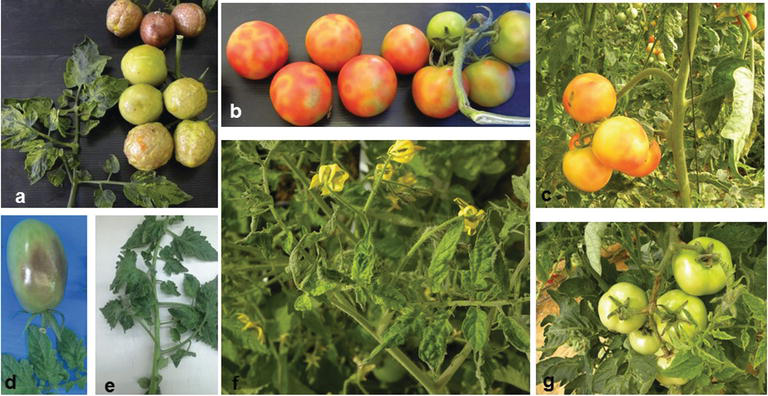
symptoms of tomato brown rugose fruit virus; Wikimedia

The US Department of Agriculture (USDA) is making efforts to strengthen pest prevention by setting up “early warning” systems. As part of this effort, the USDA-funded regional Integrated Pest Management Center in Raleigh, NC, has published a review of existing systems. These are intended to inform national phytosanitary agencies, such as APHIS, about pest species that might pose a threat to natural or agricultural resources. The ultimate goal is providing information that empowers the agency to enact effective preventive measures. [Noar et al. 2021. A full reference to the study is posted at the end of this blog.]

The review looked at six early warning systems’ goals, as well as their procedures for obtaining and disseminating information about potential threats. With one exception, these systems focus on plant pests.

The review did not undertake a rigorous analysis of the various programs’ efficacy.

The article points to the high economic costs associated with invasive plant pests. As a consequence of the huge volume of international trade – which is the principal vector of plant pests’ introduction – national phytosanitary agencies need information on which pests are moving most frequently, and on what commodities, so they can target the most risky pathways. The early warning systems are intended to do this before the pests are introduced to a new region. The several systems use different methodologies and criteria to identify such potential pests. They also are intended to raise awareness about high risk pests and pathways – but for different audiences.

Several of the early warning systems were set up and are managed by national phytosanitary agencies or their regional organizations. These include PestLens and the EPPO and NAPPO alert systems (described below).  The article notes that these systems usually do not report diseases for which the causal agent has not been identified, because identification of the pathogen species is typically necessary before regulations can be adopted – and these are regulatory organizations. The authors do not analyze whether this constraint reduces the systems’ ability to provide timely warnings.

1. PestLens     

PestLens is an early warning system set up by APHIS. It therefore focuses on pests that might become quarantine pests – that is, subject to regulation under terms of the Plant Protection Act. Such pests must pose a defined threat to US agricultural and natural resources. PestLens monitors more than 300 sources, including scientific journals, reports from national phytosanitary agencies, Google alerts, newspapers, e-mail lists and other plant-health-related websites. PensLens staff evaluate the information for relevance to APHIS based on: a) whether the information is new to APHIS; b) whether the plant pest is of quarantine significance to the US; c) its potential economic impact if introduced; d) the likelihood of a pathway for introduction; and e) the likelihood that action by APHIS might be needed to prevent its introduction. Information considered relevant includes indication that a pest is associated with a previously unknown host, has been detected in a new location, or has been eradicated from a country. The information has not necessarily been confirmed by the country (warning included in PestLens notices).

When the PestLens criteria are met, the analysts write a brief article including the new information and any existing background, such as previously known host range and distribution. These articles are compiled into a weekly e-mail notification sent to PPQ employees and thousands of other subscribers. They are also archived on the PestLens website. APHIS staff evaluate the information and make decisions as to whether some regulatory action is appropriate.

I am puzzled because some of the five criteria appear to require a pest risk analysis. Pest risk analysis is a complex task that I do not believe PestLens is equipped to carry out – certainly not as quickly as is required by an alert system.

Update

A review of PestLens (Meissner et al. 2015; full citation at end of the blog) describes the system more fully. It found that during the period October 2012 – October, 2014, 73% of PestLens articles were based on articles in scientific journals; 17% on federal, state, or regional governmental sources; 8% fon news media sources; and 3% on other sources. The principal government pest reports used were from the web sites of IPPC, EPPO & NAPPO.

The majority of PestLens articles reporting new locations, interceptions, and new hosts came from journals. New pest descriptions, new reports of an organism as a pest, and articles on research of interest came exclusively from journals. Articles on pest detections, outbreaks, and eradications came largely from government sources.

Meissner et al. analyzed APHIS’ response to PestLens notices. They said that certain APHIS actions, such as the implementation of official control programs, initiation of research activities, or the formation of specliazed task groups were not captured in this analysis. They found that over a ten month period in 2014, APHIS used the PestLens notices to update its pest databases 350 times; updated pest datasheets or pest profiles on the PPQ website 16 times; evaluated a pest’s regulatory status (e.g., prepared a risk assessment) 11 times; and revised its regulations 4 times.

Meissner et al. consider that it is vital to maintain up-to-date databases, especially regarding pest host and distribution ranges. Another benefit from the PestLens system is a set of metrics to improve accountability, for example identifying duplication of efforts and providing permanent records of when actions are taken (or declined) and the rationale.  

2. EPPO Alert List and EPPO Reporting Service  

The European and Mediterranean Plant Protection Organization (EPPO) has 52 member countries stretching from Russia and Uzbekistan to Spain, Algeria, and Morocco, and including their off-shore islands. EPPO maintains a pest Alert List of species chosen by the EPPO Secretariat based on the scientific literature and suggestions by member’s phytosanitary agencies. Factors leading to a listing include newly described pests, reports of spread to new geographical locations, and reports of major outbreaks in the EPPO region. Each listed pest has a fact sheet which contains known hosts and distribution, the type of damage, the mode of dissemination, and potential pathways for spread. Some pests are selected for pest risk analysis (PRA). Once the PRA is completed, the pest might be placed on the EPPO A1/A2 lists, which are species recommended for regulation by the member states. Pests not selected for PRA stay on the EPPO Alert List temporarily, typically three years, then their information is archived.

The EPPO Secretariat also publishes a monthly Reporting Service newsletter, which details phytosanitary events that might threaten the EPPO region, including both officially designated quarantine pests as well as emerging ones. Information includes new hosts, new geographical locations, new pests, and new identification and detection methods.  

3. NAPPO Phytosanitary Alert System  

The North American Plant Protection Organization (NAPPO) comprises Canada, the United States and Mexico. It has a web-based alert system that provides official pest reports from member countries. NAPPO also puts out Emerging Pest Alerts that contain news about plant pests and pathogens not established in this region. Sources are public, including scientific journals, newspapers, records from port interceptions, and domestic plant pest surveys. Generally NAPPO does not confirm its reports with the corresponding country’s phytosanitary agency.

4. IPPC Pest Reports

The International Plant Protection Convention (IPPC) has been ratified by more than 180 countries. The member countries’ phytosanitary agencies submit official pest reports concerning the occurrence, outbreak, spread, or eradication of organisms that are quarantine pests in that country or for neighboring countries and trading partners. These pest reports are posted on the IPPC website.

5. International Plant Sentinel Network   

The International Plant Sentinel Network is a collaboration between the National Plant Diagnostic Network (NPDN) and the American Public Gardens Association. It is funded through cooperative agreements with APHIS under Section 10007 of the Farm Bill (Now Plant Protection Act §7721.) Launched in 2010, it has now grown to include more than 300 gardens across North America (information from the website).

The underlying premise is based on biogeography: plant-associated insects, fungi, and other pathogens introduced to plants that did not co-evolve with them (naïve plants) might cause unexpected damage. Since arboreta and botanical gardens cultivate many plant taxa outside their native range, they present an opportunity to observe new pest-host associations and the level of damage caused. Pests attacking native plants in North American botanical gardens might constitute “early detection” of a pest already in the country rather than a warning before the pest is introduced. Still, early detection is valuable.

6. ProMED   

The Program for Monitoring Emerging Diseases (ProMED) is a program of the International Society for Infectious Diseases (ISID). ProMED was launched in 1994 as an Internet service to identify unusual health events related to emerging and re-emerging infectious diseases and toxins affecting humans, animals and plants. It focuses on outbreaks in new geographic regions, newly described diseases, and diseases for which the causal agent is unknown. By its own estimation, ProMED is the largest publicly-available system conducting global reporting of infectious diseases outbreaks (information from the website). ProMED maintains several e-mail lists that disseminate information pertaining to disease outbreaks; subscribers can choose among lists to fit their areas of interest and their geographic region. ProMED has a much broader scope than the other early warning systems. Also, it uses informal and nontraditional sources, including local media, on-the-ground experts, and professional networks.

Stakeholders can access much of the information on these websites and use them to report findings of new alien species to phytosanitary agencies.

Gaps 

The review of early warning systems has disappointing gaps. First, I am puzzled that the authors looked only at the U.S.-based sentinel gardens effort and did not consider a parallel international network. The International Plant Sentinel Network was established in 2013. It is coordinated by the Botanical Garden Conservation Initiative, headquartered at Kew Gardens, United Kingdom. At present, 67 gardens and arboreta are participating; they are located in China, Australia and New Zealand, South Africa, South America, and Europe (including the Caucuses Mountains). After all, it is this international network that could inform APHIS about potential pests when they observe attacks on North American plants growing in their facilities. I confess that it is not clear to me whether participating gardens and arboreta would take the initiative to inform APHIS of pest attacks on North American plant species. It might be that APHIS would need to send inquiries to participants, probably focused on named pests. If these caveats are true, the network might not be a fully functional “early warning” body.

Update

Indeed, the USFS International Programs office is cooperating with the International Plant Sentinel Network to have some botanic gardens around the world monitor several North American species planted at their locations for disease and pest problems.  In June 2021 the USFS sought suggestions from contacts on which North American tree species should be monitored. Candidates could be tree species of high economic, ecological, or urban/landscape value. The candidate list would probably be limited to 10 species. They should represent a diverse range of conifers and hardwoods. 

Second, the articles authors make no mention of one of the principal sources of information on plant pests – CABI (Center for Agriculture and Bioscience International). CABI is a global source of information on organisms’ distribution. It is particularly strong in Commonwealth countries – which are important sources of plant material imported into the U.S.

Third, they apparently did not assess phytosanitary alert systems in place or anticipated in Australia, New Zealand, and South Africa.  This is a significant gap since these countries are leaders on phytosanitary issues. They are also potential sources of damaging pests.

Most disappointing is the lack of analysis of programs’ efficacy and weaknesses. The only step in this direction is contrasting ProMED’s willingness to report diseases for which the causal agent is unknown. PestLens, EPPO, and NAPPO refuse to do this. We desperately need an analysis of the extent to which this narrow concept of the task limits the ability of these systems to provide early warnings.

At least several of the networks, including PestLens and NAPPO, do not limit themselves to information that has been confirmed by countries – which might be reluctant to admit the presence of a damaging organism on their turf.

I suggest that it would have been particularly instructive to analyze the reasons why Australia’s early warning efforts failed to detect introduction of the myrtle rust pathogen sufficiently early to facilitate eradication.

This review did discuss how several of the networks tracked the global movement of the Tomato brown rugose fruit virus (ToBRFV). The virus was first detected in Jordan in 2015; this was reported by PestLens in 2016. PestLens reported the virus had spread to Israel 2017. The NAPPO system then reported the virus in Mexico in 2018. The virus was detected in the United States in 2018, although difficulties in taking official samples and diagnosing the virus probably delayed awareness of this outbreak. APHIS restricted imports of tomato and pepper seed, transplants and fruits from countries where the virus was known to be present in November, 2019. Still, APHIS acted after the virus had been detected in the country. ToBRFV has continued to spread; it is now found in Asia, Europe, the Middle East, and northern Africa. I am not completely convinced that this episode illustrates successful utilization of early warning networks. Did the apparently tardy action by APHIS arise from overconfidence that the virus would be limited to the Middle East? Or is it attributable to rules which limit agency actions until official confirmation of the detection? Another actor might have been delay in proving that the virus was being spread by the international seed trade; international phytosanitary rules require agencies to define the introductory pathway before regulating.

I hope other scientists will undertake a more comprehensive analysis of early warning systems. We need our phytosanitary systems to be made as effective as possible. Further evaluation of current efforts would provide valuable insight.

[A separate article reporting on the international sentinel gardens network from a British perspective is Marfleet, K. and S. Sharrock. 2020. The International Plant Sentinel Network: an update on phase 2. The International Journal of Botanic Garden Horticulture.]

SOURCES

Meissner, H., J. Fritz, L. Kohl, H. Moylett, J. Moan, S. Emerine, and A. Kaye. 2015. PestLens: An early-warning system supporting U.S. safeguarding against exotic plant pests. Bull. OEPP 45: 304-310

Noar, R.D, C.J. Jahant-Miller, S. Emerine, and R. Hallberg. 2021.  Early Warning Systems as a Component of IPM to Prevent the Intro of Exotic Pests.  Journal of IPM, (2021) 12(1): 16; 1–7 doi: 10.1093/jipm/pmab011

Posted by Faith Campbell

We welcome comments that supplement or correct factual information, suggest new approaches, or promote thoughtful consideration. We post comments that disagree with us — but not those we judge to be not civil or inflammatory.

For a detailed discussion of the policies and practices that have allowed these pests to enter and spread – and that do not promote effective restoration strategies – review the Fading Forests report at http://treeimprovement.utk.edu/FadingForests.htm
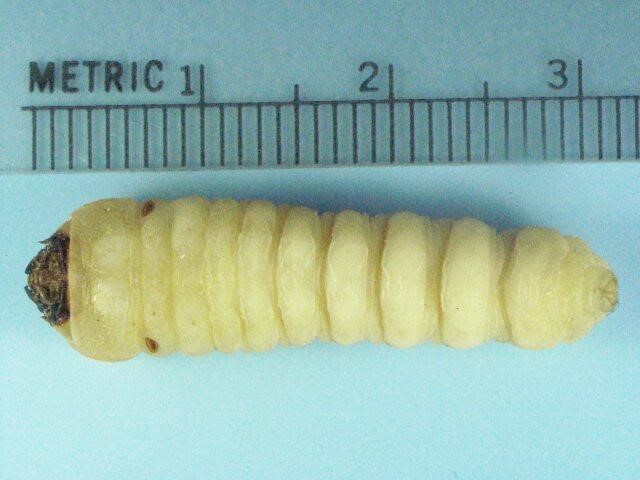
The South African Report as a Model: U.S. Falls Short

Ailanthus – one of the invasive species shared by South Africa and the U.S.

A few years ago, I posted a blog in which I pointed to a report on South Africa’s response to bioinvasion as a model for the U.S. and other countries. South Africa has published its second report. This report outlines the country’s status as of December 2019 and trends since the first report (i.e. since December 2016). (I describe the report’s findings on South Africa’s invasive species situation in a companion blog.) Again, I find it a good model of how a country should report its invasive species status, efforts, and challenges. In comparison, many U.S. efforts comes up short.

U.S. Reports Need to Be More Comprehensive

The South African report provides a national perspective on all taxa. Various United States agencies have attempted something similar a few times. The report issued by the Office of Technology Assessment in 1993  summarized knowledge of introduced species and evaluated then-current management programs.

The 2018 report by the U.S. Geological Service focused on data: the authors concluded that 11,344 species had been introduced and described the situation in three regions – the “lower 48” states, Alaska, and Hawai`i. However, the USGS did not evaluate programs and policies. The new USDA Forest Service report (Poland et al. 2021) describes taxa and impacts of invasive species in forest and grassland biomes, including associated aquatic systems. Again, it does not evaluate the efficacy of programs and policies.

The biennial national reports required by the Executive Order establishing the National Invasive Species Council (NISC) are most similar to the South African ones in intent. However, none has been comprehensive. For example, the most recent, issued in 2018, strives to raise concern by stating that invasive species effect a wide range of ecosystem services that underpin human well-being and economic growth. Some emphasis is given to damage to infrastructure. The report then sets out priority actions in six areas: leadership and prioritization, coordination, raising awareness, removing barriers, assessing federal capacities, and fostering innovation. NISC also issued a report in 2016 – this one focused on improving early detection and rapid response. NISC posted a useful innovation – a “report card” updating progress on priority actions — in October 2018.   It listed whether actions had been completed, were in progress, or were no longer applicable. However, the “report card” gave no explanation of the status of various actions; the most notable omissions concerned the actions dismissed as “not applicable”. Worse, no report cards have been posted since 2018. I doubt if those or any more comprehensive reports will be forthcoming. This reflects the increasing marginalization of NISC. The Council has never had sufficient power to coordinate agencies’ actions, and now barely survives.

U.S. Reports Need to Be More Candid

The authors of the South African report made an impressive commitment to honest evaluation of the country’s gaps, continuing problems, progress, and strengths. As in the first report, they are willing to note shortcomings, even of programs that enjoy broad political support (e.g., the Working for Water program).

It is not clear whether decision-makers have acted — or will act — on the report’s findings. That is true in many countries, including the United States. However, that is separate whether decision-makers have an honest appraisal on which to base action.

Assessment of South Africa’s Invasive Species Programs

Here is a summary of what the authors say about South Africa’s invasive species program. I want to state clearly that my intention is not to criticize South Africa’s efforts. No country has a perfect program, and South Africa faces many challenges. These have been exacerbated by COVD-19.  

The report identifies the areas listed below as needing change or improvement.

1) Absence of a comprehensive policy on bioinvasion. Such a policy would provide a vision for what South Africa aspires to achieve, clarify the government’s position, guide decision-makers, and provide a basis for coordinating programs by all affected parties (e.g., including conservation and phytosanitary agencies).

2) As in the first report, the authors call for monitoring program outcomes (results) rather than inputs (money, staffing, etc.) or outputs (e.g., acres treated). The authors also say data must be available for scrutiny. In those cases when data are adequate for assessing programs’ efficacy, they indicate that the control effort is largely ineffective.

3) Inadequate data in several areas. The report notes progress in developing and applying transparent and science-based criteria to species categorization as invasive (as distinct from relying on expert opinion). However, this change is taking time to implement, and sometimes results in species receiving a different rating. [I agree with the report that data gaps undermine understanding of the extent and impacts of bioinvasion, domestic pathways of spread, justification of expenditures, assessment of various programs’ efficacy (individually or overall), priority setting, and identifying changes needed to overcome programs’ weaknesses. However, I think filling these data gaps might demand time and resources that could better be utilized to respond to invasions – even when those invasions are not fully understood.]

4) Funding of bioinvasion programs by the National Department of Forestry, Fisheries, and the Environment has been fairly constant over 2012–2019, but this is a decline in real terms. The figure of 1 billion ZAR does not include spending by other government departments, national and provincial conservation bodies, municipalities, non-governmental organizations, and the private sector. Authors of the report expect funding to decrease in the future because of competing needs.

While at least 237 invasive species are under some management (see Table 5.1), funding is heavily skewed – 45% of funding goes to management of one invasive plant (black wattle); 72% to management of 10 species.

5) Need for policies to address the threat emerging from rising trade with other African countries, especially considering the probable adoption of the proposed African Continental Free Trade Area. Under this agreement, imported goods will only be inspected for alien species at the first port of entry, and most African countries have limited inspection capacity. [European pathologists Brasier, Jung, and others have noted the same issue arising in Europe, where imported plants move freely around the European Union once approved for entry by one member state.]

The authors of the South African report say programs’ efficacy would be considerably improved if species and sites were prioritized, and species-specific management plans developed. They warn that, in the absence of planning and prioritization, there is a risk that funding could be diluted by targeting too many species, leading to ineffective control and a concomitant increase in impacts.

In South Africa, regulations, permits, and other measures aimed at regulating legal imports of listed species are increasingly effective. However, there is still insufficient capacity to prevent accidental or intentional illegal introductions of alien species. There is also more enforcement of regulations requiring landowners to control invasive species. Six criminal cases have been filed and – as of December 2019, one conviction (guilty plea) obtained. However, the data do not allow an assessment of the overall level of compliance.

The report found little discernable progress on the proportion of pathways that have formally approved management plans. Management is either absent or ineffective for 61% of pathways. There has been no action to manage the ballast water pathway. On the other hand, in some cases, other laws focus explicitly on pathways, e.g., agricultural produce is regulated under the Agricultural Pests Act of 1983.

During the period December 2016 – December 2019, the Plant Inspection Services tested more than 12,000 plant import samples for quarantine pests and made 62 interceptions. The report calls for more detailed information from the various government departments responsible for managing particular pathways (e.g., the phytosanitary service), and for an assessments of the quality of their interventions.

The number of non-native taxa with some form of management has grown by 40% since December 2016 – although – as I have already noted — spending is highly skewed to a few plant species. The number and extent of site-specific management plans has also increased, apparently largely due to a few large-scale plans developed by private landowners. However, few of these plans have been formally approved by some unspecified overseer.

Citing the strengths and weaknesses described above, the current (second) report downgraded its assessment of governmental programs from “substantial” to “partial”.  

Comparison to U.S.

How does the United States measure up on the elements that need change or improvement?  I know of no U.S. government report that is as blunt in assessing the efficacy of our programs –individually or as a whole.

Nevertheless, each of the five weaknesses identified for South Africa also exist in the United States:

  1. Re: lack of a comprehensive policy, I think the U.S. also suffers this absence. This is regrettable since the National Invasive Species Council (NISC) was set up in 1999.
  2. Re: monitoring outcomes to assess programs’ efficacy, I think U.S. agencies do seem to be more focused on collecting data on programs’ results – see the Forest Service’ budget justification. However, I think too often the data collected focus on inputs and outputs.
  3. Re: data gaps, I think all countries – including the U.S. — lack data on important aspects of bioinvasion. I differ from the South African report, however, in arguing for funding research aimed at developing responses rather than monitoring to clarify the extent of a specific invasive species. Information that does not lead to action seems to me to be a luxury given the low level of funding.
  4. Re: funding, I find that, despite the existence of NISC, it remains difficult to get an overall picture of U.S federal funding of invasive species programs. Indeed, the cross-cut budget was dropped in 2018 at the Administration’s request. I expect all agencies are under-funded; I have often said so as regards key USDA programs. As in South Africa, funding is skewed to a few species that I think should be lower in priority (e.g., gypsy moth). 
  5. Re: upgrading invasive species programs to counter free-trade policies, I think U.S. trade policies place too high a priority on promoting agricultural exports to the detriment of efforts to prevent forest pest introductions. This imbalance might be present with regard to other taxa and pathways. See Fading Forests II here.

South African and U.S. agencies also face the same over-arching issues. For example, the U.S. priority-setting process seems to be a “black box.” Several USFS scientists (Potter et al. 2019) spent considerable effort to develop a set of criteria for ranking action on tree species that are hosts of damaging introduced pests. Yet there is no evidence that this laudable project influenced priorities for USFS funding.

SOURCES

Poland, T.M., P. Patel-Weynand, D.M Finch, C.F. Miniat, D.C. Hayes, V.M Lopez, editors. 2021. Invasive Species in Forests and Rangelands of the United States. A Comprehensive Science Synthesis for the US Forest Sector. Springer

Potter, K.M., Escanferla, M.E., Jetton, R.M., Man, G., Crane, B.S. 2019. Prioritizing the conservation needs of United States tree species: Evaluating vulnerability to forest P&P threats, Global Ecology and Conservation (2019), doi: https://doi.org/10.1016/j.gecco.2019.e00622.

SANBI and CIB 2020. The status of bioinvasions and their management in South Africa in 2019. pp.71. South African National BD Institute, Kirstenbosch and DSI-NRF Centre of Excellence for Invasion Biology, Stellenbosch. http://dx.doi.org/10.5281/zenodo.3947613

Posted by Faith Campbell  

We welcome comments that supplement or correct factual information, suggest new approaches, or promote thoughtful consideration. We post comments that disagree with us — but not those we judge to be not civil or inflammatory.

For a detailed discussion of the policies and practices that have allowed these pests to enter and spread – and that do not promote effective restoration strategies – review the Fading Forests report at http://treeimprovement.utk.edu/FadingForests.htm
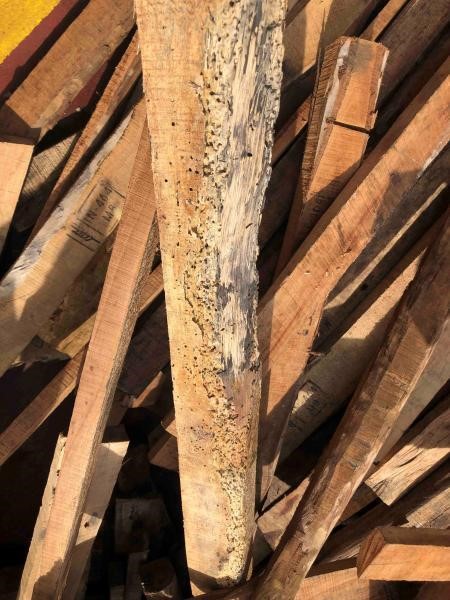
South Africa & Invasive Species: Threats to High Value Biodiversity and Human Well-Being

Protea repens and fynbos vegetation near Table Mountain; photo by Mike Wingfield

South Africa is a country of immense biological diversity. It is also one that recognizes the threat invasive species pose to its natural wealth – and to the economy and livelihoods of ordinary people.

Also, South Africans are trying hard to improve the country’s invasive species program. It recently released the second national report assessing how well it is curtailing introductions and minimizing damage. As I describe in a companion blog, I find these reports to contain exceptionally thorough and honest appraisals of South Africa’s invasive species programs. I address that value in the companion blog, where I compare the South African report — and its findings — to U.S. government reports on our invasive species programs.

In South Africa, bioinvasion ranks third – after cultivation and land degradation – as a threat to the country’s impressive biodiversity. Invasive species are responsible for 25% of all biodiversity loss. Certain taxa are at particular risk: native amphibians and freshwater fishes, and some species of plants and butterflies.

Particularly disturbing is the bioinvasion threat to the Fynbos biome. The report notes that 251 non-native species have been identified in this system. This finding causes concern because the Fynbos is a unique floral biome. In fact, it constitutes the principal component of one of only six floral kingdoms found on Earth: the Cape Floral Kingdom (or region). For more information, go here.

map of South Africa showing fynbos biome

Not surprisingly, invasive bird and plant species are most numerous around major urban centers. The report concludes that this is probably because most non-native birds are commensal with humans; most birds and plants were first introduced to urban centers; and there is greater sampling effort there. Indeed, the patterns of (detected) invasive plant richness are still highly sensitive to sampling effort.

South Africa is considered a leader on invasive species management. However, its record is spotty.

Successes

Biocontrol interventions are considered a success. South Africa has approved release of 157 biocontrol agents, including seven since 2016. All the recent agents (and probably most others) target invasive plants. The South African biocontrol community conducts a comprehensive review of their effectiveness at roughly 10-year intervals. The fourth assessment is currently under way. Also, the report considers eradication of non-native fish (primarily sport species) from several wetlands and river reaches to have been successful. (However, opposition by sport fishermen has delayed listing of some trout species as invasive.)

Failures

On the other hand, strategies to combat invasive plants, other than by biocontrol, appear to be having little success. Even the extent of plant invasions in national parks is poorly documented. Also, the report highlights ballast water as an inadequately managed pathway of invasion.

The report estimates that three new non-native species arrive in South Africa accidentally or illegally every year. Interestingly, reported species arrivals have declined in the current decade compared to the preceding one. The report’s authors consider this to probably be an underestimate caused by the well-known lag in detecting and reporting introductions. The apparent decline also is contrary to global findings. Table 1 in Seebens et al. 2020 (full citation at end of blog) projected that the African continent would receive approximately 767 new alien species between 2005 and 2050.

Even the introductory pathways are poorly known: the pathway for 54% of the taxa introduced to South Africa are unknown. Of the species for which the introductory pathway is known, horticultural or ornamental introductions of plants dominate – 15% of that total. A second important pathway – for accidental introductions – is shipping (5% of all introductions). Other pathways thought to be prominent during 2017–2019 are the timber trade, contaminants on imported animals, and natural dispersal from other African countries where they had previously been introduced.

PSHB symptoms on Vachellia sieberiana; photo by Trudy Paap

Polyphagous shothole borer

The report highlights as an example of a recent introduction that of the polyphagous shothole borer (PSHB, Euwallacea fornicatus). https://www.dontmovefirewood.org/pest_pathogen/polyphagous-shot-hole-borer-html/        http://nivemnic.us/south-africas-unique-flora-put-at-risk-by-polyphagous-shot-hole-borer/ See Box 3.1 in the report. This species is expected to have huge impacts, especially in urban areas. While most of the trees affected so far are non-native (e.g., maples, planes, oaks, avocadoes), several native trees are also reproductive hosts.  https://www.fabinet.up.ac.za/pshb  In response to the introduction, the government established an interdepartmental steering committee, which has developed a consolidated strategy and action plan. However, as of October 2020 the shot hole borer had not been listed under invasive species regulations, even on an emergency basis. It had been listed as a quarantine pest of agricultural plants (e.g., avocado) per the Agricultural Pests Act 1983.

As note in my blog assessing the report, the report bravely concludes that the government’s regulatory regime is only partially successful (whereas three years ago it graded it as “substantial”). The downgrade is the result of a more thorough evaluation of the regulatory regime’s effectiveness.

SOURCES

SANBI and CIB 2020. The status of bioinvasions and their management in South Africa in 2019. pp.71. South African National BD Institute, Kirstenbosch and DSI-NRF Centre of Excellence for Invasion Biology, Stellenbosch. http://dx.doi.org/10.5281/zenodo.3947613  

Seebens, H., S. Bacher, T.M. Blackburn, C. Capinha, W. Dawson, S. Dullinger, P. Genovesi, P.E. Hulme, M. van Kleunen, I. Kühn, J.M. Jeschke, B. Lenzner, A.M. Liebhold, Z. Pattison, J. Perg, P. Pyšek, M. Winter, F. Essl. 2020. Projecting the continental accumulation of alien species through to 2050. Global Change Biology. 2020;00:1 -13 https://onlinelibrary.wiley.com/doi/10.1111/gcb.15333

Posted by Faith Campbell

We welcome comments that supplement or correct factual information, suggest new approaches, or promote thoughtful consideration. We post comments that disagree with us — but not those we judge to be not civil or inflammatory.

For a detailed discussion of the policies and practices that have allowed these pests to enter and spread – and that do not promote effective restoration strategies – review the Fading Forests report at http://treeimprovement.utk.edu/FadingForests.htm