cats – reported to be the most widespread invasive animal in National parks
In two recent evaluations and resulting reports, National Park Service experts admit the agency has fallen short on managing the invasive species threat and suggest ways to improve. One report – that on invasive animals (see below) identifies the principal problem to be lack of support for invasive species programs from NPS leadership.
They’re not alone: I have previously criticized the NPS here and here
Invasive Animals
The bolder of the two reports addresses invasive animals – “Invasive Animals in U.S. National Parks – By a Science Panel” https://irma.nps.gov/DataStore/DownloadFile/594922 commissioned by the NPS Chief of Biological Resources Division. The report was released in December 2017.
The report is blunt – which I welcome.
Key Message
The NPS’ mission of preserving America’s natural and cultural resources unimpaired for future generations is “under a deep and immediate threat as a consequence of invasive animal species, yet the National Park Service does not have a comprehensive understanding of the costs and impacts of invasive animals or a coordinated strategy for their management.” The result: “The consequence is a general record of failure to control invasive species across the system.”
The report says there are opportunities for the NPS to take a lead in addressing the threat – including to help counter invasive species denialism. It suggests ways to provide the needed capacity and to change the agency culture that hampers efforts to realize this ambition.
Current Picture
More than half of all National Park units reporting to the report’s authors (245 out of 326 parks) reported the presence of invasive animals – ranging from freshwater mussels to feral cats. In the process of compiling the report, the authors received reports of 1,409 invasive animal populations – comprising 331 species — probably an underestimate. Only a small percentage can be considered under some form of management. The most widely reported species:
Domestic cat 69 parks
Common starling 66 parks
Common pigeon 47 parks
House sparrow 40 parks
Red imported fire ant 40 parks
Feral hog 39 parks
Rainbow trout 36 parks (often introduced deliberately)
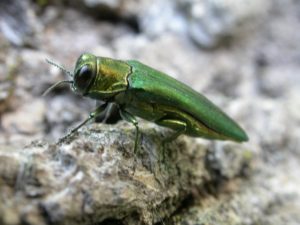
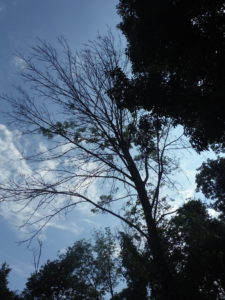
The report mentions several tree-killing insects or pathogens among the damaging animal invaders in National parks: emerald ash borer, hemlock woolly adelgid, and rapid ohia death (a pathogen). (Background on all three is here.)
This new report acknowledges management efforts. They reviewed 80 NPS projects in the pipeline from 2000 through 2023. Most projects target a limited number of species: feral hogs, cats, and horses/burros; fire ants; hemlock woolly adelgid; and emerald ash borer.
EAB-killed ash tree in Shenandoah NP (F.T. Campbell)
Eradication has reportedly been attempted for 21 invasive animal populations; 17 of those populations remained under some control efforts (e.g., monitoring to detect any re-invasion) in 2016. Nine of the eradicated populations were in the Pacific West region – especially Channel Islands National Park. Another eight were in the Southeast. Three other regions — Intermountain, Northeast, and National Capital regions — each reported one invasive animal population eradicated and under control. Another 150 invasive animal populations were reportedly “controlled”.
What’s the Problem?
The report’s authors note numerous (and well-known) difficulties in managing invasive animals. These include difficulty detecting invaders at early stages of invasion; paucity of effective management tools; and social constraints such as perceived benefits associated with some (e.g., trout and other sport fishes) and ethical and humane objections to killing vertebrates.
However, the report identifies the principal problem to be lack of support for invasive species programs from NPS leadership. Constraints that hamper park managers’ efforts within the agency include Service-wide coordination, lack of capacity, park culture, “social license” (i.e., public approval), and cross-boundary coordination.
The authors suggest that to correct these deficiencies, the Service should formally acknowledge that invasive animals represent a crisis on par with each of the three major crises that drove Service-wide change in the past:
1) over-abundance of ungulates due to predator control (leading to the “Leopold Report” in the 1960s);
2) Yellowstone fire crisis (which led to new wildfire awareness in the country); and
3) recognition of the importance of climate change (which resulted in the report “Leopold Revisited: Resource Stewardship in the National Parks”).
To achieve true success in such a major undertaking, all levels of NPS management must be engaged. Further NPS’ current culture and capacity must be changed. The report suggests providing incentives for (1) efforts to address long-term threats (not just “urgent” ones) and (2) putting time and effort into coordinating with potential partners, including other park units, agencies at all levels of government, non-governmental organizations, private landowners, and economic entities.
An additional step to realizing a comprehensive invasive animal program would be to integrate invasive animal threats and management into long-range planning goals for natural and cultural landscapes and day-to-day operations of parks and relevant technical programs (e.g., Biological Resources Division, Water Resources Division, and Inventory and Monitoring Division).
The report notes the need for increased funding. Such funding would need a flexible timeline (unlike existing Service-wide funding for more general purposes), allowing parks to be responsive to time-sensitive management issues. It would also have to be available consistently over the long term – since eradication can take a long time. Several approaches are proposed, including incorporating some invasive species control programs (e.g., weeds, wood borers) into infrastructure maintenance budgets; adopting invasive species as fundraising challenges for “Friends of Park” and the National Park Foundation; and adopting invasive species as a priority threat.
The authors would like NPS to become a leader on the invasive species issue – specifically by testing emerging best management practices and by better educating visitors on the ecological values of parks and the serious threat that invasive species pose to the their biodiversity. The authors suggest that the NPS also take the lead in countering invasive species denialism.
While officially-approved deliberate introductions of non-native species are probably unlikely to continue, the report expects that the numbers of invasive animals and species in national parks will increase due to continuing spread of invaders from neighboring areas. Therefore, NPS’ current piecemeal approach needs to be replaced with a much stronger, strategic approach in which parks engage in collaboration with conservation partners on adjacent lands or waters and across the greater landscape.
Invasive Plants
The NPS launched a coordinated effort targetting invasive plants years ago — in 2000. The most obvious component of which was the Exotic Plant Management Teams (EPMTs). The broader program was officially named the Invasive Plant Program (IPP) only in 2014. The IPP provides leadership to individual parks, regions, and the park system on invasive plant management, restoration, and landscape level protection. The IPP released its strategic plan in December 2016. (Ok! More than a year ago. I am tardy.)
Despite the large size of the program – 15 EMPTs across the country – and the clear and recognized threat that invasive plants pose to NPS values, I got the impression that the program struggles to gain support from the Service. In that way, the situation is similar to the challenges to efforts on animal invasives described above.
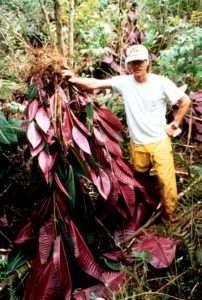
removing Miconia to protect Haleakala National Park
The Strategic Plan identifies goals and actions to optimize the program’s effectiveness, while increasing program and park capacity and leveraging human and fiscal resources with state, federal, and private entities.
The plan articulates a mission, a vision, five broad goals, and actions for the next 10 years. It’s intended to guide annual planning and major projects, as well as to identify and help prioritize funding needs and initiatives.
The overall vision is for the Invasive Plant Program to guide park service efforts to enhance landscape level stewardship of resources by applying “technically sound, holistic, collaborative, adaptive, and innovative approaches.” The hope is that other NPS units will increasingly rely on the IPP’s expertise in implementing their programs and building partnerships.
The strategic plan lays out five broad goals, each supplemented by a list of detailed activities. Priority actions have been identified for the first 5 years (2017-2021) with the expectation that actions will be re-prioritized during annual reviews. These five goals are:
- Develop program standards
Clarify and standardize administrative and operational roles and tasks. Improve data management and train colleagues in those standards. Incorporate science-informed procedures to support park management of invasive plants.
Interestingly, the Plan calls for IPP staff to quantify the invasive plant threat and effort needed to manage it and then to communicate the gap between effort needed and resources available to decision makers.
2. Promote the Invasive Plant Program by highlighting the services it provides and the significance of the invasive plant issue both internally and with stakeholders. Assure that IPP efforts parallel those in the Department of Interior Action Plan for invasive species.
- Build capacity of individual parks and the Service to prevent the arrival of invasive plants and manage infestations that are already present
Enhance resource and information sharing and field-based training. Find ways to encourage parks to continue managing the invaders after the EMPT completes the initial eradication. Also find ways to increase the EPMT Program’s efficiency. Possibly develop an NPS pesticide applicators’ certification course (the Bureau of Land Management and Department of Defense already have one).
Increase partnerships to deal with actions that are outside parks’ control. Specifically, participate in regional and state invasive plant councils, and collaborate with a full range of external partners to identify successful techniques, conduct control and restoration campaigns, improve and implement efficient plant management across park boundaries, and recruit and manage youth and volunteers.
- Promote holistic and integrated invasive plant management
Work with other NPS programs and parks (across all divisions) to establish resource stewardship and landscape preservation / restoration goals. Integrate integrated pest management strategies in management actions. Continue close collaboration with Climate Change Response Program (if it still exists!). Identify research needs and get the research done.
- Collaborate on invasive plant management
Foster and encourage internal and external collaboration and coordination to leverage available resources, expertise, and knowledge.
Identify parks, NPS programs, partner agencies, organizations, and related initiatives with similar objectives to increase efficiency and effectiveness. Coordinate with NPS monitoring programs (although the invasive animal study authors thought the monitoring program is not structured to serve invasive species needs). Partner with BLM and US Fish and Wildlife Service and non-federal partners to cooperatively manage invasive plants on the landscape. Coordinate compliance with National Environmental Policy Act (NEPA) and National Historic Preservation Act.
Each IPP unit is expected to develop an annual work plan that aligns with an annual financial plan. Priorities will be reviewed annually. Each IPP unit will also submit an annual accomplishment report. IPP might develop a tracking system to be applied to each assigned action.
Plus the IPP strategic plan will be reviewed annually and actions will be re-prioritized as needed. The annual status reports will be made available to stakeholders and partners on the Web.
Posted by Faith Campbell
We welcome comments that supplement or correct factual information, suggest new approaches, or promote thoughtful consideration. We post comments that disagree with us — but not those we judge to be not civil or inflammatory.
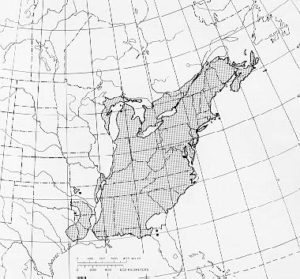 native range of American beech; USFS map


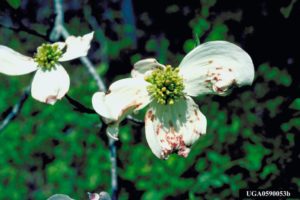 dogwood anthracnose
