Climate Change & Habitat Disruptions: Connected by Carbon Dioxide

Wildfire: one of the widely recognized results of climate change (The Pioneer Fire located in the Boise National Forest near Idaho City, ID began on Jul. 18, 2016 and the cause is under investigation. The Pioneer Fire has consumed 96,469 acres. U.S. Forest Service photo. Original public domain image from Flickr)

A guest blog by Michael Aucott. Mike is a retired research scientist of the NJ Department of Environmental Protection. He has also taught chemistry at the College of New Jersey.  He is currently a member of the NJDEP Science Advisory Board Standing Committee on Climate and Atmospheric Sciences, and on the board of directors of the PA/NJ Chapter of the American Chestnut Foundation. If you wish to contact Mike, use the contact button on this website. You MUST include your email address; it is not recorded automatically.

Two major perturbations affect Earth and its living systems, climate change and habitat disruptions. Emerging data show that these are more closely related than previously realized; they are connected by carbon dioxide, CO2.

Climate change basics: the physics

Climate change concerns have focused on the alteration of weather and climate due to the increase in atmospheric concentrations of greenhouse gases, primarily carbon dioxide, CO2. The impact of CO2 on climate has been understood for at least 120 years. In 1896 the Nobel-Prize-winning Swedish chemist Svante Arhennius published calculations demonstrating that human emission of CO2, when combined with the positive feedback effects of water vapor, would warm the Earth (Arhennius, 1896). His equation, ΔF = α ln(C/C0), relates the change in climate “forcing” (the degree to which temperature change is forced) to the ratio of the concentration of CO2 currently in the atmosphere (C) to a previous concentration (C0). This equation is still in use today. Arhennius estimated that a doubling of CO2 would warm the Earth by about 4 degrees C. This estimate is not far off from current estimates based on much more elaborate calculations.

This warming impact is caused by the physics of CO2, water vapor, and other “greenhouse” gases. Infrared radiation causes the CO2, water, and other greenhouse gas molecules to vibrate, leading to the absorption of the energy carried by that radiation. Much of the solar energy coming from the sun is not in the infrared frequency range, so it passes through the atmosphere without being absorbed. However, when this energy is absorbed by the surfaces of the Earth and its biota, and is re-radiated as infrared radiation, it is then absorbed by greenhouse gases, warming the planet.


The amount of water vapor in the atmosphere is directly related to the atmosphere’s temperature: warm air holds more water vapor. Human activity hasn’t directly changed the concentration of water vapor in the atmosphere significantly. But by burning fossil fuels, humans have dramatically increased the atmospheric concentration of CO2 and in so doing, also indirectly increased the concentration of water vapor. Just as Arhennius predicted over 120 years ago, this increase in CO2 is warming the Earth.

Ramifications of this warming include increased heat episodes, the intensification of the hydrological cycle (greater frequency of both heavy precipitation events and of droughts), sea level rise due to the melting of land-based glaciers and the thermal expansion of ocean water, and, almost certainly, intensification of storms and an increase in extreme weather. These climate-warming- based perturbations have the potential to influence the functioning of Earth’s biota in many deleterious ways, and clearly can be associated with the many facets of habitat disruption.

Climate change amplifications: the chemistry

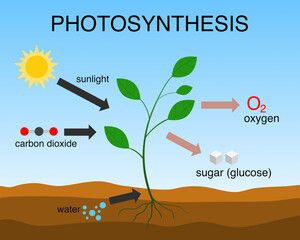
But there’s another aspect of CO2 that may be more important insofar as habitat disruption is concerned and that has been largely ignored: chemistry. CO2 is a trace gas as far as we humans and other animals are concerned, unnoticed by our bodies in normal life. But to plants it is a vital food. It is taken up by plants as an essential input to photosynthesis. In this chemical reaction, using the energy of sunlight, plants combine CO­2 and water vapor to make oxygen and carbohydrates, represented with a generic formula of CH2O, according to the equation CO2 + H2O → CH2O + O2.  Without this reaction, life as we know it would not exist.

The atmospheric concentration of CO2 has varied over time; some 50 million years ago it was considerably higher than today. However, for at least the last three million years, the concentration of CO2 has been in the range of 280 ppm. Over these millions of years biota have adapted to this concentration. But within the last 300 years, one ten thousandth of this period – a blink of an eye in the geological or evolutionary time scale – the concentration of CO2 has shot up to 420 ppm, a 50% increase, due to humanity’s burning of fossil fuels and forests.


Imagine what might happen to a person who had been on a tight dietary budget for most of his or her life but suddenly got access to 50% more carbohydrates, but no more protein or minerals?  We could expect major changes in the metabolism of that person. This dramatic change is what has, in effect, happened to the whole of life on Earth. Our planet’s primary biota, plants, now suddenly have the opportunity to gorge on CO2. But their access to other important substances such as nitrogen has not changed. Evidence is accumulating that CO2 at its elevated level of 420 ppm is not, as has been proclaimed by some, a healthy influence but is instead throwing Earth’s ecosystem into disarray.

Much of the recent experimental evidence on the impacts of enriched atmospheric CO2 has been assembled by Lewis Ziska and presented in his new book, Greenhouse Planet: How Rising CO2 Changes Plants and Life as We Know It (Ziska, 2022; see full citation at the end of the blog). The findings documented in this book reveal a variety of impacts of elevated CO2. These impacts include stimulation of growth of invasive plants, decreases in the nutrient content of major crops, and changes in plants’ production of insecticidal, allergenic, and other compounds. The changing chemistry of plants may be contributing to a major die-off of insects and insect-eating animals including birds. Below are some details.

Habitat Disruptions: Stimulation of Invasive Plants

The generally accepted explanation for why some plants are invasive is that they have been introduced to new regions where their historic predators and parasites aren’t present. Without these drags on their growth, they have flourished. That some alien plants are not browsed by white-tailed deer contributes significantly to their invasiveness in Eastern North America. Other factors are clearly involved as well, including changes in the temperature regime and the availability of water and other resources such as nitrogen.

But elevated CO2 is also a factor. In recent years, techniques for measuring responses of organisms in situ under elevated CO2 conditions have been developed, making possible investigations of the impacts of CO2 concentrations that could exist in the future under otherwise relatively realistic conditions. What the actual atmospheric CO2 concentration will be in 2050 or 2100 is difficult to predict; it depends on what humanity does to control emissions. Various scenarios suggest that levels could exceed 500 ppm by 2050 and might exceed 1000 ppm by 2100 (Tollefson, 2020).

cheatgrass; photo by Jaepil Cho

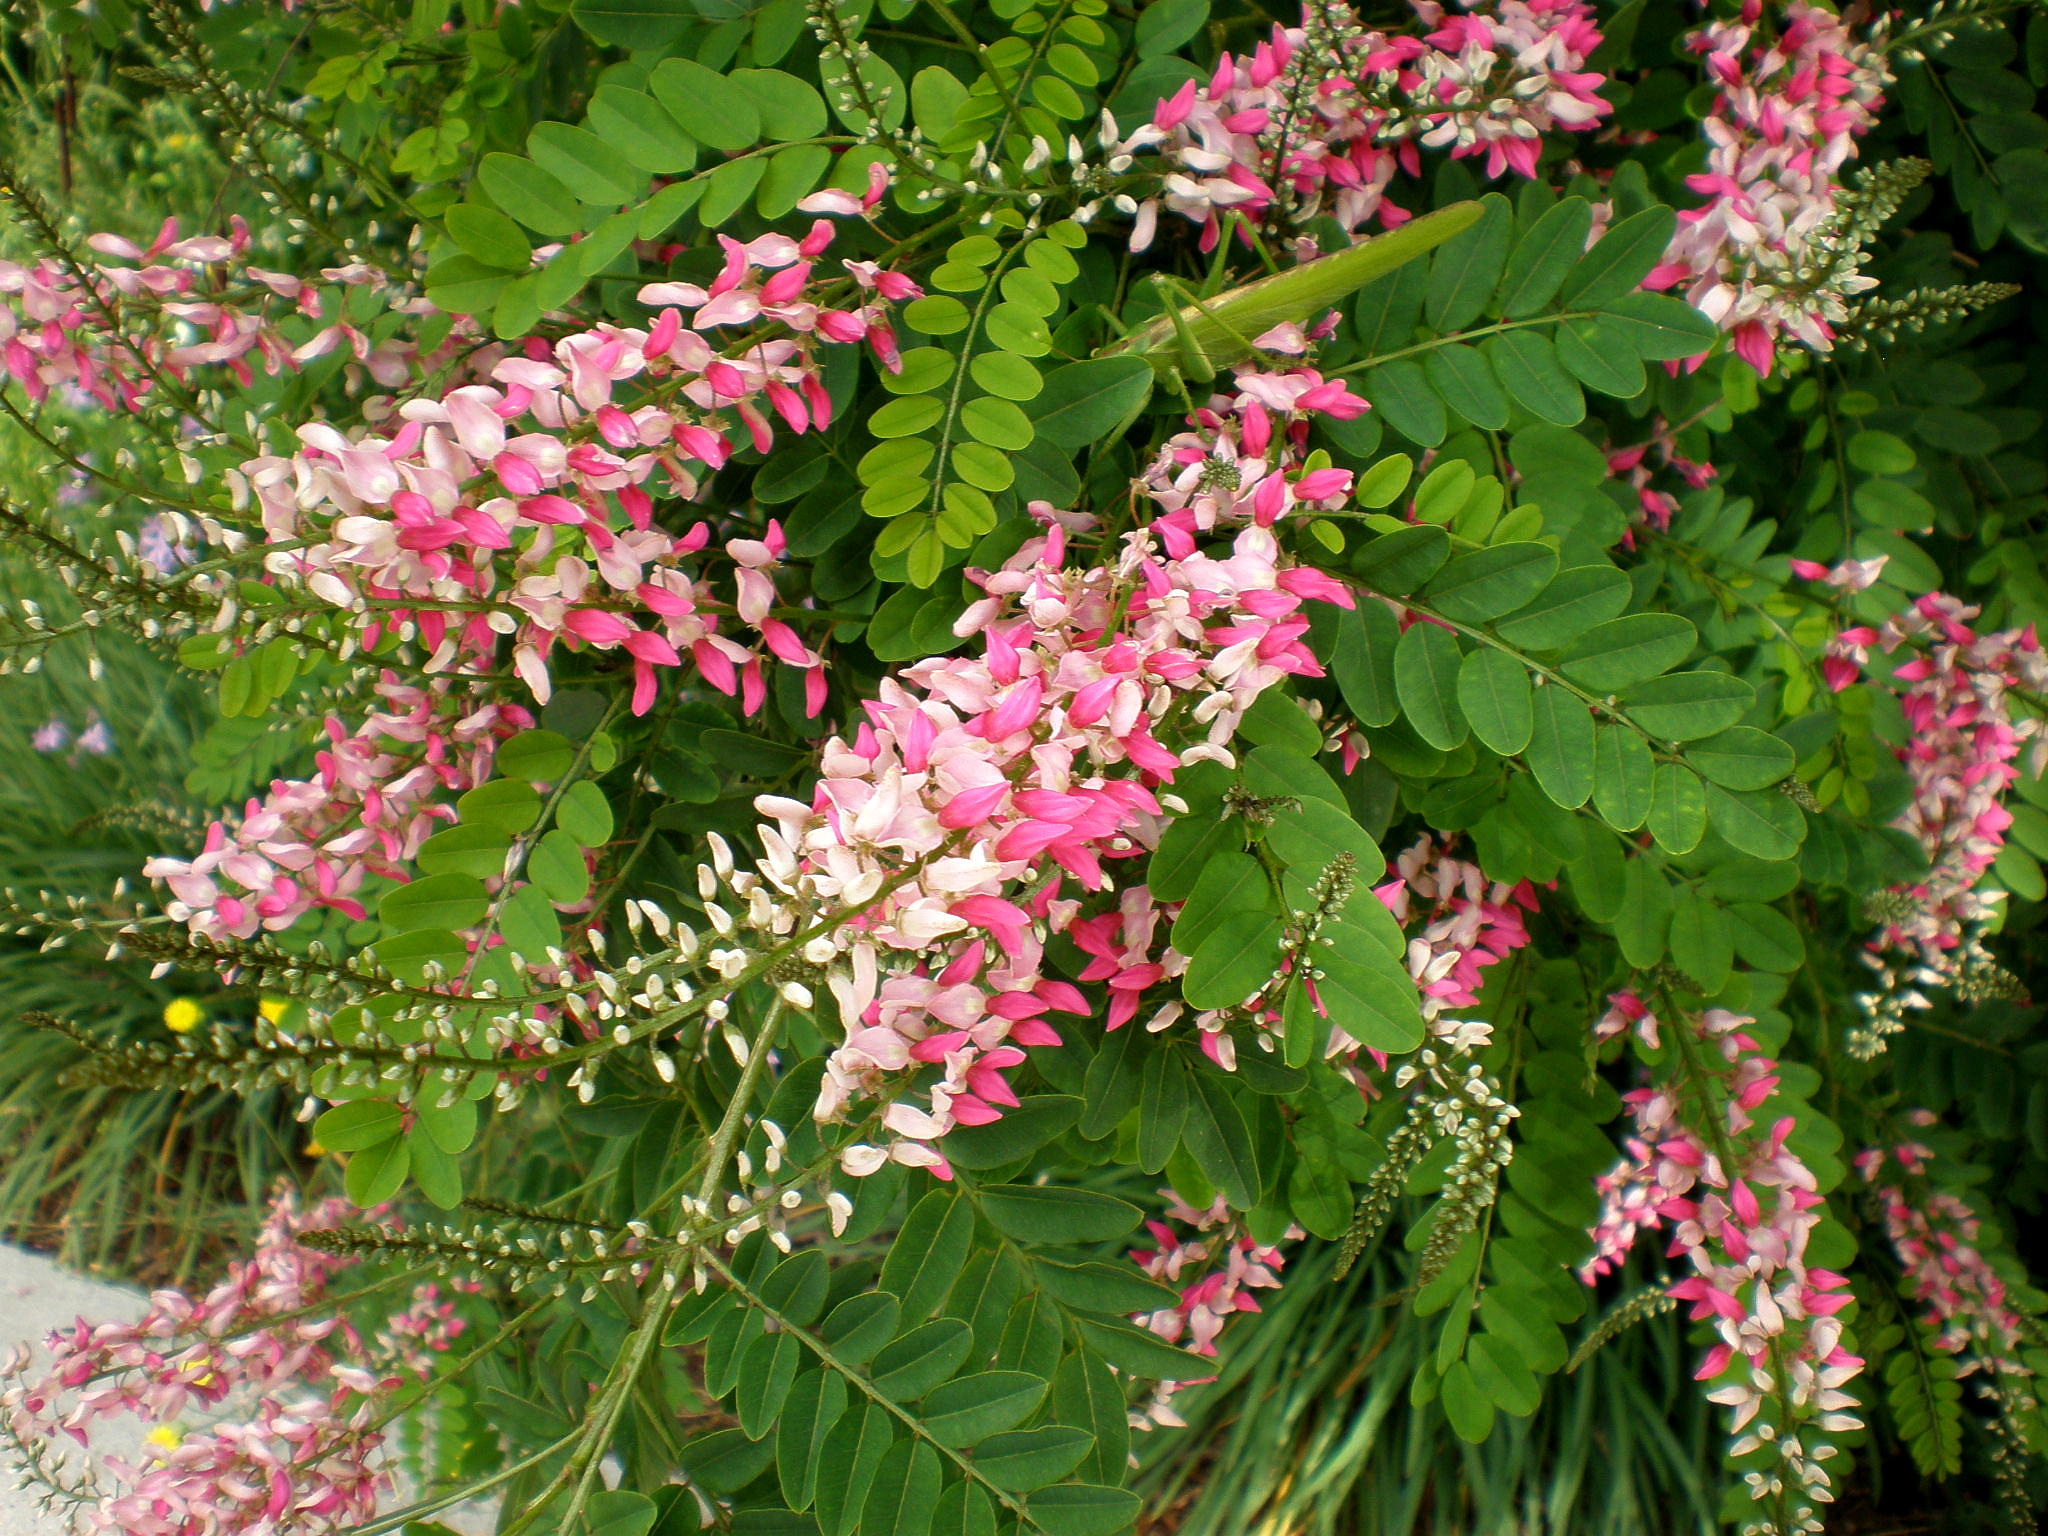
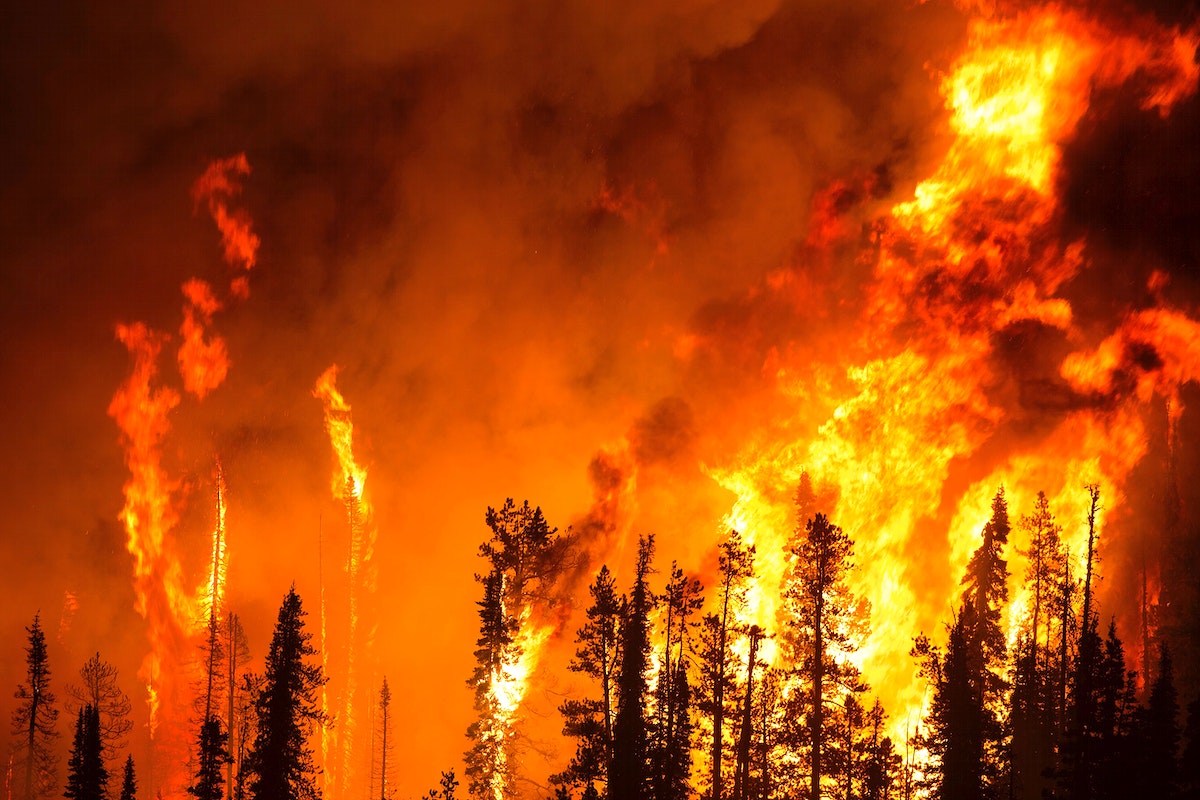
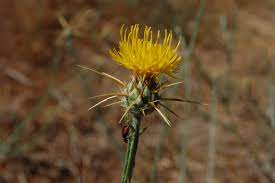
One study found that the invasive weed Canada thistle, Cirsium arvense, responds more strongly to elevated CO2 than soybean, a crop that it often plagues. In a high CO2 environment, this weed’s root system grows strongly enough to make it significantly more resistant to herbicides (Ziska, et al., 2004) (Ziska, 2010). The highly invasive and dangerously flammable cheatgrass (Bromus tectorum), nicknamed “grassoline” by the U.S. Forest Service because of its propensity to intensify wildfires, also responds strongly to elevated CO2 (Ziska, et al., 2005). Also found to be boosted by enriched CO2 is yellow star-thistle (Centaurea solstitialis), considered one of California’s worst weeds. In one study (Dukes, et al., 2011) this plant grew 600% larger in elevated CO2 relative to ambient, while native plants responded much less strongly or not at all. Japanese honeysuckle, Lonicera japonica, which plagues many areas in the U.S., was found to increase in biomass by 135% at a CO2 concentration of 675 ppm while a similar native plant, coral honeysuckle (Lonicera sempervirens) increased by only 40% (Sasek & Strain, 1991). In a field study also involving Japanese honeysuckle (Belote, et al., 2004), researchers found that its above ground net production (ANPP) approximately tripled under enriched CO2 while other plants in the trial showed showed lesser increases or actual decreases.

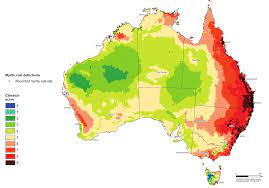
Other plants have been found to be selectively encouraged by enriched CO2 including cherry laurel (Prunus laurocerasus), invasive in the Pacific Northwest U.S. and the U.K., (Hattenschwiler & Korner, 2002); dalmation toadflax (Linaria dalmatica), invasive in much of North America (Blumenthal, et al., 2013); honey mesquite (Prosopis glandulosa) , invasive in Australia and parts of Africa (Polley, et al., 1996); and kudzu (Pueraria lobata), which afflicts the Southeast U.S. (Sasek & Strain, 1988). Three plants invasive in China or Southeast Asia, American rope (Mikania micrantha), Creeping oxeye (Wedelia trilobata), and a morning glory species (Ipomoea cairica), were found to produce 70.3% greater biomass when grown at a CO2 concentration of 700 ppm while three corresponding indigenous plants Paederia scandens, Wedelia chinensis and Ipomoea pescaprae, produced only 30.5% more biomass (Song, et al., 2009).

yellow star thistle; photo by Eugene Zelenko

The list goes on of studies showing increased growth of some plants under enriched CO2 conditions. As more in situ investigations are undertaken, it seems likely it will become clearer that today’s enriched level of CO2 is helping some plants to become invasive.

Complexities and contradictory findings exist however. Not all plants are stimulated by enriched CO2. An important difference in the response to higher levels of CO2 is whether a plant has a C3 or a C4 photosynthetic mechanism. C4 plants contain a biochemical pump that concentrates CO2, making them more adapted to low CO2 conditions (Hager, et al., 2016). At current levels of CO2, such plants’ need for CO2 is easily met. C3 plants do not have this CO2 concentrating ability, and so higher levels boost their growth. In a broad meta-analysis of literature, the average response to elevated CO2 of 365 C3 plant species and 37 C4 plant species was noted; the response was significantly increased in C3 species but was unchanged in C4 species (Robinson, et al. 2012). One striking example of such a difference was observed in the field study noted above (Belote, et al., 2004), wherein researchers found that Japanese honeysuckle (a C3 plant) was significantly encouraged by elevated CO2 relative to other plants at the same locale. The same study found that another aggressive invader, Japanese stiltgrass (Microstegium vimineum), a C4 plant, was unaffected or even slightly inhibited relative to competing plants’ growth by elevated CO2.

Habitat Disruptions: Changing of Plants’ C/N Ratio and Nutrient Content

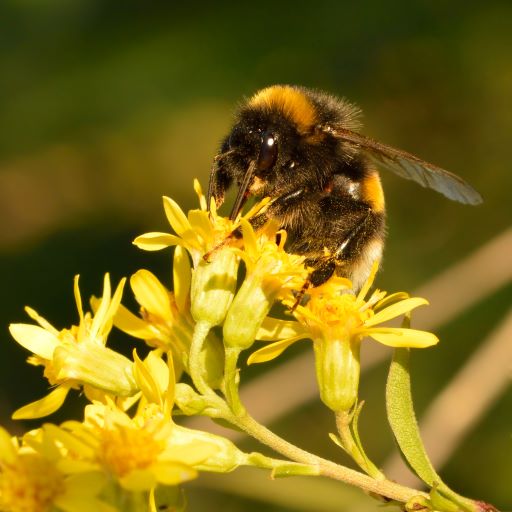
One finding is widespread; most plants studied under enriched CO2 regimes show an increase in biomass and evince a higher ratio of carbon to nitrogen (C/N ratio) in their tissues and an overall decline in nitrogen concentrations than when grown under ambient conditions. Since nitrogen is a key component of protein, this change can be expected to lead to lowered protein content of critical food crops. Some impacts of this change are already well underway because of today’s elevated CO2 concentration. Changes since 1850 in the C/N ratio and in the estimated protein content of an important plant product, pollen, were discovered in a striking study by Lewis Ziska and colleagues (Ziska, et al., 2016). Using archived museum samples, these researchers determined the nitrogen content of pollen of Solidago canadensis (Canada goldenrod) going back to the 1850s. They estimated that the protein content of goldenrod pollen, a vital nutrient for North American bees, has declined in inverse proportion to the rise in atmospheric CO2, dropping from a concentration of approximately 18% in the mid-1800s to approximately 12% today. They pointed out that it is possible that bees are now unable to provide sufficient protein and other nutrients to larvae, and that one of the main reasons for bee declines is malnutrition caused by enriched atmospheric CO2. Other studies also indicate that elevated CO2 could cause lower nitrogen concentrations in plants and lead to less proteinaceous plant parts, including pollen, being available to plant-feeding insects (Hall, et al., 2005; Knepp, et al., 2007).

bumblebee on goldenrod; photo by Keila

The changing C/N ratio is almost certainly already affecting the human food supply. As documented in an extensive review of published findings (Soares, et al., 2019), elevated CO2 has a considerable impact on the accumulation of minerals and protein in plants, with many plant species showing declines in both quality and quantity of key nutrients. These changes have worrisome implications for human nutrition and may already be responsible for increasing incidences of dietary deficiency in some areas. Lewis Ziska discusses the likely impact of rising CO2 on the future human food supply in his recent post. A number of studies showing declines in protein and also other nutrients such as zinc in food crops important to humanity are also described in Ziska’s new book, Greenhouse Planet, noted above.

Habitat Disruptions: Other Changes in Plant Chemistry

Other changes in plants besides nutritional content may be driven by enriched CO2. Plants produce a variety of secondary metabolites. Most plants use the C3 mechanism; with 50% more available of a key input, some changes in these plants’ production of such chemicals can be expected. Some changes have been observed. Mohan et al. (2006) report that enriched CO2 in an intact forest system increased water use efficiency, growth, and population biomass of poison ivy (Toxicodendron radicans) and that high-CO2 plants also produced a more toxic form of the allergenic compound urushiol.

Quercus chapmanii; photo by Mary Keim at Seminole State Forest, Florida

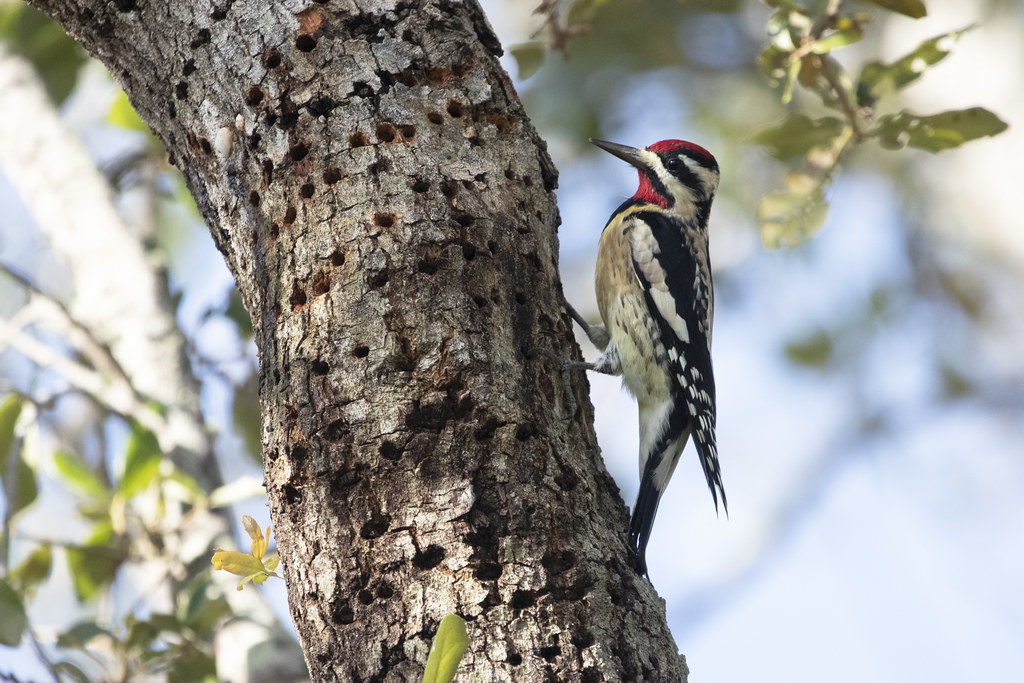
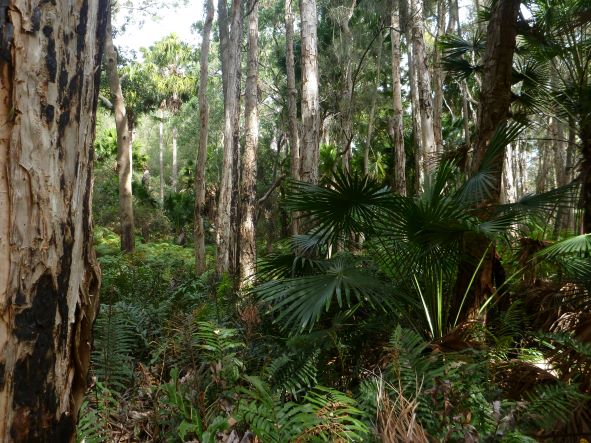
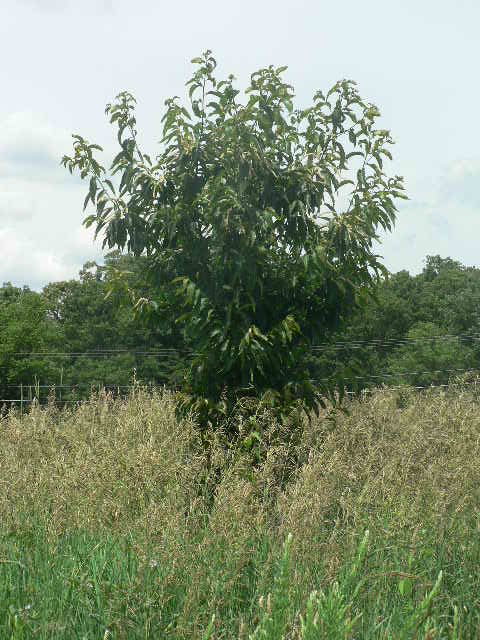
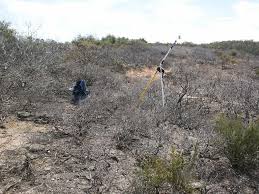
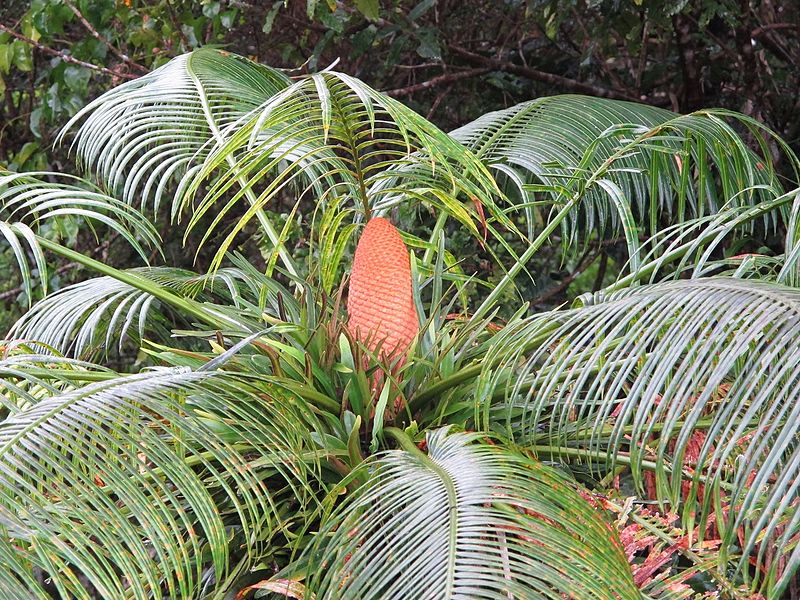
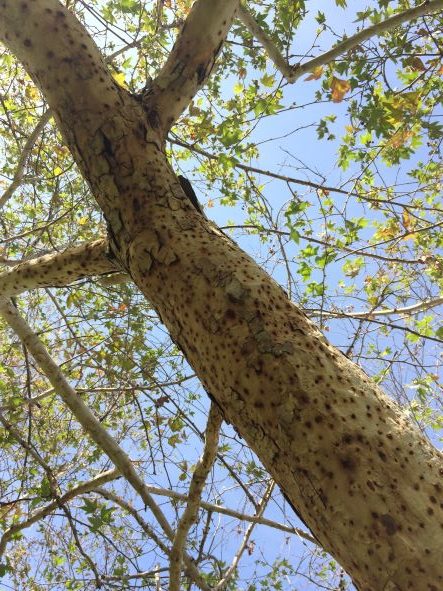
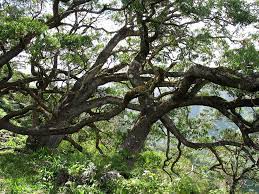
Many of the phytochemicals plants produce function as defenses against insect predation, and changes in such production have been found to impact herbivore feeding. For example, Landosky and Karowe (2014) suggest that specialist herbivores may have to contend with more effective chemical defenses by plants under elevated CO2. Hall, et al. (2005), in a study involving several oak and one legume species in a scrub oak ecosystem in Florida (see photo above), found that 700 ppm CO2 levels led to decreased damage to plants by four of six insect groups investigated. They did not see increases in plants’ production of carbon-based secondary metabolites, including total phenolic compounds, condensed tannins, hydrolyzable tannins, cellulose, hemicellulose, and lignin however. They concluded that the primary driver of decreased insect predation under elevated CO2 was lower overall plant nitrogen levels. They stated that the decline of nitrogen levels in foliage under elevated CO2 indicated lower foliar quality and hypothesized that the reductions in insect feeding stemmed from the combined effects of nutrient limitation and increases in parasitism and predation on the nutrient-constrained insects. They further stated that although insects try to compensate for lower nutrient content of leaves by eating more, they did not see an increased portion of damaged leaves in their study. These researchers did not report measurements of terpenoid compounds however, which are reported to represent the largest class of secondary metabolites (Wikipedia, 2022). In another study (Hall, et al., 2005a) found that concentrations of condensed tannins were higher in oak leaf litter under elevated CO2, which suggests that enhanced production of insecticidal compounds or other changes to plant tissues could affect not only insects that consume living plant tissue, but also detritivores.

Robinson et al. (2012) also investigated plants’ production of secondary metabolites in their literature review. Looking at all plant groups, they found that under elevated CO2 the production of nitrogen-based secondary metabolites (e.g., alkaloids, cyanogenic glycosides, and glucosinolates) decreased by 16% while the carbon-based secondary metabolites total phenolics, condensed tannins, and flavonoids increased by 19%, 22%, and 27% respectively. Another carbon-based metabolite, terpenoids, declined by 13%.  They further divided plants into grasses, shrubs, herbs/forbs, and trees and found differing responses to elevated CO2. Trees, for example, showed increased production of total glycosides and total phenolics, little change in production of total flavonoids, and a decline in the production of total terpenes. Like Hall et al., (2005), Robinson et al. found a strong and significant decrease in nitrogen concentrations under elevated CO2 for C3 plants. A decrease did not show up for C4 plants.

In addition to chemical defenses, plants have physical characteristics such as surface waxes, trichomes, secretory canals, and tissue toughness-enhancing substances such as lignin. All of these features can reduce the edibility of plants for arthropod herbivores. Robinson et al. (2012) found consistent responses to these characteristics under elevated CO2; leaf toughness and specific leaf weight increased by 11% and 18%, respectively, while specific leaf area did not show a significant change. They concluded that there is an increase in general “toughness” of leaves under elevated CO2. As did Hall et al., (2005), Robinson et al. concluded that elevated CO2 will induce changes in plant chemistry, physiology, and morphology that are likely to impact the nutritional quality of host plants for insect herbivores.

Habitat Disruptions: Changes in Plant Chemistry and Insect Decline

Numerous studies have documented a recent and dramatic decline in insect populations and discussed the probable cascading impacts of such declines through the food chain, affecting spiders, lizards, birds, and other organisms (Samways, et al., 2020; Cardoso, et al., 2020; Sánchez-Bayoa & Wyckhuys, 2019; Tallamy & Shriver, 2021). It has been argued that the main drivers of insect species declines are habitat loss and conversion to intensive agriculture and urbanization; pollution, mainly by synthetic pesticides and fertilizers; biological factors, including pathogens and introduced species; and climate change.

But a puzzling aspect is that some insect declines have been observed in nature preserves (Vogel, 2017) that presumably are not greatly affected by most of the above drivers. One example is a study spanning 27 years that found a 76% decline in flying insect biomass at several of Germany’s protected areas subject to rather low levels of human disturbance (Hallmann et al., 2017). Another study in rainforests of Puerto Rico, apparently not subject to influences such as light pollution, habitat loss, pesticides, or agriculture, reported biomass losses between 98% and 78% for ground-foraging and canopy-dwelling arthropods over a 36-year period, (Lister and Garcia, 2018). This leaves climate change as the likely culprit. But although the varied impacts of climate change, including heat episodes, drought, and other episodes of extreme weather could impact insect populations in remote as well as populated areas, the trends observed appear to far exceed the magnitude of such climate-related disturbances over the last several decades.

tent caterpillars; Shiela Brown, Public Domain Pics

Another puzzling aspect is that not all insect orders or feeding guilds seem to be equally affected. Sanchez-Bayoa & Wychuys (2019) whose article reports on a review of 73 historical reports, state that Lepidoptera, Hymenoptera and dung beetles (Coleoptera) appear to be the taxa most affected in terrestrial environments. Robinson et al. (2012) found that phloem feeders such as Homoptera respond positively to elevated CO2 while foliage feeders/Lepidoptera respond negatively. Lepidoptera were among the most impacted; relative growth rate, fecundity, and abundance all declined under high CO2 conditions, while relative consumption rate, total consumption, and development time all increased.

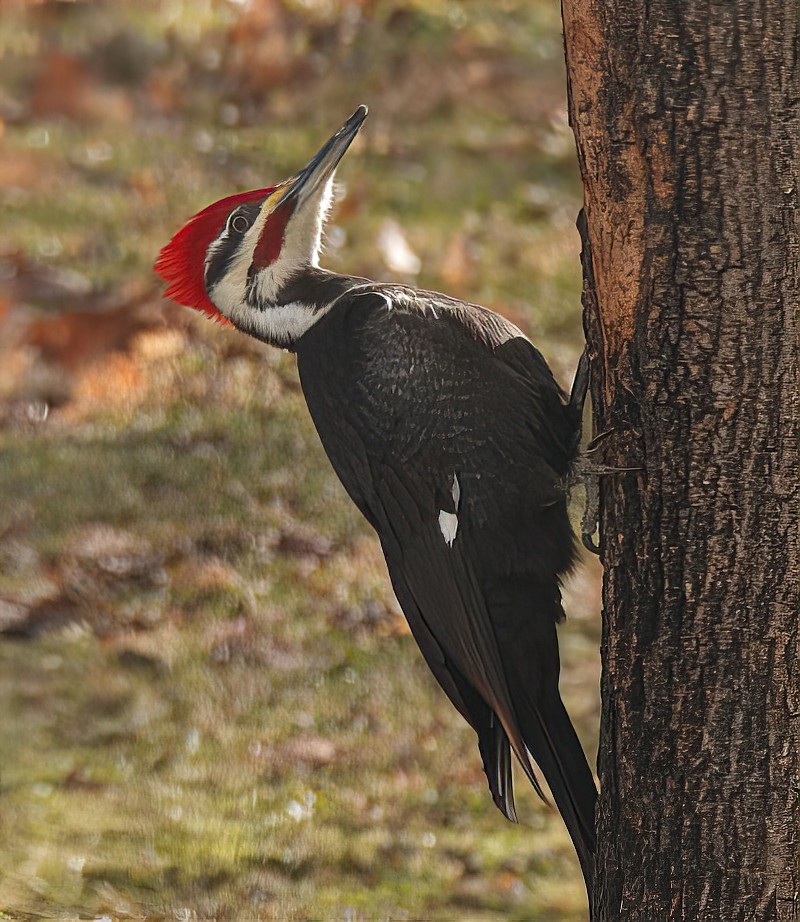
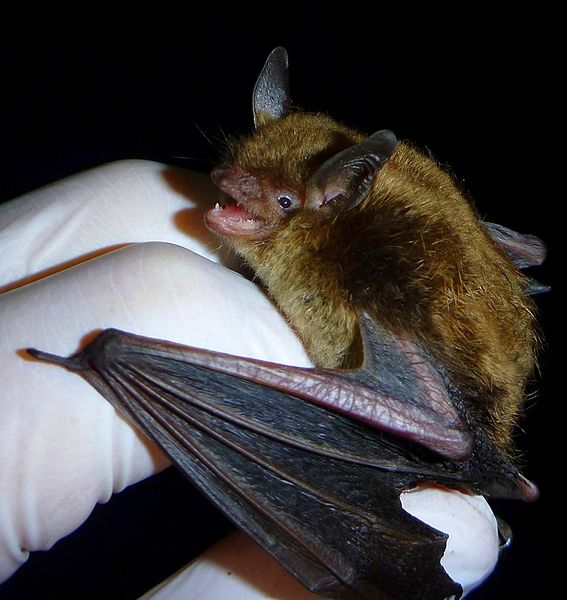
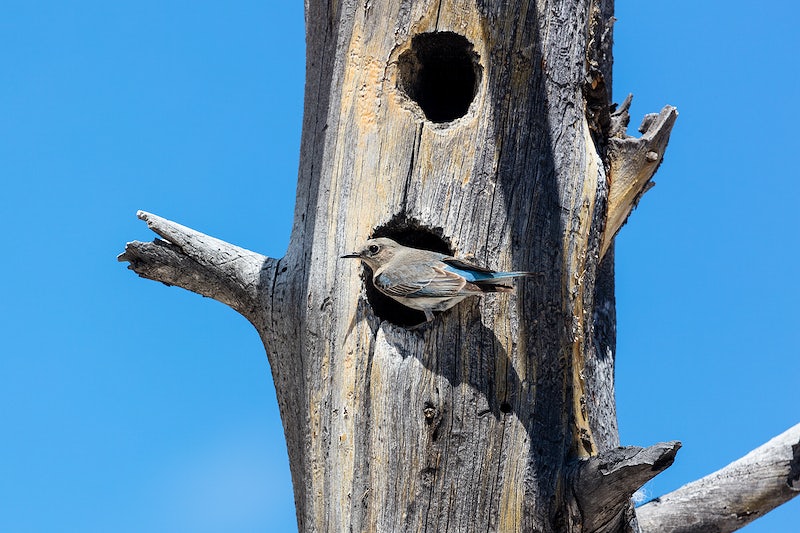
Most Lepidoptera are herbivorous, feeding in their larval stage, caterpillars, on plants. Caterpillars are key components of the terrestrial ecology; in most forests of the world, caterpillars consume more living leaves than all other animals combined (Janzen, 1988). Insect herbivores such as caterpillars are near the hub of most terrestrial food webs, comprising essential food for insect predators and parasitoids, spiders, amphibians, lizards, rodents, bats, birds, and even higher predators such as foxes and bears (Burghardt et al., 2010). At least 310 North American bird species are known to feed extensively on caterpillars, and the majority of terrestrial birds rely on insects during reproduction and other nutrient-limited periods in the annual cycle (Narango, Tallamy & Marra, 2018). Caterpillars and moths are the largest component of nestling diets in hundreds of species of migrant bird species (Tallamy & Shriver, 2021); they are among the “little things that run the world” (Wilson, 1987).

Carolina chickadee; one of the birds Dr. Tallamy focuses on because it feeds its young on caterpillars; photo by Dan Pancamo; through Wikimedia

Habitat Disruptions and Climate Change: Connected by CO2

The apparently heightened rate of decline of insect herbivores such as caterpillars compared to some other insects, and the findings that many declines have been observed in areas relatively unimpacted by direct human influences such as light pollution, pesticides, and land-use change, point to the likelihood of a broad, perhaps ubiquitous, cause. Climate change is such a broad cause. Even broader and more ubiquitous is the main driver of climate change, CO2. Every plant in the world is constantly bathed in an enriched concentration of this gas. A conclusion seems likely: CO2 is not only causing global warming and climate change but is also affecting life on this planet in ways that, while still poorly understood, are already reducing the nutritive value of food crops, may be a significant cause of the spread of invasive plants, and may be the main driver of insect declines and the cascading impacts of such declines on insect-eating animals such as birds.

What to do? 

To mitigate climate change and, as argued here, to mitigate habitat disruption, the steady rise in the atmosphere’s burden of CO2 must be halted, and then steps must be taken to lower the current concentration to a healthier level. These are not hopeless tasks. Although what has been a relentless rise in CO2 emissions at the global level continues, increases have slowed and even stopped in some parts of the world. Accelerating the development of low- and zero-carbon energy sources and encouraging energy conservation, as will be done through the U.S.’s Inflation Reduction Act, will further this progress.

More will be needed. Putting a significant and steadily increasing price on the carbon in fossil fuels is arguably the most important next step. Fossil fuels enjoy a free ride. The byproduct of their combustion, CO2, is dumped with little or no restrictions into the world’s atmosphere. A price on carbon would end this inequity. There are ways this could be done in a revenue-neutral (“fee and rebate”) manner that would avoid harm to economies and those with low- and moderate-incomes. A major step forward in pricing carbon by the European Union, a carbon border adjustment mechanism, is close to implementation. For more on this and other developments in cutting CO2 emissions, see the analyses and insights of the Carbon Tax Center and learn more about actions you can take to influence governments with Citizens’ Climate Lobby.

Not discussed here, but another stark example of habitat disruption is the increasing acidification of the world’s oceans caused by the dissolution of atmospheric CO2 in the waters. The ocean’s average pH has dropped from 8.2 to 8.1 within the last 200 years. Because pH is a logarithmic scale, this represents an increase in hydrogen ion concentration of over 25%, a change that is already threatening some marine creatures. More on this is available from many sources; e.g., Kolbert (2014).

References

Arhennius, Svante, 1896, On the Influence of Carbonic Acid in the Air upon the Temperature on the Ground, Philosophical Magazine and Journal of Science, 41, 237-276.

Belote, R., J. Weltzin, and R. Norby, 2004, Response of an Understory Plant Community to Elevated [CO2] Depends on Differential Responses of Dominant Invasive Species and Is Mediated by Soil Water Availability, New Phytologist 161, 827-835.

Blumenthal, D., V. Resco, J. Morgan, D. Williams, D. LeCain, E. Hardy, E. Pendall, and E. Bladyka, 2013, Invasive Forb Benefits from Water Savings by Native Plants and Carbon Fertilization Under Elevated CO2 and Warming, New Phytologist 200, 1156-1165.

Burghardt, Karin T., D. W. Tallamy, C. Philips, and K. Shropshire, 2010, Non-native plants reduce abundance, richness, and host specialization in lepidopteran communities, Ecosphere 1: 1-22.

Cardoso, P., et al. 2020, Scientists’ warning to humanity on insect extinctions, Biological Conservation 242, 108426. https://doi.org/10.1016/j.biocon.2020.108426

Dukes, J., N. Chiariello, S. Loarie, and C. Field, 2011, Strong Response of an Invasive Plant Species (Centaurea solstitialis L.) to Global Environmental Changes, Ecological Applications 21, 1887-1894.

Hall, M., P. Stiling, B. Hungate, B. Drake, and M. Hunter, 2005a, Effects of elevated CO2 and herbivore damage on litter quality in a scrub oak ecosystem, Journal of Chemical Ecology, 31, 2343-2356.

Hall, M., P. Stiling, D. Moon, B. Drake, and M. Hunter, 2005, Effects of elevated CO2 of foliar quality and herbivore damage in a scrub oak ecosystem. Journal of Chemical Ecology 31, 267-286.

Hallmann, C.A., Sorg, M., Jongejans, E., Siepel, H., Hofland, N., Schwan, H., Stenmans, W., Müller, A., Sumser, H., Hörren, T., Goulson, D., de Kroon, H., 2017, More than 75 percent decline over 27 years in total flying insect biomass in protected areas. PLoS One 12, e0185809.

Hattenschwiler, S. and C. Korner, 2003, Does Elevated CO2 Facilitate Naturalization of the Non-indegenous Prunus laurocerasus in Swiss Temperate Forests?, Functional Ecology 17, 778-785.

Janzen, Daniel H., 1988, Ecological Characterization of a Costa Rican Dry Forest Caterpillar Fauna, Biotropica, 20, 120-135.

Knepp, R., J. Hamilton, A. Zangeri, M. Berenbaum, and E. Delucia, 2007, Foliage of oaks grown under elevated CO2 reduces performance of Antherae Polyphemus (Lepidoptera: Saturnidae), Environmental Entomology 36, 609-617.

Kolbert, E., 2014, The Sixth Extinction, Henry Holt & Co., NY

Landosky, J., and D. Karowe, 2014, Will chemical defenses become more effective against specialist herbivores under elevated CO2? Global Change Biology, 20, 3159–3176.

Lister, B., and A. Garcia, 2018, Climate-driven declines in arthropod abundance restructure a rainforest food web, PNAS 115, E10397–E10406

Mohan, J., L. Ziska, W. Schlesinger, R. Thomas, R. Sicher, K. George, and J. Clark, 2006, Biomass and toxicity responses of poison ivy (Toxicodendron  radicans) to elevated atmospheric CO2. PNAS 103, 9086-9089.

Narango, D., D. Tallamy, and P. Marra, 2018, Nonnative plants reduce population growth of an insectivorous bird, PNAS 115: 11549–11554.

Polley, H., H. Johnson, H. Mayeux, C. Tischler, and D. Brown, 1996, Carbon Dioxide Enrichment Improves Growth, Water Relations, and Survival of Droughted Honey Mesquite (Prosopis glandulosa) Seedlings, Tree Physiology, 16, 817-823.

Robinson, E., G. Ryan, and J. Newman, 2012, A meta-analytical review of the effects of elevated CO2 on plant-arthropod interactions highlights the importance of interacting environmental and biological variables, New Phytologist 194, 321-336.

Samways, M., et al., 2020, Solutions for humanity on how to conserve insects, Biological Conservation 242, 108427. https://doi.org/10.1016/j.biocon.2020.108427

Sánchez-Bayoa, F. and K. Wyckhuys, 2019, Worldwide decline of the entomofauna: A review of its drivers, Biological Conservation 232, 8-27.

Sasek, T. and B. Strain, 1988, Effects of Carbon Dioxide Enrichment on the Growth and Morphology of Kudzu (Pueraria lobata), Weed Science 36, 28 – 36, DOI: https://doi.org/10.1017/S0043174500074415

Sasek, T. and B. Strain, 1991, Effects of CO2 Enrichment on the Growth and Morphology of a Native and Introduced Honeysuckle Vine, American Journal of Botany 78, 69-75.

Soares, J., C. Santos, S Carvalho, M Pintado, and M. Vasconceios, 2019, Preserving the nutritional quality of crop plants under a changing climate: importance and strategies. Plant and Soil 443, 1-26. https://doi.org/10.1007/s11104-019-04229-0

Song, L., J. Wu, C. Li, F. Li, S. Peng, and B. Chen, 2009, Different responses of invasive and native species to elevated CO2 concentration, Acta Oecologica 35, 128-135.

Tallamy, D. and W.G. Shriver, 2021, Are declines in insects and insectivorous birds related? Ornithological Applications 123: 1–8, DOI: 10.1093/ornithapp/duaa059

Tollefson, J., 2020, How hot will Earth get by 2100? Nature News Feature, https://www.nature.com/articles/d41586-020-01125-x  accessed 12/15/2022

Vogel, G., 2017, Where Have All the Insects Gone? Surveys in German nature preserves point to a dramatic decline in insect biomass. Key members of ecosystems may be slipping away, Science 356, 376-379.

Wikipedia, 2022, Terpenoid, https://en.wikipedia.org/wiki/Terpenoid accessed 12/16/22.

Wilson, Edward O., 1987, The Little Things That Run the World (The Importance and Conservation of Invertebrates), Conservation Biology, 1, 344-346.

Ziska, L., 2010, Elevated Carbon Dioxide Alters Chemical Management of Canada Thistle in No-till Soybean, Field Crops Research 119, 299-303.

Ziska, L., Shaun Falukner, and John Lydon, 2004, Changes in biomass and root: Shoot Ratio of Field-grown Canada Thistle (Cirsium arvense), a Noxious, Invasive Wed, with Elevated CO2: Implications for Control with Glyphosate, Weed Science 52, 584-588.

Ziska, L.H., J.S. Pettis, J. Edwards, J.E. Hancock, M.B. Tomecek, A. Clark, J.S. Dukes, I. Loladze, and H.W. Polley, 2016, Rising atmospheric CO2 is reducing the protein concentration of a floral pollen source essential for North American bees, Proc. R. Soc. B, 283, 20160414, http://dx.doi.org/10.1098/rspb.2016.0414

Ziska, Lewis, 2022, Greenhouse Planet: How Rising CO2 Changes Plants and Life as We Know It, Columbia University Press, NY.

Wood Packaging: Pests Still Coming, USDA Not Taking Action

photo courtesy of Oregon Department of Agriculture

As we know, wood packaging (SWPM; crates, pallets, spools, etc.) is a high-risk pathway for introduction of bark- and wood-infesting insects (borers). (To see my 40 earlier blogs about wood packaging material, scroll down below archives to “Categories,” click on “wood packaging”.) Examples of highly damaging pests introduced to North America include Asian longhorned beetle; emerald ash borer; redbay ambrosia beetle; sirex woodwasp; possibly the polyphagous and Kuroshio shot hole borers; Mediterranean oak borer; and dozens of others. (As of 2014, 58 new species of non-native wood- or bark-boring insects had been detected in the past 30 years [Leung et al. 2014]).

The Asian longhorned beetle and emerald ash borer were probably introduced before the World Trade Organization (WTO) came into effect in 1994; many of the others were detected – if not introduced – after that date. This global trade agreement not only facilitated rapid growth in trade volumes; it also imposed stringent conditions for adoption of plant health (= phytosanitary) measures aimed at preventing pest introductions. (For a review of the WTO restrictions, see my Fading Forests II report, here).

While the risk of pests travelling in raw wood was well known, U.S. and international phytosanitary agencies became aware that wood packaging fit into that category with detection of the ALB in New York and other wood-borer introductions. They acted remarkably rapidly to reduce this risk by negotiating and adopting International Standard for Phytosanitary Measures (ISPM) #15 in 2002.

The goal of ISPM#15 is to “significantly reduce” [not eliminate] the risk of pests associated with solid wood used for constructing packaging (e.g., crates, pallets), from being introduced to other countries through international trade.

This first international standard addressing a pathway of introductions was adopted 20 years ago. (The U.S. fully implemented ISPM#15 in 2006; see either article by Haack for a description of the phase-in period.) So – how great is the risk of pest introduction in wood packaging now? What proportion of these incoming containers are likely to be harboring tree-killing insects? Since it is impossible to reduce that risk to 0 while continuing trade using wood packaging, what is an acceptable level of risk? In determining that level, we must keep in mind the huge volumes of wood packaging being used in international trade, and the serious damage these wood-borers can cause. (See the pest profiles in the links provided above.)

I applaud the international phytosanitary community for acting fast and for choosing a pathway standard rather than try to differentiate the level of risk associated with any particular transaction – given that wood packaging could be made from dozens or hundreds of tree taxa, there are thousands of species of wood-boring insects, and the likelihood of an introduction depends in part on the exporting and importing countries. Plus, international trade involves huge volumes of goods. According to Haack et al. (2022), ~ 55 million TEU (shipping containers measured as twenty-foot equivalents) entered the U.S. in 2020. This is a 68% increase over the volume in 2003. Imports in the first half of 2020 were down because of the COVID epidemic. They then grew rapidly through the first half of 2022; imports from Asia in the first 10 months of 2022 were 21% higher than in the same period in 2019 (Mongelluzzo 2022). Haack et al. (2022) note that the number of countries from which SWPM originated more than doubled from 2003–2004 to 2010–2020, although it dropped after 2018.

In 2014, Haack et al. published an estimate of the pest approach rate in wood packaging as of 2009. Depending on which countries were included and how the time periods were selected to separate pre- and post-adoption of ISPM#15, they reported a 36–52% reduction in the SWPM infestation rate following ISPM#15 implementation. This resulted in an estimated infestation rate of 0.1% (1/10th of 1%). In a recent blog, I applied this estimated approach rate to find that probably 11,000 containers per year transported pests to North America in 2021; 80% of these shipments came to the United States.

Since 2009, traders have gained 13 more years of experience. More important, in 2009 the standard was changed to require that wood packaging be constructed from wood that had been debarked before treatment. There is a tolerance limit for small patches of residual bark. Given that bark provides shelter both for insects already there, and facilitates any new infestation after the treatment was performed, it was expected that this change would further reduce the pest risk.

Since more than a decade has passed since the original analysis, and wood-borers continue to be found in wood packaging – in the U.S. and elsewhere – Haack and colleagues have re-analyzed the pest approach rates (see Haack et al. 2022). Their objectives were to

(1) compare pre-and post-ISPM#15 borer-infestation rates;

(2) compare the borer detection rates individually for three kinds of imports and key US trading partners;

(3) see whether wood borer presence varies by season; and

(4) assess the diversity of borer taxa detected overall, and by cargo category and country of origin.

Over the entire 17-year period 2003 – 2020, 87,571 consignments met the conditions for the study: they contained wood packaging that bore the ISPM#15 mark (from 2006 and onwards) indicating it had been treated as required; and the shipment was not from Canada (the U.S. does not require wood packaging from Canada to comply with ISPM#15).

They analyzed the data for the entire 17-year period and separately for four phases:

1) before the U.S. implemented ISPM#15 (2003-2004);

2) phasing-in of U.S. implementation (2005 – 2006);

3) full implementation – but without any restriction on THE presence of bark (2007-2009); and

4) full implementation with restrictions on bark (2010 – 2021).

Over the period 2003– 2020, wood borers were detected in 180 of the 87,571 consignments, or 0.21%. This was 38% less than the 0.34% infestation rate in 2003-2004, before the U.S. implemented ISPM#15. Still, the US had required China to treat its wood packaging as of December 1998 because of introduction of ALB. However, the reduction was greatest in the first phase (2005-2006); in subsequent periods the pest approach rate inched back up. Detection rates have been relatively constant since 2005 despite the requirement in 2009 that bark be removed and a resulting reduction in the presence of bark (it fell from 40% or more of inspected consignments before 2009 to 15% after 2010). 

Unfortunately, the data used in the study do not indicate if borers detected on wood were located under any bark that was present. There might be some indication from the species detected: 100% of Scolytinae identified to genus or species detected before 2007 were true bark beetles (which develop primarily under bark), but only 23% in 2010–2020 period.

The data revealed no strong seasonal pattern.  

Types of Wood Packaging

The study findings indicate that crates are the type of wood packaging most likely to be infested by insects. While crates constituted only 7.5% of the wood packaging inspected, they made up 29.4% of the infested packaging – or four times greater than their proportion of the dataset. Pallets constituted 88.6% of the inspected wood packaging, but only 67.2% of the infested shipments. Dunnage and “other” wood packaging made up insignificant proportions of both total wood packaging inspected and wood packaging found to be infested. (Of course, dunnage can still pose a threat; see my blog about issues in Houston with dunnage bracing breakbulk cargo.) The Haack et al. (2022) study did not examine dunnage accompanying breakbulk shipments.  

Records of Various countries

The 180 infested consignments originated from 30 countries. For two of these countries, the percentage of wood packaging found to be infested was higher than the proportion of all wood packaging from that country that was inspected. Packaging from China made up 4.6% of all shipments inspected, but 22% of the 180 consignments with infested wood packaging. Thus the proportion Chinese consignments with infested wood is five times greater than expected based on their proportion of the dataset. The rate of wood packaging from China that is infested has remained relatively steady – as I noted above. The Chinese infestation rate was 1.26% during 2003–2004, and ranged from 0.58 to 1.11% during the next three periods.

I remind you, again, that the U.S. has required treatment of wood packaging from China since December 1998. Why does this country continue to ship pest-infested wood packaging to the United States? Why are the responsible agencies in the United States not taking action to correct this problem? (DHS Bureau of Customs and Border Protection enhanced its enforcement in 2017; see my blogs.)

A second country with a record of non-compliant wood packaging – Italy – has done better. The level of pest detection still exceeded their expected proportional level – that is, Italy constituted 12.7% of all inspected shipments, but had 15% of infested consignments. Still, Italy has reduced detection rates by almost two-thirds over the 17 years of the study. The Italian statistics would have been even better if there had not been a spike of infested wood in 2015 – 2018 – for unknown reasons.

The data indicate that a third country, Mexico, has improved the pest-free quality of wood packaging accompanying it exports.

Wood from Costa Rica and Turkey has deteriorated as regards pest infestation rates.The borer detection rate on Costa Rican shipments rose from 0.072% during all of 2003–2009 to 0.665% during 2010–2020. Pest-detection rates for Turkey were actually 0 during 2003–2004 (only 59 consignments) but rose to 1.05% during 2010– 2020.

Disturbing Trends

The data reveal other trends that I find disturbing:

  • While the pest approach rate has fallen since U.S. implementation of ISPM#15, the extent of the decline has progressively decreased during each period studied: the reduction during 2005–2006 was 61%; during 2007–2009, 47%; during 2010-2020 only 36%.
  • The 2010 – 2020 pest approach rate was calculated at 0.22%. This is more than double the rate based on 2009 data (0.1%, as stated in the 2014 paper). However, we should be cautious in making this comparison because the 2014 and 2022 studies used different methods (see below). The bottom line, however, is that the approach rate remains too high, in my view. Our forests continue to be exposed to the risk of introduction of highly damaging wood-boring pests. Furthermore, since the number of countries sending us infested wood packaging has increased, those potential pests include insects from a greater variety of countries (biomes).
  • Given the higher number of countries involved and rising proportion of wood that is infested, it is not surprising that the diversity of wood borers found in wood packaging increased. Cerambycidae were consistently the most commonly intercepted borers – making up just under half of the total for the 17 years. Scolytinae were consistently second, at 39%. Still, all major families of borers had been intercepted throughout the period.

Explanation

From the perspective of protecting our forests, what matters is whether the “current” infestation rate is significantly below the rate before ISPM#15 was implemented. As noted, the infestation rate in the 2010-2020 period (0.22%) is, on first glance, more than twice as high as the 2009 approach rate as calculated in the 2014 paper (0.1%). However, the earlier calculation excluded reports of wood packaging from China and Mexico for reasons given in the 2014 paper. Since these countries are among the top three sources of imports to the U.S., and all have had relatively high levels of infested wood packaging, this difference must have had a significant impact on the final finding.

Indeed, the supplementary materials in Haack et al. (2022) show just such a big impact. When records from China and Mexico are excluded from the calculation, the 2010-2020 approach rate appears to have been even higher — 0.272%. This is a reduction from the pre-ISPM#15 approach rate (0.299%) of only 9% — a quarter of the reduction found when data from China and Mexico were included (note the 36% reduction noted above). This difference in approach rate estimates reflects Mexico’s success in cleaning up its wood packaging (as noted above). Since China had “steady” infestation rates throughout, adding or dropping China had less of an impact.

The data do not show a significant drop in pest approach rates during the period 2010-2020 compared to pre-ISPM#15 levels, which is disappointing.  Scientists do not know why this happened. It could reflect many of the reasons discussed in the 2022 paper. Perhaps the most important factor is that reporting data on a consignment basis does not allow us to detect whether the numbers of a pest species present have decreased. [See point 5 below.]

The fact is that a pallet or crate bearing the ISPM#15 mark has not proved to be reliable as to whether the wood is pest-free. (This might be because the wood had not been treated, or that it was, but the treatment failed). All the pests detected in study (after 2006) were in wood packaging bearing the ISPM#15 mark. I have noted in past blogs [click on the “wood packaging” category to bring up blogs about wood packaging and enforcement] that Customs and Border Protection also reported that nearly all the wood packaging in which that they detected insect pests bore the mark.

Conclusions: Haack et al. (2022)

Haack et al. (2022) note that U.S. imports have risen 68% by volume from 2003 to 2020 (with additional growth since; see above); however, borer detection rates have remained rather steady. This, plus the apparently lower number of woodborers established in recent years, suggest that ISPM#15 is helping to mitigate risks. However, the reduction in detection rates is less than hoped. They discuss ten possible explanations. Six of these factors were discussed in the original analysis (Haack et al. 2014); four others are new.

(1) Pest Thermotolerance. Can pests tolerate the heat treatment schedule mandated by ISPM#15? Haack et al. (2022) note that this schedule was based on one intended to kill the pinewood nematode and that it was recognized that some pests might be able to tolerate those conditions (Haack et al. 2014).  The authors review the literature and conclude that some of the live borers found in heat-treated wood packaging in the study probably did survive the heat treatment. They note that studies are now under way to test temperatures that are lethal to various borers. I have raised the issue that standards must be based on lethal temperatures that can be achieved in practice; otherwise, they won’t protect forests from introduced pests.

(2) Unintentional non-compliance. The authors concluded that accidental treatment failures are likely. They note that the International Plant Protection Convention (IPPC) has issued guidance on handling and testing during heat treatment and fumigation.

(3) Fraud. The authors conclude that fraud is possible, but that the incidence at the global scale is unknown. Each country is responsible for their own compliance. Unfortunately, there is no effective means for independently testing whether treatments have been applied. Still, we note that all live insects evaluated in this paper were in wood package that bore the required stamp and was apparently compliant.

(4) Post-treatment colonization. Haack et al. (2022) note that adoption of the bark requirements in 2009 was intended to reduce re-infestation risk. They note that fewer true bark beetles (that develop under bark) have been detected in recent years compared w/ ambrosia beetles (that develop in wood).  As I noted above, the survey data do not reveal whether insects detected by inspectors were under any remaining bark.

(5) AQIM data collection protocols. The authors note that reporting of wood borer detections by consignment conceals the per-piece infestation rate. There might be many fewer individuals of a pest in a container now – and this is important because fewer individuals pose a lower establishment risk (lower propagule pressure).

(6) Pre-ISPM actions.  Some countries had begun requiring treatment of wood packaging before 2003, when data collection for the study began. Thus the approach rate might have already been reduced before ISPM#15 was implemented in the U.S., leading to a smaller apparent change.

(7) Level of detection. All the analyses assumed that the detection abilities of port inspectors remained the same over the 17 years of the study. However, inspectors might have improved their efficacy through improvements in training, inspection techniques, or technology. If so, the apparent impact of ISPM#15 would be lessened in recent years. Haack et al. (2022) say estimating the effectiveness of inspections is not possible in the absence of a “leakage survey” conducted on inspected goods to see how often target pests are missed.

(8) Changing trade partners. Countries have varying levels of effort and efficacy in enforcing ISPM#15.

(9) Varying trees and their associated borers. Countries and global regions are home to different tree species and associated insects. Therefore, changes in trading partners – or forest pest conditions within a country – can affect the number and species of potential pests harbored in the wood packaging approaching our borders.

(10) Practical limits on compliance. Reducing infestation levels to near zero through reliance on application of the ISPM#15 standard would require nearly universal compliance by industry, using highly effective treatments. Haack et al. (2022) note that such compliance levels might be difficult to achieve without either very strong incentives or intensive oversight and significant penalties for noncompliant exporters. I note that I have urged the U.S. to enhance both; link to blogs at least CBP has taken action to step up enforcement.

Haack et al. (2022) call for improved education and outreach by the IPPC, plus greater cooperation and information sharing among trading countries. I note that the Cary Institute is pursuing opening data on treatment facilities’ records so importers can hire the best.

Haack et al. (2022) conclude that ISPM#15 has resulted in marked decreases in rates of borer detection in wood packaging. However, problem areas remain re: some types of commercial goods and exporting countries. Given the enormous and growing volume of international trade, the relatively low risk associated with individual crates or pallets still poses a real risk for pest intro.

Still, they consider that the near global acceptance of ISPM#15 indicates a strong commitment by the world community to minimize movement of wood pests in SWPM through international trade.

Haack et al. (2022) call for several improvements. Some concern data to support analysis of the risk level. First, recording the numbers of infested pieces instead of reporting only consignments would help determine the numbers of insects reaching our borders. They also wish to learn whether when bark is present if it exceeds the current tolerance limits; and the type of treatment applied to each infested piece of wood packaging.

They also note opportunities to improve ISPM#15 implementation and enforcement through training on applying treatments, marking and repairing wood packaging, compiling the required records, and inspecting treatment facilities.

Oregon ash swamp; photo by Wyatt Williams, Oregon Department of Forestr

Faith’s Conclusions

In my view, it is less important whether the current approach rate is exactly 0.22% or somewhat less or more. What is important:

  • the pest approach rate is not acceptable given the huge and rising volume of imports, potential for introductions from new trading partners (with different insect faunas), and the great damage caused by wood-boring insects. 
  •  long-standing enforcement problems have not been resolved (i.e., Chinese wood packaging). Perhaps DHS CBP’s enhanced enforcement will bring improvements. CBP staff expressed disappointment in August 2022.

American government agencies must take more effective action to ensure that trade partners comply with ISPM#15. They should also look more aggressively at other actions to curtail introductions via this pathway, e.g.,

  • U.S. and Canada refuse to accept wood packaging from foreign suppliers that have a record of repeated violations – whatever the apparent cause of the non-compliance. Institute severe penalties to deter foreign suppliers from taking devious steps to escape being associated with their violation record.
  • APHIS and CBP and their Canadian counterparts provide guidance to importers on which foreign treatment facilities have a record of poor compliance or suspected fraud – so they can avoid purchasing SWPM from them. I am hopeful that the voluntary industry program described here will help importers avoid using wood packaging from unreliable suppliers in the exporting country.
  • Encourage a rapid switch to materials that won’t transport wood-borers. Plastic is one such material. While no one wants to encourage production of more plastic, the Earth is drowning under discarded plastic. Some firms are recycling plastic waste into pallets.

The two articles by Haack et al. – 2014 and 2022 – fully describe the methodology used, the structure of USDA’s Agriculture Quarantine Inspection Monitoring (AQIM) program, detailed requirements of ISPM#15, the phases of U.S. implementation, etc.  Also see the supplemental data sheet in Haack et al. (2022) that compares the methods used in each analysis.

SOURCES

Haack RA, Britton KO, Brockerhoff EG, Cavey JF, Garrett LJ, et al. (2014) Effectiveness of the International Phytosanitary Standard ISPM No. 15 on Reducing Wood Borer Infestation Rates in Wood Packaging Material Entering the United States. PLoS ONE 9(5): e96611. doi:10.1371/journal.pone.0096611

Haack RA, Hardin JA, Caton BP and Petrice TR (2022) Wood borer detection rates on wood packaging materials entering the United States during different phases of ISPM#15 implementation and regulatory changes. Frontiers in Forests and Global Change 5:1069117. doi: 10.3389/ffgc.2022.1069117

Leung, B., M.R. Springborn, J.A. Turner, and E.G. Brockerhoff. 2014. Pathway-level risk analysis: the net present value of an invasive species policy in the US. Front Ecol Environ. 2014. doi:10.1890/130311

Mongelluzzo, B. Trans-Pacific volume decline picks up pace in October. JOC. November 17, 2022. https://www.joc.com/maritime-news/container-lines/trans-pacific-volume-decline-picks-pace-october_20221117.html?utm_source=Eloqua&utm_medium=email&utm_campaign=CL_JOC%20Daily%2011%2F18%2F22%20NONSUBSCRIBER_PC015255_e-production_E-148476_KB_1118_0617

Posted by Faith Campbell

We welcome comments that supplement or correct factual information, suggest new approaches, or promote thoughtful consideration. We post comments that disagree with us — but not those we judge to be not civil or inflammatory.

For a detailed discussion of the policies and practices that have allowed these pests to enter and spread – and that do not promote effective restoration strategies – review the Fading Forests report at http://treeimprovement.utk.edu/FadingForests.htm

or

www.fadingforests.org

A Forest without Big Trees — Which Animals Will be Decimated?

In an earlier blog about tree extinctions, I commented that less drastic impacts by pests can also be important. I mentioned specifically that clumps of beech root sprouts cannot duplicate the quantities of nuts and cavities provided by mature beech trees.

This thought prompted me to search for information about use of tree cavities by wildlife. The articles I have found are decades old and largely focus on implications for management of forests for timber. Timber production conflicts with a goal of ensuring the presence of large (“overmature”), trees, especially those with dead branches, and completely dead trees (“snags”). These articles were written too long ago to address the possible impacts of non-native insects and pathogens – although there is some discussion of widespread mortality of pines caused by the mountain pine beetle.

These sources make clear that species that make cavities are keystone species. Many other wildlife species depend on them — birds, bats and terrestrial animals – mammals and herps. Furthermore, these cavity-associated species require forests with significant numbers of large, old, declining trees. When non-native insects or pathogens kill those trees, there might be a short-term bonanza of dying trees – suitable for nesting and foraging; and wood-feeding insects to provide food. But afterwards – for decades or longer – there will probably be small-diameter trees, and different species. Can the cavity-dependent species find habitat or food under these circumstances?

[By coincidence, the PBS program “Nature” broadcast an episode on woodpeckers on the 2nd of November! The title is “The Hole Story”. ]

Cavities provide a variety of habitats for many species – including some not usually thought of as “forest” species. Among the 85 North American bird species identified by Scott et al. as associated with cavities are seven species of ducks, two vultures, three falcons, 12 owls, two swifts, six flycatchers, two swallows, purple martin, seven chickadees, three titmice, four nuthatches, brown creeper, five wrens, three bluebirds, and two warblers. They point out that the majority of these birds are insectivores. Woodpeckers are especially important predators of tree-killing bark beetles.

Goodburn and Lorimer found that more than 40 species of birds and mammals in hardwood forests of Wisconsin and Michigan use cavities in snags and dead portions of live trees for nest sites, dens, escape cover, and winter shelter. Bunnell reported that 67 vertebrate species commonly use cavities in the Pacific Northwest. Chepps et al., Daily et al., and Wiggins focus on specific species in the Rocky Mountains. (Full citations for all sources are at the end of the blog.)

While Scott et al. (published in 1977) do not address the impact of non-native pests, their profiles of individual bird species sometimes name specific types of trees favored. Several of these tree taxa have been decimated by such non-native pests, or face such attack in the near future. Thus, concern appears warranted for:

pileated woodpecker; photo by Jo Zimni via Flickr
  • birds nesting in American elm, including two that are quite large so they require large trees to accommodate their nests: common goldeneye (a duck) and pileated woodpecker (larger than a crow).
  • the pileated woodpecker also nests in ash and beech and here
  • the yellow-bellied sapsucker nests in butternut.

How many species depended on American chestnut, which – before the blight — grew to diameters up to 5 feet, heights of 70 to 100 feet, and had hollow centers (USDA 2022)?

In the West, some nesting tree species are under imminent threat from invasive shot hole borers, goldspotted oak borer, or sudden oak death. Detection of the emerald ash borer in Oregon portends a longer-term threat. Birds likely to feel these impacts include the acorn woodpecker, ash-throated flycatcher, and purple martin. The golden-fronted woodpecker is associated with oaks in parts of Texas where oak wilt is severely affecting live oaks.

ash-throated flycatcher; photo by Mick Thompson via Flickr

At the beginning of the 21st Century – before widespread mortality caused by the emerald ash borer — densities of snags in the managed forests in the Lake States were apparently already insufficient to sustain population densities of cavity nesting birds. Pileated woodpeckers and chimney swifts both prefer snags greater than 50 cm dbh, which are significantly less abundant in harvested stands. For six of eight bird species studied, the number of breeding pairs was significantly higher in old-growth northern hardwood stands than in those under management (Goodburn and Lorimer).

Strong Primary Excavators are Keystone Species

Cavity nesters are commonly divided into:

1) primary excavators that excavate their own cavities. These are further divided into strong excavators – those species that forage by drilling, boring, or hammering into wood or soil; and weak excavators – those species that probe or glean bark, branches, and leaves to acquire prey.

2) secondary cavity users, that use holes made by primary cavity excavators (Bunnell).

Strong primary excavators tend to be large, e.g., most woodpeckers, sapsuckers, and the northern flicker. Weak excavators are mostly smaller species, such as chickadees and nuthatches; plus those woodpeckers that forage primarily by probing and gleaning, extracting seeds, or capturing insects in flight [e.g., acorn woodpecker (Melanerpes formicivorus), downy woodpecker (Picoides pubescens)] (Bunnell).

Bunnell considers strong excavators to be keystone species because so many other cavity users depend on them. Their loss would seriously disrupt forest ecosystems. For example, in the Pacific Northwest, only nine of 22 avian primary excavators are strong excavators. Another 45 species are secondary cavity users. These include waterfowl, tree swallows, and some mammals such as flying squirrels. Some cavity nesters support an even wider group of species: in the Pacific Northwest, at least 23 bird species, six mammal species, and numerous arthropods (nine orders and 22 families) feed on sap and insects collected at holes drilled by sapsuckers (Bunnell). [I discuss sapsuckers’ ecosystem role in greater detail later.]

Tree Characteristics

There is general agreement that animals dependent on tree cavities “prefer” (actually, require) trees that are large – tall, of large circumference, and sturdy – while having decayed interiors.

Size:

As Bunnell notes, larger snags provide more room and tend to stand longer without breaking, so they provide greater opportunities for cavity use. They also tend to be taller, so they offer higher nest sites that provide better protection from ground-dwelling predators. While larger-diameter trees remain standing longer regardless of the cause of mortality, snags created by fire usually fall sooner than do other snags. Beetle-killed trees are more attractive to cavity nesters that tend to excavate nest sites in trees on which they have foraged.

In the upper Midwest, cavity trees were a scare resource, even in unmanaged forests. Mean diameters for live cavity trees were twice as large as the mean diameter of the live trees in stands under a management regime. Such larger-diameter snags were more numerous in old-growth than in managed stands, especially in mixed hemlock-hardwood stands (Goodburn and Lorimer).

The Importance of Decay

Excavating a cavity demands considerable energy, so birds seek sites where a fungal infection has softened the interior wood. The exterior wood must remain strong to prevent collapse of the nest. These rots take time to develop, so they appear more often in older, even dying, trees. Bunnell, Scott et al., Chepps et al., and Goodburn and Lorimer all emphasize the role of decay in providing suitable cavity sites. Chepps et al. compared the aspen trees used by four species of cavity-nesting birds in central Arizona. Not only were nest trees softer than neighboring trees; they were softer at the spot where the nests were excavated than at other heights. [Spring (1965) provides a fun discussion of different species’ adaptations to the energy demands of hard pecking and climbing vertical trunks.]

Live v. Dead Trees

However, the need for decay does not necessarily mean birds prefer dead trees. Goodburn and Lorimer found that in Wisconsin and Michigan, a large percentage of all cavities found were in live trees.  

Bunnell found that strong excavators select trees with less visible signs of decay. Where possible, secondary users will also use live trees. However, intense competition often forces them to use dead trees.

Hardwoods v. Conifers

Bunnell states that deciduous trees more often contain internal rot surrounded by a sound outer shell than do conifers (at least this is true in the Pacific Northwest). He found that cavity nesters chose hardwoods for 80–95% of their nest sites even where hardwoods comprised only 5–15% of the available tree stems. He concluded that availability of living hardwoods had a significant influence on strong excavators in the West, although probably was less important in hardwood stands in the East.

Taxa Dependent on Other Types of Cavity

Some species depend on cavities created by forces other than bird excavations, such as decay or fire. These include most of the mammals, especially the larger ones e.g., American martens, fishers, porcupines, and black bears. These natural cavities are often uncommon. Vaux’s swifts nest and roost in hollow snags large enough that they can fly in a spiral formation to enter and leave (Bunnell).

little brown bat Myotis sp. photo by S.M. Bishop via Wikimedia Commons

Bats are a special case. Bats are unique among mammals of their size in having long lives, low reproductive rates, and relatively long periods of infant dependency. They also play a key ecological role as the major predators of nocturnal flying insects (van den Driesche 1999). Also many species are in perilous conservation status: half of the 16 bat species in British Columbia were listed as threatened or endangered as of 1998 (van den Driesche). This was before the deadly disease whitenose syndrome had been detected in North America.

Bats require larger trees. In the Pacific Northwest at least, that choice often means conifers (Bunnell). Roosts are difficult to find, so samples are small. A study on the west coast of Vancouver Island (van den Driessche), located only nine roosts despite searching during three summers. Five roosts were in large-diameter (old) western red cedar, with dead tops and extensive cracks.

Brown creepers and some amphibians and reptiles nest or seek cover under slabs of loose bark, which are typically found on dead or dying trees. The same large, mature and old-growth conifer trees also provide preferred foraging habitat, since there is a higher density of arthropod prey on their deeply furrowed bark. While Wiggins (2005) studied bird populations in the Rocky Mountains, he cited studies in the eastern United States, specifically in the Blue Ridge and Allegheny mountains, that have found similar results. Goodburn and Lorimer found that in National forests in Wisconsin and Michigan, only 15% of trees consisted of the necessary snags with loose bark plates. Suitable trees were most frequent old-growth hemlock-hardwood stands, and on larger-diameter snags. A high proportion of the snags with loose bark were yellow birch (Betula alleghaniensis).

Importance of foraging sites

As Bunnell points out, a bird must feed itself before it can nest. Foraging trees and snags are usually smaller than nesting trees. Furthermore, birds need many more foraging sites than nesting sites. The situation perhaps most pertinent to our usual focus on invasive pests concerns bird species’ response to mountain pine beetle outbreaks. Red-breasted nuthatches and mountain chickadees increasing dramatically in apparent response to the beetle epidemic. When most of the conifers had been killed, and numbers of beetles diminished, numbers of these bird species also declined–despite the increased availability of conifer snags for nesting. Indeed, the birds continued to nest primarily in aspen during the epidemic.

Bunnell reiterates that snags of all sizes are needed; they provide perching, foraging, and hawking sites for bird species beyond cavity nesters as well as sustenance for bryophytes, insects, and terrestrial breeding salamanders. He says more than 200 studies reported harvesting of standing dead trees in beetle-killed forests had negative effects on bird, mammal, and fish species.  

Other Dependencies – Food Sources

yellow-bellied flycather; photo by Dennis Church via Flickr

A few studies looked at the role of cavity-creating birds in providing food sources. The focus was on sapsuckers. They drill sapwells into trees’ phloem; sap flowing into these wells attracts many other species. In Michigan, Rissler determined that yellow-bellied sapsuckers’ sapwells attracted insects in seven orders and 20 families, especially Coleoptera, Diptera (other than Tephritidae), bald-faced hornets, and Lepidoptera. Daily et al. (1993) cites other studies showing that ruby throat and rufous hummingbirds have extended their breeding ranges by relying on these sapwells for nutrition in early spring before flowers open. [The “Nature” program covers this behavior.]

In a subalpine ecosystem in Colorado, Daily et al. found that red-naped sapsuckers support other species in two ways. First, they excavate nest cavities in fungus-infected aspens that are utilized by at least seven secondary cavity nesting bird species. When they feed, they drill sapwells that nourish more than 40 species – including hummingbirds, warblers, and chipmunks. Daily et al. called this a keystone species complex comprised of sapsuckers, willows, aspens, and a heartwood fungus. Disappearance of any element of the complex could cause an unanticipated unraveling of the community.

Goodburn and Lorimer looked at the availability of downed wood but did not discuss the implications of the presence of only small-diameter coarse woody debris.

Efforts to Accommodate Biodiversity Needs

Scott et al. reported in 1977 that the USDA Forest Service had required staff at regional and National Forest levels to develop snag retention policies. Twenty years later, Goodburn and Lorimer noted that Forest Service management guidelines for some Wisconsin and Michigan National forests since the early 1980s have called for the retention of all active cavity trees and  5-10 snags (larger than 30 cm dbh)/ha. However, as I noted above, they fear that these recommended snag retention levels might still be too limited to support cavity nesters. They found that two species that prefer snags greater than 50 cm dbh, pileated woodpeckers and chimney swifts, were significantly more abundant in old-growth than in selection stands. Furthermore, the number of breeding pairs of six species was at least 30% higher in old-growth northern hardwood than in selection stands and more than 85% higher in selection cuts than even-aged.

Goodburn and Lorimer cited others’ findings that removal of some live timber and snags in an Arizona ponderosa pine forest reduced cavity-nesting bird populations by 50%. Species affected were primarily violet-green swallows, pygmy nuthatches, and northern three-toed woodpeckers.

Female mountain bluebird by Jacob W. Frank. Original public domain image from Flickr

As I noted, none of these experts has addressed the impacts of wide-spread pest-caused tree mortality. If I may speculate, it seems likely that when the first wave of mortality sweeps through a forest, the result might be an expansion of both nesting opportunities (in dead or dying trees) and food availability for those that feed on wood borers. These would probably be more plentiful even in trees killed by pathogens or nematodes. Sapsuckers and those that depend on them might experience an immediate decline in sap sources. Over the longer term it seems likely that all cavity-dependent species will confront a much lower supply of large mature trees. I note that many deciduous/hardwood tree species are being affected by introduced pests.

Are there current studies in Michigan, where so many ash have died?

SOURCES

Bunnell, F.L. 2013. Sustaining Cavity-Using Species: Patterns of Cavity Use and Implications to Forest Management. Hindawi Publishing Corporation. ISRN Forestry. Volume 2013, Article ID 457698

Chepps, J., S. Lohr, and T.E. Martin. 1999. Does Tree Hardness Influence Nest-Tree Selection by Primary Cavity Nesters? The Auk 116(3):658-665, 1999

Daily, G.C., P.R. Ehrlich, and N.M. Haddad. 1993. Double keystone bird in a keystone species complex. Proc. Natl. Acad. Sci. USA Vol. 90, pp. 592-594, January 1993 Ecology

Goodburn, J.M. and C.G. Lorimer. 1998. Cavity trees and coarse woody debris in old-growth and managed northern hardwood forests in Wisconsin and Michigan. Can. For. Res. 28: 427.438 (1998)

Rissler, L.J., D.N. Karowe, F. Cuthbert, B. Scholtens. 1995. Wilson Bull., 107(4), 1995, pp. 746-752

Spring, L.W.  1965. Climbing and Pecking Adaptations in Some North American Woodpeckers.

Scott, V.E., K.E. Evans, D.R. Patton, C.P. Stone. 1977. Cavity-Nesting Birds of North American Forests. Agriculture Handbook 511 USDA Forest Service. https://www.gutenberg.org/files/49172/49172-h/49172-h.htm

United States Department of Agriculture, Animal and Plant Health Inspection Service. Draft Enviromental Impact Statement. 2022. State University of New York College of Enviromental Science and Forestry Petition (19-309-01p) for Determination of Nonregulated Status for Blight-Tolerant Darling 58 c’nut (Castanea dentata)

van den Driessche, R., M. Mather, T. Chatwin. 1999. Habitat use by bats in temperate old-growth forests, Clayoquot Sound, British Columbia 

Wiggins, D.A. (2005, January 27). Brown Creeper (Certhia americana): a technical conservation assessment. [Online]. USDA Forest Service, Rocky Mountain Region. Available: http://www.fs.fed.us/r2/projects/scp/assessments/browncreeper.pdf [date of access].

Posted by Faith Campbell

We welcome comments that supplement or correct factual information, suggest new approaches, or promote thoughtful consideration. We post comments that disagree with us — but not those we judge to be not civil or inflammatory.

For a detailed discussion of the policies and practices that have allowed these pests to enter and spread – and that do not promote effective restoration strategies – review the Fading Forests report at http://treeimprovement.utk.edu/FadingForests.htm

or

www.fadingforests.org

Australia Builds Capacity to Address Forest Pests

Australian Eucalypts; photo by John Turnbull via Flickr

I congratulate Australian scientists for bringing about substantial improvements of their country’s biosecurity program for forest pests. While it is too early to know how effective the changes will be in preventing new introductions, they are promising. What can we Americans learn from the Australian efforts? [I have previously praised South Africa’s efforts – there is much to learn there, too.]

Australia has a reputation of being very active in managing the invasive species threat. However, until recently biosecurity programs targetting forest pests were minimal and ad hoc. Scientists spent 30 years trying to close those gaps (Carnegie et al. 2022). Their efforts included publishing several reports or publications (listed at the end of the blog) and an international webinar on myrtle rust. Scientists are hopeful that the new early detection program (described below) will greatly enhance forest protection. However, thorough pest risk assessments are still not routinely conducted for forest pests. (Nahrung and Carnegie 2022).

The native flora of Australia is unique. That uniqueness has provided protection because fewer of the non-native insects and pathogens familiar to us in the Northern Hemisphere have found suitable hosts (Nahrung and Carnegie 2020). Also – I would argue – the uniqueness of this flora imposes a special responsibility to protect it from threats that do arise.

Only 17% of Australia’s landmass is covered by forests. Australia is large, however; consequently, these forests cover 134 million hectares (Nahrung and Carnegie 2020). This is the 7th largest forest estate in the world (Carnegie et al. 2022).

Australia’s forests are dominated by eucalypts (Eucalyptus, Corymbia and Angophora). These cover 101 million ha; or 75% of the forest). Acacia (11 million ha; 8%); and Melaleuca (6 million ha) are also significant. The forest also includes one million ha of plantations dominated by Pinus species native to North America (Carnegie et al. 2022). A wide range of native and exotic genera have been planted as amenity trees in urban and peri-urban areas, including pines, sycamores, poplars, oaks, and elms (Carnegie et al. 2022). These urban trees are highly valued for their ecosystem services as well as social, cultural, and property values (Nahrung and Carnegie 2020). Of course, these exotic trees can support establishment and spread of the forest pest species familiar to us in the Northern Hemisphere. On the positive side, they can also be used as sentinel plantings for early detection of non-native species (Carnegie et al. 2022 and Nahrung and Carnegie 2020).

Despite Australia’s geographic isolation, its unique native flora, and what is widely considered to be one of the world’s most robust biosecurity system, at least 260 non-native arthropods and pathogens of forests have established in Australia since 1885 (Nahrung and Carnegie 2020). [(This number is about half the number of non-native forest insects and pathogens that have established in the United States over a period just 25 years longer (Aukema et al. 2010).] As I noted, forest scientists have cited these introductions as a reason to strengthen Australia’s biosecurity system specifically as it applies to forest pests.

What steps have been taken to address this onslaught? For which pests? With what impacts? What gaps have been identified?

Which Pests?

Nahrung and Carnegie (2020) compiled the first comprehensive database of tree and forest pests established in Australia. The 260 species of non-native forest insect pests and pathogens comprise 143 arthropods, 117 pathogens. Nineteen of them (17 insects and 2 fungal species) had been detected before 1900. These species have accumulated at an overall rate of 1.9 species per year; the rate of accumulation after 1955 is slightly higher than during the earlier period, but it has not grown at the exponential rate of import volumes.

While over the entire period insects and pathogens were detected at an almost equal rate (insects at 1.1/year; pathogens at 0.9/year), this disguises an interesting disparity: half of the arthropods were detected before 1940; half of the pathogens after 1960 (Nahrung and Carnegie (2020). By 2022, Nahrung and Carnegie (2022) said that, on average, one new forest insect is introduced each year. Some of these recently detected organisms have probably been established for years. More robust surveillance has  just detected them recently. I have blogged often about an apparent explosion of pathogens being transported globally in recent decades.

In a more recent article (Nahrung and Carnegie, 2022), gave 135 as the number of non-native forest insect pests. The authors don’t explain why this differs from the 143 arthropods listed before.

damage to pine plantations caused by Sirex noctilio; photo courtesy of Helen Nahrung

Eighty-seven percent of the established alien arthropods are associated with non-native hosts (e.g., Pinus, Platanus, Populus, Quercus, Ulmus) (Carnegie et al. 2022). Some of these have escaped eradication attempts and caused financial impact to commercial plantations (e.g., sirex wood wasp, Sirex noctilio) and amenity forests (e.g., elm leaf beetle, Xanthogaleruca luteola) (Carnegie and Nahrung 2019).

About 40% of the alien arthropods were largely cosmopolitan at the time of their introduction in Australia (Carnegie et al. 2022). Only six insects and six fungal species are not recorded as invasive elsewhere (Nahrung and Carnegie 2020). Of the species not yet established, 91% of interceptions from 2003 to- 2016 were known to be invasive elsewhere. There is strong evidence of the bridgehead effect: 95% of interceptions of three species were from their invaded range (Nahrung and Carnegie 2022). These included most of the insects detected in shipments from North America, Europe and New Zealand. These ubiquitous “superinvaders” have been circulating in trade for decades and continue to be intercepted at Australia’s borders. This situation suggests that higher interception rates of these species reflect their invasion success rather than predict it (Nahrung and Carnegie 2021).  

I find it alarming that most species detected in shipments from Africa, South America, and New Zealand were of species not even recorded as established in those regions (Nahrung and Carnegie 2021; Nahrung and Carnegie 2022).

Arhopalus ferus, a Eurasian pine insect often detected in wood from New Zealand; photo by Jon Sullivan – in New Zealand; via Flickr

Half of the alien forest pests established in Australia are highly polyphagous. This includes 73% of Asian-origin pests but only 15% of those from Europe (Nahrung and Carnegie 2021). Nahrung and Carnegie (2022) confirm that polyphagous species are more likely to be detected during border inspections.

PATHWAYS

As in North America and Europe, introductions of Hemiptera are overwhelmingly (98%) associated with fresh plant material (e.g. nursery stock, fruit, foliage). Coleoptera introductions are predominantly (64%) associated with wood (e.g. packaging, timber, furniture, and artefacts). Both pathways are subject to strict regulations by Australia (Nahrung and Carnegie 2021).

Eradication of High-Priority Pests

Eight-five percent of all new detections were not considered high-priority risks. Of the four that were, two had not previously been recognized as threats (Carnegie and Nahrung 2019). One high-priority pest – expected to pose a severe threat to at least some of Australia’s endemic plant species – is myrtle rust, Austropuccinia psidii. Despite this designation, when the rust appeared in Australia in 2010, the response was confused and ended in an early decision that eradication was impossible.  Myrtle rust has now spread along the continent’s east coast, with localized distribution in Victoria, Tasmania, the Northern Territory, and – in 2022, Western Australia.   `

Melaleuca quinquenervia forest; photo by Doug Beckers via Wikimedia

There have been significant impacts to native plant communities. Several reviews of the emergency response criticized the haste with which the initial decision was made to end eradication (Carnegie and Nahrung 2019). (A review of these impacts is here; unfortunately, it is behind a paywall.)

A second newly introduced species has been recognized as a significant threat, but only after its introduction to offshore islands. This is Erythina gall wasp Quadrastichus erythrinae (Carnegie and Nahrung 2019). DMF Although Australia is home to at least one native species in the Erythrina genus, E. vespertilio,, the gall wasp is not included on the environmental pest watch list.

Four of the recently detected species were considered to be high impact. Therefore eradication was attempted. Unfortunately, these attempts failed in three cases. The single success involved a pinewood nematode, Bursaphelenchus hunanesis. See Nahrung and Carnegie (2021) for a discussion of the reasons. This means three species recognized as high-impact pests have established in Australia over 15 years (Nahrung and Carnegie (2021). In fact, Australia’s record of successful forest pest eradications is only half the global average (Carnegie and Nahrung (2019).

Carnegie and Nahrung (2019) conclude that improving early detection strategies is key to increasing the likelihood of eradication. They discuss the strengths and weaknesses of various strategies. Non-officials (citizen scientists) reported 59% of the 260 forest pests detected (Carnegie and Nahrung 2019). Few alien pests have been detected by official surveillance (Carnegie et al 2022). However, managing citizen scientists’ reports involves a significant workload. Futhermore, surveillance by industry, while appreciated, is likely to detect only established species (Carnegie and Nahrung 2019).

Interception Frequency Is Not an Indicator of Likelihood of Establishment

Nahrung & Carnegie (2021) document that taxonomic groups already established in Australia are rarely detected at the border. Furthermore, only two species were intercepted before they were discovered to be established in Australia.

Indeed, 76% of species established in Australia were either never or rarely intercepted at the border. While more Hemiptera species are established in Australia, significantly more species of Coleoptera are intercepted at the border. Among beetles, the most-intercepted family is Bostrichid borers (powderpost beetles). Over the period 2003 – 2016, Bostrichid beetles made up 82% of interceptions in wood packaging and 44% in wood products (Nahrung and Carnegie 2022). This beetle family is not considered a quarantine concern by either Australian or American phytosanitary officials. I believe USDA APHIS does not even bother recording detections of powderpost beetles. Nahrung and Carnegie (2021) think the high proportion of Bostrichids might be partially explained by intense inspection of baggage, mail, and personal effects. While Australia actively instructs travelers not to bring in fruits and vegetables because of the pest risk, there are fewer warnings about risks associated with wood products. 

Nahrung & Carnegie (2021) concluded that interception frequencies did not provide a good overall indicator of likelihood of risk of contemporaneous establishment.

Do Programs Focus on the Right Species?

Although Hemiptera comprise about a third of recent detections and establishments, and four of eight established species are causing medium-to-high impact, no Hemiptera are currently listed as high priority forestry pests by Australian phytosanitary agencies (Nahrung & Carnegie (2021). On the other hand, Lepidoptera make up about a third of the high-priority species, yet only two have established in Australia over 130 years. Similarly, Cerambycidae are the most frequently intercepted forest pests and several are listed as high risk. But only three forest-related species have established (Nahrung and Carnegie 2020). (Note discussion of Bostrichidae above.).

Unlike the transcontinental exchanges under way in the Northern Hemisphere, none of the established beetles is from Asia; all are native to Europe. This is especially striking since interceptions from Asia-Pacific areas account for more than half of all interceptions Nahrung and Carnegie (2021).

Interestingly, 32 Australian Lepidopteran and eight Cerambycid species are considered pests in New Zealand. However, no forest pests native to New Zealand have established in Australia despite high levels of trade, geographic proximity, and the high number of shared exotic tree forest species (Nahrung and Carnegie 2020).

STRUCTURE OF PROGRAM

The structure of Australia’s plant biosecurity system is described in detail in Carnegie et al. (2022). These authors call the program “comprehensive” but to me it looks highly fragmented. The federal Department of Agriculture and Water Resources (DAWR,[recently renamed the Department of Agriculture, Fisheries, and Forestry, or DAFF) is responsible for pre-border (e.g., off-shore compliance) and border (e.g., import inspection) activities. The seven state governments, along with DAFF, are responsible for surveillance within the country, management of pest incursions, and regulation of pests. Once an alien pest has become established, its management becomes the responsibility of the land manager. In Australia, then, biosecurity is considered to be a responsibility shared between governments, industry and individuals.

Even this fragmented approach was developed more recently than one might expect given Australia’s reputation for having a stringent biosecurity system. Perhaps this reflects the earlier worldwide neglect of the Plant Kingdom? Carnegie and Nahrung (2019) describe recent improvements. Until the year 2000, Australia’s response to the detection of exotic plant pests was primarily case-by-case. In that year Plant Health Australia (PHA) was incorporated. Its purpose was to facilitate preparedness and response arrangements between governments and industry for plant pests. In 2005, the Emergency Plant Pest Response Deed (EPPRD) was created. It is a legally-binding agreement between the federal, state, and territorial governments and plant industry bodies. As of 2022, 38 were engaged. It sets up a process to implement management and funding of agreed responses to the detection of exotic plant pests – including cost-sharing and owner reimbursement. A national response plan (PLANTPLAN) provides management guidelines and outlines procedures, roles and responsibilities for all parties. A national committee (Consultative Committee on Emergency Plant Pests (CCEPP) works with surveys to determine invaded areas (delimitation surveys) and other data to determine whether eradicating the pest is technically feasible and has higher economic benefits than costs..

Austropuccinia psidii on Melaleuca quinquenervia; photo by John Tann via Flickr

Even after creation of EPPRD in 2005, studies revealed significant gaps in Australia’s post-border forest biosecurity systems regarding forest pests (Carnegie et al. 2022; Carnegie and Nahrung 2019). These studies – and the disappointing response to the arrival of myrtle rust – led to development of the National Forest Biosecurity Surveillance Strategy (NFBSS) – published in 2018; accompanied by an Implementation Plan. A National Forest Biosecurity Coordinator was appointed.

The forest sector is funding a significant proportion of the proposed activities for the next five years; extension is probable. Drs. Carnegie and Nahrung are pleased that the national surveillance program has been established. It includes specific surveillance at high-risk sites and training of stakeholders who can be additional eyes on the ground. The Australian Forest Products Association has appointed a biosecurity manager (pers. comm.)

This mechanism is expected to ensure that current and future needs of the plant biosecurity system can be mutually agreed on, issues identified, and solutions found. Plant Health Australia’s independence and impartiality allow the company to put the interests of the plant biosecurity system first. It also supports a longer-term perspective (Carnegie et al. (2022). Leading natural resource management organizations are also engaged (Carnegie, pers. comm.).

Presumably the forest surveillance strategy (NFBSS) structure is intended to address the following problems (Carnegie and Nahrung 2019):

  • Alien forest pests are monitored offshore and at the border, but post-border surveillance is less structured and poorly resourced. Australia still lacks a surveillance strategy for environmental pests.
  • Several plant industries have developed their own biosecurity programs, co-funded by the government. These include the National Forest Biosecurity Surveillance Strategy (NFBSS).

Some pilot projects targetting high risk sites were initiated in the early 2000s. By 2019, only one surveillance program remained — trapping for Asian spongy (gypsy) moth.

  • The states of Victoria and New South Wales have set up sentinel site programs. Victoria’s uses local council tree databases. It is apparently focused on urban trees and is primarily pest-specific – e.g., Dutch elm disease. The New South Wales program monitors more than 1,500 sentinel trees and traps insects near ports. This program is funded by a single forest grower through 2022.  

Dr. Carnegie states: “With the start of the national forest biosecurity surveillance program in December 2022, the issues and gaps identified by Carnegie et al. 2022 are starting to be addressed. The program will conduct biosecurity surveillance specifically for forest pests and pathogens and be integrated with national and state biosecurity activities. While biosecurity in Australia is still agri-centric, a concerted and sustained effort from technical experts from the forest industry is changing this. And finally, the new Biosecurity Levy should ensure sustained funding for biosecurity surveillance.”

There is a separate National Environmental Biosecurity Response Agreement (NEBRA), adopted in 2012. It is intended to provide guidelines for responding, cost-sharing arrangements, etc. when the alien pest threatens predominantly the environment or public amenity assets (Carnegie et al. (2022). However, when the polyphagous shot hole borer was detected, the system didn’t work as might have been expected. While PSHB had previously been identified as an environmental priority pest, specifically to Acacia, the decision whether to engage was made under auspices of the the Emergency Plant Pest Response Deed (EPPRD) rather than the environmental agreement (NEBRA). As a result, stakeholders focused on environmental, amenity and indigenous concerns had no formal representation in decision-making processes; instead, industries that had assessed the species as a low priority (e.g., avocado and plantation forestry) did (Nahrung, pers.comm.).

Additional Issues Needing Attention

Some needs are not addressed by the National Forest Pest Strategic Plan (Carnegie et al. 2022) (Nahrung, pers. comm.):

1) The long-term strategic investment from the commercial forestry sector and government needed to maintain surveillance and diagnostic expertise;

2) Studies to assess social acceptance of response and eradication activities such as tree removal; 

3) Studies to improve pest risk prioritization and assessment methods; and

4) Resolving the biosecurity responsibilities for pests of timber that has been cut and used in construction.

In 2019, Carnegie and Nahrung (2019) called for developing more effective methods of detection, especially of Hemiptera and pathogens. They also promoted national standardization of data collection. Finally, they advocated inclusion of technical experts from state governments, research organizations and industry in developing and implementing responses to pest incursions. They note that surveillance and management programs must be prepared to expect and respond to the unexpected since 85% of the pests detected over the last 20 years—and 75% of subsequently mid-to high-impact species established—were not on high-priority pest list. See Nahrung and Carnegie 2022 for a thorough discussion of the usefulness and weaknesses of predictive pest listing.

SOURCES

Aukema, J.E., D.G. McCullough, B. Von Holle, A.M. Liebhold, K. Britton, & S.J. Frankel. 2010. Historical Accumulation of Nonindigenous Forest Pests in the Continental United States. Bioscience. December 2010 / Vol. 60 No. 11

Carnegie A.J. and H.F. Nahrung. 2019. Post-Border Forest Biosecurity in AU: Response to Recent Exotic Detections, Current Surveillance and Ongoing Needs. Forests 2019, 10, 336; doi:10.3390/f10040336 www.mdpi.com/journal/forests

Carnegie A.J., F. Tovar, S. Collins, S.A. Lawson, and H.F. Nahrung. 2022. A Coordinated, Risk-Based, National Forest Biosecurity Surveillance Program for AU Forests. Front. For. Glob. Change 4:756885. doi: 10.3389/ffgc.2021.756885

Nahrung H.F. and A.J. Carnegie. 2020. NIS Forest Insects and Pathogens in Australia: Establishmebt, Spread, and Impact. Frontiers in Forests and Global Change 3:37. doi: 10.3389/ffgc.2020.00037 March 2020 | Volume 3 | Article 37

Nahrung, H.F. and A.J. Carnegie. 2021. Border interceps of forest insects estab in AU: intercepted invaders travel early and often. NeoBiota 64: 69–86. https://doi.org/10.3897/neobiota.64.60424

Nahrung, H.F. & A.J. Carnegie. 2022. Predicting Forest Pest Threats in Australia: Are Risk Lists Worth the Paper they’re Written on? Global Biosecurity, 2022; 4(1).

Posted by Faith Campbell

We welcome comments that supplement or correct factual information, suggest new approaches, or promote thoughtful consideration. We post comments that disagree with us — but not those we judge to be not civil or inflammatory.

For a detailed discussion of the policies and practices that have allowed these pests to enter and spread – and that do not promote effective restoration strategies – review the Fading Forests report at http://treeimprovement.utk.edu/FadingForests.htm

or

www.fadingforests.org

We Need Analyses of Pest Approach Rates, but Detection Data Are Not Adequate Basis

plants for sale in UK; Evelyn Grimak via Geograph what pests could be here?

There has recently been a series of studies trying to use port detection data to determine which types of insects are most likely to arrive and possibly establish in the country. These studies – and related sources – are listed at the end of this blog. Some of the studies focus on the U.S. experience, but not all. Their – and my – conclusions are meant to be relevant around the globe.

I agree with Nahrung et al. (2022) as a correct definition of the problem:

“… despite decades of research on and implementation of [biosecurity] measures, insect invasions continue to occur with no evidence of saturation, and are even predicted to accelerate.” 

I also think the issue they raise applies more broadly. As these experts point out, forest pests have received considerable attention, are the subject of a specific international regulation (ISPM#15), and the pest risks to a range of forests is relatively well understood and appreciated. So what does failing to control this group of pests – as I say the international phytosanitary system is – imply for other pests and pathways?

I appreciate these experts’ efforts to improve the many elements of excluding pests: prediction, pest risk analysis, targeted phytosanitary measures, enforcement actions, and early detection. However, we have a long way to go before we can confidently apply port data to determine pest approach rates as well as the efficacy of phytosanitary measures.

Problems with the Quality of the Port Detection Data

inspection by APHIS

There is general agreement that detection data are not a reliable indicator of the true pest approach / arrival rate. Even Turner et al. (2022) – who titled their article “Worldwide border interceptions provide a window …” — concede this, although they try to find ways to apply the detection data anyway. According to pages 2 and 15 of Turner et al., true arrival rates of potentially invading species are usually difficult to estimate and probably exceed the number reported in the article. Allison et al. (2021) agree.

Turner et al. and Nahrung & Carnegie both note that many insect species established in the destination country are never or rarely detected. Turner et al. cite as an example spotted lanternfly, Lycorma delicatula, which appeared only once out of almost 1.9 million interceptions recorded in the combined global data. Nahrung & Carnegie note that 76% of species established in Australia were either never or rarely intercepted at the border.

Turner et al. explain that interception frequencies are a function of both the true arrival rates and the probability of (1) being detected during inspections (which depends on how these are carried out) and (2) being recorded. They say the data are more reliable when they report detections at the family-level. . The authors call on countries to base port inspections on a statistically based sampling program that would better reflect pest approach rates than do data biased by inspection priorities.

The issue of data quality might be broader. Certain kinds of pests travelling in certain types of imports might be sufficiently cryptic as to be rarely detected by even the best border inspections. Liebhold et al. (2012) found that APHIS inspectors detected actionable pests in only 2.6% of incoming shipments of plants, whereas a statistically valid audit determined that the actual approach rate was 12%. It is probable that many pests are never or rarely reported in official port detection data.

See a thorough discussion of the issues undermining use of interception data in Nahrung and Carnegie 2022, cited at the end of this blog.

Problems Due to Narrow Taxonomic Range of Pests Studied

Protection of our forests requires preventing introductions of many taxonomic groups, e.g., nematodes, fungal and other pathogens, viruses, and arthropods other than ambrosia beetles and Hemiptera.

I recognize that it is much more difficult to study and manage organisms other than common beetles. But the impacts of some introduced organisms in other categories have been devastating. I list some of the pathogens that have been introduced to the United States in recent decades, probably on imported plants: several Phytophthoras, ohia rust (Austropuccinia psidii), rapid ohia death (Ceratocystis lukuohia and C. huliohia), beech leaf disease, and the boxwood blight fungi. See Garbelotto and Gonthier (2022) for a thorough discussion of impacts of introduced forest pathogens.

boxwood hedge at Longwood Gardens; photo by F.T. Campbell

Points of Agreement

I agree with Nahrung et al. that:

  1. Biosecurity successes are probably under-recognized because they are difficult to see whereas failures are more evident. They call this the “Biosecurity Paradox”: the more successful biosecurity is, the fewer new species establish so the less important it appears.
  2. Uncertainty regarding the costs and benefits of forest border biosecurity measures appears to have led to under-regulation and wait-and-see approaches. Some recent reviews (Cuthbert et al.) show that delay substantially increases the costs associated with bioinvasion. 297https://www.nivemnic.us/?p=3209
  3. Helping “weakest links” improve their performance is crucial. (see Geoff Williams et al.  
  4. We need to revise international and national biosecurity practices. However, my proposals differ from those cited on page 221 of Nahrung et al.; see my “Fading Forests” reports [links at end of this blog] and earlier blogs here and here. A new complication is that pathologists complain that proposed systems proposed by various invasive species experts don’t reflect realities of managing plant pathogens (Paap et al. 2022).

I wish Nahrung et al. had suggested bolder interim steps that go beyond data management and research.

I appreciate that the Canadian report on forest biosecurity (Allison et al.) notes that claiming most introduced forest pests are reported to cause no measurable impact probably reflects our ignorance. I wish others who repeat this assertion, e.g., Nahrung et al. 2022, would explore this claim’s truth more carefully.

Points of Disagreement

Customs and Border Protection officers inspecting infested pallet

I also found other statements about the efficacy of existing efforts to be too uncritical. So yes, ISPM#15 has resulted in decreased arrivals of bark- and wood-boring insects, as stated by Nahrung et al. 2022. However, the 36-52% decrease documented by Haack et al. (2014) is not sufficient to protect forests, in my view. Many publications have documented continuing introductions of damaging pests via the wood packaging pathway. For example, there have been 16 outbreaks of the Asian longhorned beetle (ALB) detected around the globe between 2012 and 2015 (Wang). Before we conclude that ISPM#15 has been a success, let’s see what the just-completed new study by Haack and colleagues shows. In addition, there has been controversy for a decade or more about what causes continuing introductions, that is, whether they result from treatment inadequacy v. sloppy application of treatments v. fraud. Why have scientists and regulators not collaborated to clarify this issue during this time?

I note – again – that many pathogens have been introduced widely over the last couple of decades. This is a global problem. My recent blogs have discussed introductions of tens of species of Phytophthora to countries around the world. Other examples include myrtle rust (Austropuccinia psidii) to 27 countries and the two causal agents of boxwood blight to at least 24 countries in Eurasia, New Zealand, and North America. Most of these species were unknown to science at the time of their introduction. Other species were known – but not believed to pose a threat because, in their native regions, their co-evolved hosts are not harmed. 

Rhodomyrtus psidioidis in Australia killed by myrtle rust; photo by Peter Entwistle

I think Helen Nahrung (Nahrung et al.) exaggerates when she says that Australia has one of the strictest biosecurity systems in world. Several publications – some coauthored by her! – cite numerous shortfalls in applying the country’s phytosanitary programs to forest pests (Carnegie et al 2022). This latter group’s efforts have determined that at least 260 non-native arthropods and pathogens of forest hosts have established in Australia since 1885 (Nahrung and Carnegie 2020). True, this number is about half the number of non-native forest insects and pathogens that have established in the United States over a period just 25 years longer (Aukema et al. 2010). However, it is enough – and they have had sufficient impact – to prod these scientists to spend 30 years pushing for improvements.

Lessons Learned

Still, we can learn from these studies. Turner et al. compared insect interception data from nine regions over a 25-year period (1995 to 2019)at ports in New Zealand, Australia, South Korea, Japan, Canada, mainland United States, Hawai`i, United Kingdom, and the region united under European Plant Protection Organization (EPPO) – Europe and the Mediterranean region.

They found that 174 species (2% of the total) were “superinvaders.” They were intercepted more than 100 times, and constituted 81% of all interceptions across all regions. Most of the same types of insects – even the same species – are arriving at ports around the world. The three species most frequently intercepted are all sap-feeding insects commonly associated with widely traded plants. In a separate study, Australian scientists found the same: about 40% of the alien pests detected at Australian borders were already widely introduced at the time of their introduction in Australia (Carnegie et al. 2022). The Australians report strong evidence of the bridgehead effect [that is, species being spread from locations to which they have been introduced] (Nahrung and Carnegie 2021). In fact, they conclude that higher interception rates might confirm invasion success rather than predict it.

Most of the species, however, are intercepted rarely. Turner et al. found that 75% of species reported in their nine regions were intercepted in only a single region. In fact, 44% of all species were intercepted only once (= “singletons”). Such singletons made up about half of individual species in five insect orders; the exception was Thysanoptera – 29% of those species were intercepted only once.

The 75% of all species that were intercepted in only one region included both species rarely intercepted anywhere and species intercepted numerous times – but only in that one region. The authors note that several possible factors might explain these differences. Some species are less likely to be intercepted, so it is not odd that they are detected infrequently, especially if all the regions have the same blind spots. Countries also have their unique approaches to data collection and inspection prioritization that could introduce biases in the data. Finally, countries vary in the sources of goods they import. Unfortunately, some of the data sets Turner at al. analyzed said nothing about the source country, pathway, or commodity. Consequently, they were unable to evaluate the influence of these factors.

Improving Our Understanding of the Current Risk to the U.S.

Dendrobium officinale via Wikipedia; Fusarium stilboides has been detected on this orchid in China; F. stilboides is reported to attack pine trees

As I noted in a previous blog, U.S. imports of plants have increased by more than 400% since the 1960s; 35% in just the last 15 years (MacLachlan et al. 2022). In 2011, APHIS adopted an important new policy: temporary prohibition of plant taxa determined to be “Not Authorized for Importation Pending Pest Risk Assessment” (NAPPRA). Now we have a decade of experience with NAPPRA. Given that, and because the “plants for planting” pathway is among the most risky, APHIS should update the Liebhold et al. 2012 study to determine the current approach rate for all types of organisms that threaten North American tree species. Unlike the previous study, the update should include trees on Hawai`i, Guam, Puerto Rico and the other U.S possessions and territories. Finally, the study should try to evaluate the difference in risks associated with various types of plants and – possibly – also source regions.

Hawaiian native plant naio; photo by Forrest and Kim Starr

Unknown Unknowns

As I noted above, problems curtailing introduction of tree-killing pests are not limited to the U.S. For more than a decade, scientists have noted that the international phytosanitary system has failed to prevent the rapid worldwide spread of significant pathogens via the international nursery trade. Examples include Brasier 2008; Liebhold el. al. 2012; Santini et al. 2013; Roy et al. 2014; Eschen et al. 2015; Jung et al. 2015; Meurisse et al. 2019; O’Hanlon et al. 2021. One of the principal concerns is the fact that most species of microorganisms have not been named by science, much less evaluated for their potential impacts on naïve hosts. This issue was raised by Sarah Green of British Forest Research at the annual meeting of the Continental Dialogue on Non-Native Forest Insects and Pathogens. She asked the APHIS representative whether the agency’s phytosanitary procedures (described here) are working to prevent introductions. She pointed to the issues raised by numerous scientific experts: pest risk analyses address only known organisms, so they cannot protect importers from unknown organisms.

U.S. scientists are beginning to address the issue of “unknown unknowns”. Some studies have taken a stab at evaluating traits of insects that are more likely to damage conifers (Mech et al.) and hardwoods (Schultz et al.).  Jiri Hulcr – of the University of Florida — assessed the threat posed by 55 insect-vectored fungi to two species of oak and two species of pines. However, the forests of the southeastern U.S. comprise many other tree genera! He also set a very high bar for defining a threat as serious: the damage to the host must be equivalent to that caused by Dutch elm disease or laurel wilt. We urgently need APHIS, USDA/Forest Service, and academia to sponsor more similar studies to evaluate the full range of risks more thoroughly.

SOURCES

Allison J.D., M. Marcotte, M. Noseworthy and T. Ramsfield. 2021. Forest Biosecurity in Canada – An Integrated Multi-Agency Approach. Front. For. Glob. Change 4:700825. doi: 10.3389/ffgc. 2021.700825 Frontiers in Forests and Global Change July 2021 | Volume 4 | Article 700825

Carnegie A.J. and H.F. Nahrung. 2019. Post-Border Forest Biosecurity in AU: Response to Recent Exotic Detections, Current Surveillance and Ongoing Needs. Forests 2019, 10, 336; doi:10.3390/f10040336 www.mdpi.com/journal/forests

Carnegie A.J., F. Tovar, S. Collins, S.A. Lawson, and H.F. Nahrung. 2022. A Coordinated, Risk-Based, National Forest Biosecurity Surveillance Program for AU Forests. Front. For. Glob. Change 4:756885. doi: 10.3389/ffgc.2021.756885

Cuthbert, R.N., C. Diagne, E.J. Hudgins, A. Turbelin, D.A. Ahmed, C. Albert, T.W. Bodey, E. Briski, F. Essl, P. J. Haubrock, R.E. Gozlan, N. Kirichenko, M. Kourantidou, A.M. Kramer, F. Courchamp. 2022. Bioinvasion costs reveal insufficient proactive management worldwide. Science of The Total Environment Volume 819, 1 May 2022, 153404

Garbelotto M. and P. Gonthier. 2022.  Ecological, evolutionary, and societal impacts of invasions by emergent forest pathogens. Chapter 7, Forest Microbiology. Elsevier 2022.

Li, Y. C. Bateman, J. Skilton, B. Wang, A. Black, Y-T. Huang, A. Gonzalez, M.A. Jusino, Z.J. Nolen, S. Freemen, Z. Mendel, C-Y. Chen, H-F. Li, M. Kolarik, M. Knizek, J-H. Park, W. Sittichaya, P.H. Thai, S-I. Ito, M. Torii, L. Gao, A.J. Johnson, M. Lu, J. Sun, Z. Zhang, D.C. Adams, J. Hulcr. 2021. Pre-invasion assessment of exotic bark beetle-vectored fungi to detect tree-killing pathogens. Phytopathology. https://doi.org/10.1094/PHYTO-01-21-0041-R

Liebhold, A.M., E.G. Brockerhoff, L.J. Garrett, J.L. Parke, and K.O. Britton. 2012. Live Plant Imports: the Major Pathway for Forest Insect and Pathogen Invasions of the US. www.frontiersinecology.org

MacLachlan, M.J., A. M. Liebhold, T. Yamanaka, M. R. Springborn. 2022. Hidden patterns of insect establishment risk revealed from two centuries of alien species discoveries. Sci. Adv. 7, eabj1012 (2021).

Mech,  A.M., K.A. Thomas, T.D. Marsico, D.A. Herms, C.R. Allen, M.P. Ayres, K.J. K. Gandhi, J. Gurevitch, N.P. Havill, R.A. Hufbauer, A.M. Liebhold, K.F. Raffa, A.N. Schulz, D.R. Uden, & P.C. Tobin. 2019. Evolutionary history predicts high-impact invasions by herbivorous insects. Ecol Evol. 2019 Nov; 9(21): 12216–12230.

Nahrung, H.F. and A.J. Carnegie. 2020. NIS Forest Insects and Pathogens in Australia: Establishment, Spread, and Impact. Front. For. Glob. Change 3:37. doi: 10.3389/ffgc.2020.00037 Frontiers in Forests and Global Change | www.frontiersin.org 2 March 2020 | Volume 3 | Article 37

Nahrung, H.F. and A.J. Carnegie. 2021. Border interceptions of forest insects established in Australia: intercepted invaders travel early and often. NeoBiota 64: 69–86. https://doi.org/10.3897/neobiota.64.604

Nahrung, H.F. & A.J. Carnegie. 2022. Predicting Forest Pest Threats in Australia: Are Risk Lists Worth the Paper they’re Written on? Global Biosecurity, 2022; 4(1).

Nahrung, H.F., A.M. Liebhold, E.G. Brockerhoff, and D. Rassati. 2022. Forest Insect Biosecurity: Processes, Patterns, Predictions, Pitfalls. Annu. Rev. Entomol. 2023.68.

Paap, T., M.J. Wingfield, T.I. Burgess, J.R.U. Wilson, D.M. Richardson, A. Santini. 2022. Invasion Frameworks: a Forest Pathogen Perspective.  FOREST PATHOLOGY https://doi.org/10.1007/s40725-021-00157-4

Schulz, A.N.,  A.M. Mech, M.P. Ayres, K. J. K. Gandhi, N.P. Havill, D.A. Herms, A.M. Hoover, R.A. Hufbauer, A.M. Liebhold, T.D. Marsico, K.F. Raffa, P.C. Tobin, D.R. Uden, K.A. Thomas. 2021. Predicting non-native insect impact: focusing on the trees to see the forest. Biological Invasions.

Turner, R. M., E. G. Brockerhoff, C. Bertelsmeier, R. E. Blake, B. Caton, A. James, A. MacLeod, H. F. Nahrung, S. M. Pawson, M. J. Plank, D. S. Pureswaran, H. Seebens, T. Yamanaka, and A. M. Liebhold. 2021. Worldwide border interceptions provide a window into human-mediated global insect movement. Ecological Applications 31(7):e02412. 10.1002/eap.2412

Wang, Q. (Ed.). 2017. Cerambycidae of the world: biology and pest management.  Boca Raton, FL: CRC Press

Posted by Faith Campbell

We welcome comments that supplement or correct factual information, suggest new approaches, or promote thoughtful consideration. We post comments that disagree with us — but not those we judge to be not civil or inflammatory.

For a detailed discussion of the policies and practices that have allowed these pests to enter and spread – and that do not promote effective restoration strategies – review the Fading Forests report at http://treeimprovement.utk.edu/FadingForests.htm

or

www.fadingforests.org

EAB: Why Quarantines Are Essential

area devastated by EAB; photo by Nathan Siegert, USFS

The emerald ash borer (EAB; Agrilus planipennis) is the most damaging forest insect ever introduced. In late June 2022 it was detected in Forest Grove, Oregon — 26 miles from Portland. This is the first confirmation of EAB on the West Coast – a jump of over 1,000 miles from outbreaks in the Plains states. The infested ash trees were immediately cut down and chipped (see Oregon Department of Agriculture website; full link at end of blog). See my earlier blog on EAB’s threat to ash-dominated riparian wetlands in Oregon.

ash-dominated swamp along the Willamette River in Oregon; photo by William Wyatt, ODF

Oregon has been preparing for the EAB:

  • The state finalized its response plan in March 2021; see reference at end of blog.
  • The state sought and received funds from USDA APHIS to initiate a biocontrol program. The funds were not from APHIS’ operational budget, but from the agency’s Plant Pest and Disease Management and Disaster Prevention Program (PPDMDPP) (Farm Bill money).  
  • State and federal agencies have begun collecting seeds for resistance screening and a possible breeding program.

EAB: Why Quarantines Are Essential

As you might remember, in January 2021 APHIS dropped its federal regulations aimed at curtailing EAB’s spread via movement of wood and nursery plants. This shifted the responsibility for quarantines to state authorities. Instead, APHIS reallocated its funding to biological control. I raised objections at the time, saying the latter was no substitute for the former.

A new academic study shows that APHIS’ action was a costly mistake.

Hudgins et al. (2022; full citation at end of this blog) estimate EAB damage to street trees alone – not  counting other urban trees – in the United States will be roughly $900 million over the next 30 years. These costs cannot be avoided. Cities cannot allow trees killed by EAB to remain standing, threatening to cause injury or damage when they fall.

ash fallen onto house in Ann Arbor, Michigan; photo courtesy of former mayor John Hieftje

The authors evaluated various control options for minimizing the number of ash street trees exposed to EAB. They assessed the trees’ exposure in the next 40 years, based on management actions taken in the next 30 years.

In their evaluation of management options, Hudgins et al. tried to account for the fact that the effect of management at any specific site depends on the effects of previous management. Additional complexity comes from the facts that the EAB is spread over long distances largely by human actions (i.e., movement of infested wood); and that biocontrol organisms also disperse.

They conclude that efforts to control spread at the invasion’s leading edge alone – as APHIS’ program did – are less useful than accounting for urban centers’ role in long-distance pest dispersal via human movement. Cities with infested trees are hubs for pest transport along roads. Hudgins et al. say that quarantine programs need to incorporate this factor.

Hudgins et al. concluded that the best management strategy always relied on site-specific quarantines aimed at slowing the EAB spread rate. This optimized strategy, compared to conventional approaches, could potentially save $585 million and protect an additional 1 million street trees over the next 40 years. They also found that budgets should be allocated as follows: 74-89% of funds going to quarantine, the remaining 11% to 26% to biocontrol.

 In other words, a coherent harmonized quarantine program – either through reinstatement of the federal quarantine or coordination of state quarantines — could save American cities up to $1 billion and protect 1 million trees over several decades. Since street trees make up only a small fraction of all urban trees, up to 100 million urban ash trees could be protected, leading to even greater cost savings.

Unfortunately, such a coordinated approach seems unlikely. States continue to have very different attitudes about the risk. For example, Washington has no plans to adopt EAB regulations, despite it being detected in Oregon. To the north, Canada already has EAB quarantines and Hudgins et al. advise that they be maintained.

The authors recognize that quarantines’ efficacy is a matter of debate. Quarantines require high degrees of compliance from all economic agents in the quarantine area. Also they need significant enforcement effort. Some argue that meeting either requirement, let alone both, is unrealistic.  However, under Hudgins et al.’s model, use of quarantines was always part of the optimal management method across a variety of quarantine efficiency scenarios. Again, these models point to allocating about 75% of the total budget to quarantine implementation. In all scenarios, reliance solely on biocontrol led to huge losses of trees compared to a combined strategy.

Hudgins et al. asked their model for optimal application of both quarantines and biocontrol agents. For example, quarantine enforcement could focus on limiting entry of EAB at sites that: 1) have many ash street trees, 2) currently have low EAB propagule pressure, but 3) are vulnerable to receiving high propagule influx from many sites. Seattle is a prime example of such a vulnerable city with many transportation links to distant cities with significant ash populations.

On the other hand, quarantine enforcement could strive to limit outward spread (emigration) of EAB from which high numbers of pests could be transported to multiple other locales, each with many street trees and low propagule pressure. These sites would be along the leading edge of the invasion and where the probability of long-distance pest dispersal is high.

Authorities should be prepared to adjust quarantine actions in response to changing rates and patterns of invasion spread.

Biocontrol agents should be deployed to sites with sufficient EAB density to support the parasitoids, especially sites predicted to be hubs of spread.

Hudgins et al. concede that they did not explicitly account for:

1) The impact of uncertainty regarding EAB spread on the model;

2) Alternative objectives that might point to other approaches, e.g., minimizing extent of invaded range, or reducing the number of urban and forest trees exposed to EAB;

3) Impacts of predators, such as woodpeckers, on EAB populations;  

4) Synergistic impacts from climate change, which by exacerbating stress on ash trees will probably increase tree mortality from EAB infestations; and

5) Variation in management efficiency depending on communities’ capacities.

In the future, Hudgins et al. hope to test their model on other species to determine whether there is a predictable spatial pattern for all wood boring pests, that is, should quarantines always be focused on centers of high pest densities as probable sources of spread. Determining any patterns would greatly assist risk assessment and proactive planning.

dead ash near major road in northern Virginia; photo by F.T. Campbell

In an earlier study, Dr. Hudgins and other colleagues projected that by 2050, 1.4 million street trees in urban areas and communities of the United States will be killed by introduced insect pests – primarily EAB. This represents 2.1- 2.5% of all urban street trees. Nearly all of this mortality will occur in a quarter of the 30,000 communities evaluated. They predict that 6,747 communities not yet affected by the EAB will suffer the highest losses between now and 2060. However, they evaluated risks more broadly: the potential pest threat to 48 tree genera. Their model indicated that if a new woodboring insect pest is introduced, and that pest attacks maples or oaks, it could kill 6.1 million trees and cost American cities $4.9 billion over 30 years.  The risk would be highest if this pest were introduced via a port in the South. I have blogged often about the rising rate of shipments coming directly from Asia to the American South

SOURCES

Hudgins, E.J., J.O. Hanson, C.J.K. MacQuarrie, D. Yemshanov, C.M. Baker, I. Chadès, M. Holden, E.  McDonald-Madden, J.R. Bennett. 2022. Optimal emerald ash borer (Agrilus planipennis) control across the U.S.  preprint available here: https://doi.org/10.21203/rs.3.rs-1998687/v2

Hudgins, E.J., F.H. Koch, M.J. Ambrose, B. Leung. 2022. Hotspots of pest-induced US urban tree death, 2020–2050. Journal of Applied Ecology

Members of this team published an article earlier that evaluated the threat from introduced woodborers as a group to U.S. urban areas; see E.J. Hudgins, F.H. Koch, M.J. Ambrose, B. Leung. 2022. Hotspots of pest-induced US urban tree death, 2020–2050. Journal of Applied Ecology

Oregon Department of Agriculture: https://www.oregon.gov/oda/programs/IPPM/SurveyTreatment/Pages/EmeraldAshBorer.aspx

Posted by Faith Campbell

We welcome comments that supplement or correct factual information, suggest new approaches, or promote thoughtful consideration. We post comments that disagree with us — but not those we judge to be not civil or inflammatory.

For a detailed discussion of the policies and practices that have allowed these pests to enter and spread – and that do not promote effective restoration strategies – review the Fading Forests report at http://treeimprovement.utk.edu/FadingForests.htm

or

www.fadingforests.org

Restoring American chestnut: importance of Phytophthora root rot

TACF back-crossed chestnut growing in southern Fairfax County, Virginia

same chestnut, dying in 2021; probably from Phytopthora root rot

In the first half of the 20th Century, American chestnut (Castanea dentata) was functionally extirpated from US forests east of the Mississippi River by chestnut blight, caused by a fungus from Asia, Cryphonectria parasitica. Today, only 10% of the pre-blight chestnut population remains, most as root sprouts less than 2.5 cm dbh (Dalgleish et al. 2015; full citation at the end of the blog).

Volunteer organizations — with recent help from federal and state agencies – have worked for more than a century to develop chestnut trees resistant to the blight. Their aim is to restore the species to the forest.  Their decades of hybridization efforts now appear unlikely to produce a highly blight-resistant chestnut with a genome that is predominantly American, so TACF now plans to incorporate the use of transgenic techniques to enhance resistance to the blight fungus.

However, restoration of chestnut requires addressing a second Asian pathogen: Phytophthora cinnamomi, which causes a fatal root disease. Several studies indicate that up to 80% of seedlings are killed. The pathogen is widespread in soils south of 40o North Latitude, which falls just north of the Maryland-Pennsylvania line. Thus, P. cinnamomi occupies the southern half of American chestnut’s former range. Scientists expect this pathogen to move north in response to the warming climate; indeed, some project that the root disease could reach throughout the entire current chestnut range by 2080.

historic range of American chestnut

Gustafson et al. 2022 modelled chestnut’s vulnerability to P. cinnamomi to current and expected environmental conditions in two state forests in the Appalachians of western Maryland to evaluate the probable impact of the root disease on efforts to restore the tree species.

They found that root rot greatly reduced chestnut biomass on the landscape, even when resistance to root rot was at the target level for selection of root rot-resistant chestnut families using traditional breeding methods.

Gustafson et al. 2022 recommend that chestnut restoration apply the following strategies:

  • Locate restoration plantings at latitudes, elevations, and sites where root rot is not expected to be present well into the future. This probably means sites in the Northeastern US and Canada (Burgess et al. 2017)
  • Enhance the planting stock’s resistance to P. cinnamomi through breeding.
  • Identify soil conditions, including soil microbes, that suppress the pathogen or protect tree roots.
  • Since planting stock – both bareroot and containerized – can transmit P. cinnamomi, either raise seedlings in nurseries located outside the pathogen’s current range or rely on direct seeding. These strategies have their own downsides. Restricting locations of nurseries might complicate efforts to ensure seedlings are adapted to local conditions in the restoration area and seeds would need to be protected from seed predators.

The authors specify these additional important conditions:

  • Planting locations: while Canada is currently outside the range of American chestnut, the same climatic warming that will facilitate northward spread of P. cinnamomi will probably allow the tree to thrive farther north (Barnes and Delborne 2019). Perhaps the tree’s range will shift farther north than the pathogen’s.
  • Breeding: some resistance to Phytophthora root rot has been found in families providing blight resistance used in The American Chestnut Foundation (TACF) breeding program. TACF now plans to cross individuals from those families with transgenic blight-resistant chestnut to combine both resistances.
  • Soils: P. cinnamomi is favored by compacted soils with poor aeration or that tend to remain saturated. These include heavy clay soils and those highly disturbed by agriculture or mining. Restoration sites should be non-disturbed, well-drained sites. (This recommendation contradicts others’ proposals that chestnuts be planted on reclaimed mining sites.) Silvicultural management should also minimize environmental stresses.
that dying chestnut trying to reproduce!

Restoring chestnut will be challenging in any case: successful restoration requires chestnut trees that can compete successfully in the forest and adapt to conditions which are now quite different from those a century ago when the species was dominant. These include abiotic factors, e.g., climate and atmospheric CO2 levels; and biotic factors, e.g., different forest pests and invasive plant species.

In an earlier publication, Gustafson and colleagues (Gustafson et al. 2018) modelled the effects of warmer temperature and elevated atmospheric CO2 levels on chestnut’s growth and competition and the tree’s adaptation to natural and anthropogenic disturbances. They concluded that aggressive restoration programs – involving clearcutting, then planting chestnuts – could restore chestnut as an important component of forested ecosystems in the Appalachian Mountains.  

However, this earlier study did not consider the effects of Phytophthora root rot. The 2022 study demonstrates that these recommendations are probably applicable only to the northernmost portion of former chestnut range, outside the areas infested by Phytophthora root rot, unless breeding is successful in substantially increasing resistance to root rot.

Several studies indicate American chestnut is highly susceptible to P. cinnamomi; rates of root rot induce mortality of 80% or higher have been documented. TACF has found that hybrid chestnut families selected for root rot resistance have a mortality rate of about 45%. Even with this level of tolerance, the model shows that chestnut could not regain anything approaching its former abundance on the landscape. Since the threat of P. cinnamomi to chestnut restoration has become evident, TACF is assessing how to integrate increased tolerance to root rot into their larger blight resistance breeding program (Westbrook et al. 2019).

Soil properties – texture, land use, drainage, waterlogging, drought, temperature, and water-holding capacity – influence infection. So does weather: a single heavy rain event might saturate soil sufficiently to facilitate a P. cinnamomi infection. For these reasons, climate change is expected to exacerbate its geographic spread and pathogenicity.

The sites used in both studies are at the center of chestnut’s former range, which is also at the northern edge of the root rot pathogen’s range. However, the two sites differ in important ways, especially in rainfall and soils. The researchers considered one a mesic site and the other, xeric.

Their 2022 model showed that root rot caused a dramatic reduction in chestnut biomass on both the mesic and xeric sites. Apparently temperature and wetness levels offset each other. That is, higher soil temperatures intensified P. cinnamomi virulence at the xeric site sufficiently to overcome its relative soil dryness. At the mesic site, soil temperature sometimes dropped to levels that are lethal to Phytophthora. On the whole, then, climate change is expected to intensify P. cinnamomi infection rates on both sites and reduce the number of sites where the pathogen is absent.

Gustafson et al. (2022) discuss several assumptions and data gaps that require further study.

SOURCES

Barnes, J.C. and Delborne, J.A., 2019. Rethinking restoration targets for American chestnut using species distribution modeling. Biodiversity and Conservation, 28(12), pp.3199-3220.

Burgess, T.I., Scott, J.K., Mcdougall, K.L., Stukely, M.J., Crane, C., Dunstan, W.A., Brigg, F., Andjic, V., White, D., Rudman, T. and Arentz, F., 2017. Current and projected global distribution of Phytophthora cinnamomi, one of the world’s worst plant pathogens. Global Change Biology23(4), pp.1661-1674.

Dalgleish, H.J., Nelson, C.D., Scrivani, J.A. and Jacobs, D.F., 2015. Consequences of shifts in abundance and distribution of American chestnut for restoration of a foundation forest tree. Forests7(1), p.4.

Gustafson, E.J., B.R. Miranda, T.J. Dreaden, C.C. Pinchot, D.F. Jacobs. 2022. Beyond blight: Phytophthora root rot under climate change limits populations of reintro Am chestnut Ecosphere. 2022;13:e3917.

Gustafson, E.J., A.M.G. De Bruijn, N. Lichti, D.F. Jacobs, B.R. Sturtevant, D.M. Kashian, B.R. Miranda, and P.A. Townsend. 2018. “Forecasting Effects of Tree Species Reintroduction Strategies on Carbon Stocks in a Future without Historical Analog.” Global Change Biology 24: 5500–17. https://doi.org/10.1111/gcb.14397

Westbrook, Jared W., et al. “Resistance to Phytophthora cinnamomi in American chestnut (Castanea dentata) backcross populations that descended from two Chinese chestnut (Castanea mollissima) sources of resistance.” Plant disease 103.7 (2019): 1631-1641.

Posted by Faith Campbell

[An earlier version of this blog has now been corrected, with additional sources added. I think Cornelia Pinchot, USFS, for the corrections.]

We welcome comments that supplement or correct factual information, suggest new approaches, or promote thoughtful consideration. We post comments that disagree with us — but not those we judge to be not civil or inflammatory.

For a detailed discussion of the policies and practices that have allowed these pests to enter and spread – and that do not promote effective restoration strategies – review the Fading Forests report at http://treeimprovement.utk.edu/FadingForests.htm

or

www.fadingforests.org

Plants for Planting – Major Pathway, Too Little Attention

Phytopthora cinnamomi on manzanita in California; photo courtesy of Ted Swiecki/Phytosphere

While I blog often about wood packaging the fact is that imports of live plant [= “plants for planting” in USDA’s terms] have historically posed a higher risk of introducing tree-killing pests. In 2012, Liebhold et al. found that nearly 70% of 455 damaging pests introduced to the continental U.S. as of 2006 had probably been introduced via plant imports. These included 95% of sap feeding and 89% of foliage feeding insects and about half of the pathogens. Imported plants not only carry a greater variety of pests than wood packaging; they also carry many more.

Introductions on imported plants for planting is not a rare event. An analysis of data in the Agriculture Quarantine Inspection Monitoring (AQIM) during 2009 found that the approach rate of pests on imported plants was apparently 12% (Liebhold et al. 2012) — more than 100 times higher than the 0.1% approach rate found by Haack et al. (2014) for wood packaging. This alarming statistic receives less attention than warranted because APHIS objected to the accuracy of other aspects of the study.

APHIS has adopted changes to its phytosanitary system for plants for planting in the decade since 2009. The question is, have these changes reduced the known risks associate with live plant imports – especially given skyrocketing imports? Are more measures necessary? Current data and analyses cannot provide a scientifically valid answer.

ohia rust on endangered Hawaiian native plant Eugenia koolauensis

First, most studies focus on insects – they even exclude pathogens. Among pathogens introduced in recent decades, probably by the plant trade, are several Phytophthoras, rapid ‘ōhi‘a death, beech leaf disease, boxwood blight. (I am assuming that the Fusarium dieback disease vectored by Euwallacea beetles was introduced via wood packaging.) There have been repeated detections of the Ralstonia solanacearum Race 3 biovar 2, a bacterium that attacks a range of herbaceous plants, despite APHIS requiring specific integrated pest management programs in producing nurseries located in Central America. Examples of recently introduced leaf feeders include the European beech leaf-mining weevil and elm zigzag sawfly.

I concede that it is difficult to study introduced pathogens. It is nearly impossible to compile a complete list of introduced fungi and related organisms since only the most damaging are typically detected and their native ranges are frequently undeterminable. However, European forest pathologists are much more active on these questions. Why? What can we do to focus Americans on the threats these organism pose?

Second, most studies analyzing the pest risk associated with plant imports use port inspection data. However, port inspection data are not reliable indicators of the pest approach rate – as explained by  Liebhold et al. 2012 and Haack et al. 2014 (as it pertains to wood packaging). Thus, most of the analyses carried out by Liebhold et al. and MachLachlan et al. (2022) are based on the pests found by APHIS inspectors: actionable pests were detected on only 2.6% of the incoming plants that they inspected.

Here I discuss two recent discussions of the risk associated with imported plant for planting. One is an analysis of establishments of one order of insects in the United States over 200 years (MacLachlan et al. 2022; full citation at the end of the blog). Again, the focus is on insects! The other is a discussion of the pathway during the recent annual meeting of the Continental Dialogue on Non-Native Forest Insects and Diseases. link to posting of presentations This discussion raised some of the key questions, although no answers were provided.

U.S. imports of plants have increased by more than 400% since the 1960s; 35% in just the last 15 years (in 2007 the U.S. imported approximately 3.7 billion plants [Liebhold et al. 2012]; in 2021 it was about 5 billion [MacLachlan et al. 2022]. Yet establishments of new non-native insects associated with this pathway have not risen commensurately. MacLachlan et al. (2022) attempt to answer why this is so. However, pests are often not detected for several years or a decade after their introduction. Furthermore, I doubt that an analysis based on inspection data, not the more reliable AQIM data, can provide an accurate assessment.

To clarify the pest risk associated with plant imports, studies of some insect types, excluding pathogens, is not sufficient. Again, APHIS should update the Liebhold et al. study to determine the approach rate for all types of organisms that threaten North American tree species. Any such study should include trees on Hawai`i, Guam, Puerto Rico, and other U.S possessions and territories. These islands are usually excluded from analyses of imported pests, including Liebhold et al. 2012. I concede that there are probably scientific and data-management challenges but these islands are immensely important from a biodiversity point of view, and they are parts of the United States!

Cycas micronesica endemic to Guam; threatened by cycad scale & cycad blue butterfly; photo courtesy A. Gawel

MacLachlan et al. (2022) focused their analysis on the insect order Hemiptera, including the so-called true bugs, including cicadas, aphids, planthoppers, and leafhoppers. This is the insect order most frequently transported with imported plants. In addition, establishments of Hemiptera can be attributed to plant imports rather than to wood or other vectors. Of the 3,500 species of non-native insects established in North America (including the contiguous U.S. states, Alaska, and Canada), about 27% are Hemiptera. Many are serious pests, e.g., hemlock woolly adelgid and balsam woolly adelgid). Complicating the analysis, however, is the fact that some Hemiptera are inconspicuous so they are difficult to detect. In fact, MacLaughlan et al. 2022 estimate the median delay between introduction and detection to be 80 years! They believe that many introduced species remain undiscovered, ranging from 21% for Eurasian regions to 38% for the Neotropics and 52% for Australasia.

eastern hemlocks killed by hemlock woolly adelgied; Linville Gorge, NC; photo by Steven Norman, USFS

MacLachlan et al. (2022) compare the relationship between plant imports and discoveries of Hemiptera from 1800 to the present in an attempt to answer the puzzle of why new Hemiptera establishments have remained relatively steady despite quadrupled plant imports. Perhaps the pool of novel insect species in the source region has been depleted. Or other factors might have changed, such as

  • the commodities imported (plant species or types; or geographic source)
  • phytosanitary measures applied by the U.S.

MacLachlan et al. (2022) tracked plant imports since 1854 from seven ecological regions: Afrotropic, Asian Palearctic, Australasia, European Palearctic, Indomalaya, Nearctic, Neotropic. In the early decades, both imported plants and introduced Hemiptera detected in the U.S., came predominantly from European and Asian Palearctic regions. Now, however, almost no new Hemiptera species are being introduced on plants imported from the European and Asian Palearctic regions. Since the 1950s, estimated establishments from the Indomalaya region have remained relatively stable. Establishments from the Neotropic and Afrotropic regions rose following World War II and have remained relatively high. After also declining in the first half of the 20th century, establishments of new species from Australasia have recently increased.

Generally, the regions associated with declining establishments of new species (Eurasia) are experiencing relatively gradual increases in their exports to the U.S. Those regions which contribute relatively steady or increasing establishments (Neotropics, Indomalaya, Australasia, and Afrotropic) have each undergone rapid increases in exports to the U.S.

Establishment Risk Among Regions

Source regions vary in the type of plants they export (e.g., rootless cuttings v. whole plants) and in the volume of exports. They also differ in the composition of their indigenous and introduced insect populations. Imports from areas with an abundance of species capable of establishing and adapted to environmental conditions in North America pose greater establishment risk, although it is challenging to determine the risk associated with individual species.

Establishment risk of shipments from a particular region also changes over time. The number of potential new species of invaders might shrink as more and more arrive in North America. (This situation has no effect on the continued introduction of insect species already established in North America. These reintroductions might arrive in new areas – so expanding the area at risk; or their increasing number contributes to propagule pressure at establishment sites.) Another factor might be phytosanitary policies. Strengthening of phytosanitary measures might suppress the number of organisms that travel with the plant shipment, enter North America, and establish. The opposite might happen if phytosanitary measures are relaxed or if the sourcing or type of imports diversifies in ways that connect additional species in source regions with trade pathways.

Considering all regional plant sources, MacLachlan et al. (2022) estimate that establishments per unit of additional imports – of Hemipterans – have shrunk because of a combination of increased imports, accumulated introductions associated with past imports, and the passage of time. These decreases are substantial – between 75.2% and 99.8% for the various regions from 1962 to 2012. For the Asian Palearctic and Neotropic regions, MacLachlan et al. (2022) determined that depletion of species pools is a contributing factor. Other factors are thought to explain the substantial decline in establishment likelihood for the other regions.  However, note the caveats above re: lag times in detecting introductions.

However, despite that significant decrease in risk per unit of imports, the number of establishments has remained relatively constant over the past century. MacLachlan et al. (2022) attribute this pattern to the decreases in marginal risk from additional imports being offset by substantial increases in overall import levels and diversification of the origins of imports across regions, which exposed the U.S. to new source species pools.

MacLachlan et al. (2022) suggest that APHIS should target biosecurity resources to the specific commodity-country pairs associated with a demonstrated higher relative risk of introducing additional insect species.

MacLachlan et al. (2022) are unable to evaluate the efficacy of APHIS’ most important policy change: creation of the “Not Authorized for Importation Pending Pest Risk Assessment” (NAPPRA) program because it was adopted in 2011 and they analyzed data only through 2012. A decade later this policy restricts imports of about 250 taxa (Regelbrugge to Continental Dialogue). It is certainly time to evaluate its efficacy through a new study of pest approach rates in the “plants for planting” trade.

I do not think that U.S. phytosanitary policy should be based on an analysis of just one of at least three types of pests that travel via the pathway. We need analysis of the risk from pathogens, nematodes, viruses … and other orders of arthropods.

The Continental Dialogue on Non-Native Forest Insets and Pathogens

The Continental Dialogue on Non-Native Forest Insects and Pathogens hosted a discussion of the risk of pest introduction via the plant trade during its recent annual meeting. Participants asked: How can the international phytosanitary system curtail introductions of unknown organisms when it is based on risk assessments that address only species that are fully known and – usually – have proven to be invasive elsewhere.

Rhodomyrtos psidioides in eastern Australia killed by myrtle rust; photo by Peter Entwistle

In recent decades, tens of species of Phytophthora have been introduced to countries around the world. Myrtle rust (Austropuccinia psidii) has been introduced to 27 countries from the U.S. to Australia and South Africa. The two causal agents of boxwood blight has been introduced to at least 24 countries in three geographic areas: Europe and western Asia; New Zealand; and North America. The ash decline fungus has been introduced across Europe. Most of these species were unknown to science at the time of their introduction. Other species were known – but not believed to pose a threat because, in their native regions, their co-evolved hosts are not harmed. 

For more than a decade, scientists have noted that the international phytosanitary system has failed to prevent this rapid worldwide spread of significant pathogens via the international nursery trade. Examples include Brasier 2008; Liebhold el. al. 2012; Santini et al. 2013; Roy et al. 2014; Eschen et al. 2015; Jung et al. 2015; Meurisse et al. 2019; O’Hanlon et al. 2021.

During the Continental Dialogue discussion, Craig Regebrugge, Vice President of AmericanHort (the principal nursery trade association) noted the economic importance of greenhouse and nursery production and the importance of offering novel plants to their customers. Also, he noted that U.S. retail nurseries import primarily unrooted plant cuttings. In so doing, they have a strong incentive to ensure that they are pest-free in order to avoid delays arising during inspections. Those delays would probably kill these highly perishable products. Most U.S. imports of “finished” plants come from Canada. There have been pest problems; one of the most recent examples is a moth that attacks boxwoods (Buxus), which is the top-selling shrub crop in the U.S. Earlier there was confusion over whether plants shipped from British Columbia had been infected by the sudden oak death pathogen.

Regelbrugge noted that the industry’s voluntary integrated pest management program – Systems Approach to Nursery Certification (SANC) – currently has about two dozen participating nurseries. Hoped-for adoption by more of the hundreds of production nurseries in the country has been delayed by COVID-related travel restrictions, but he hopes to restore momentum. The industry is looking for opportunities to strengthen the program through marketing messages.

Regelbrugge and a second speaker, Rebecca Epanchin-Niell of the University of Maryland, warned that prohibitions on imports will stimulate smuggling. Both raised concerns about direct-to-consumer sales by e-commerce vendors and sought ideas on how to change the behavior of both exporters and consumers.

Later Sarah Green of British Forest Research asked the APHIS representative whether the agency’s import procedures are working to prevent introductions. She pointed to the issues raised by the scientific sources I cited above: pest risk analyses address only known organisms, so this process cannot protect importers from unknown organisms. She noted that the United Kingdom is struggling to contain a number of introductions of previously unknown pathogens. Gary Lovett of the Cary Institute noted that this weakness of pest risk assessments also hampers U.S. attempts to prevent introductions – especially of pathogens. He called on the Dialogue to focus on the resource at risk – native and urban forests – and change our phytosanitary programs on this basis. He has advocated halting imports of plants that are congenerics of important North American tree species, in order to minimize the risk that pests that damage those genera will be introduced.

an American elm that has survived DED – at Longwood Gardens; photo by F.T. Campbell

Jiri Hulcr of the University of Florida tried to reassure Dialogue participants by stating that recent research has substantially reduced the threat from “unknown unkowns”. I applaud Dr. Hulcr’s efforts to reduce scientific uncertainty about the invasive potential of pathogens native to regions other than North America. His study might be the largest attempted by U.S.-based scientists. However, I note that his study assessed the threat posed by 55 insect-vectored fungi to two species of oak and two species of pines. The forests of the southeastern U.S. comprise many other tree genera! He also set a very high bar for defining a threat as serious: the damage to the host must be equivalent to that caused by Dutch elm disease or laurel wilt. Both have devastated their respective hosts. I believe U.S. phytosanitary policy must aim at protecting the full range of native species. Furthermore, levels of damage that affect the host’s role in the ecosystem – not just rapid mortality — should not be acceptable.

SOURCES

Epanchin-Niell, R., M. Springborn, an A. Lindsay.  2016. Resources No. 193 Fall 2016.  http://www.rff.org/files/document/file/RFF_Resources_193_Web.pdf

Li, Y. C. Bateman, J. Skelton, B. Want, A. Black, Y-T. Huang, A. Gonzalez, M.A. Jusino, Z.J. Nolen, S. Freemen, Z. Mendel, C-Y. Chen, H-F. Li, M. Kolarik, M. Knizek, J-H. Park, W. Sittichaya, P.H. Thai, S-I. Ito, M. Torii, L. Gao, A.J. Johnson, M. Lu, J. Sun, Z. Zhang, D.C. Adams, J. Hulcr. 2021. Pre-invasion assessment of exotic bark beetle-vectored fungi to detect tree-killing pathogen. Phytopathology. https://doi.org/10.1094/PHYTO-01-21-0041-R

Liebhold, A.M., E.G. Brockerhoff, L.J. Garrett, J.L. Parke, and K.O. Britton. 2012. Live Plant Imports: the Major Pathway for Forest Insect and Pathogen Invasions of the US. www.frontiersinecology.org

MacLachlan, M.J., A. M. Liebhold, T. Yamanaka, M. R. Springborn. 2022. Hidden patterns of insect establishment risk revealed from two centuries of alien species discoveries. Sci. Adv. 7, eabj1012 (2021).

Posted by Faith Campbell

We welcome comments that supplement or correct factual information, suggest new approaches, or promote thoughtful consideration. We post comments that disagree with us — but not those we judge to be not civil or inflammatory.

For a detailed discussion of the policies and practices that have allowed these pests to enter and spread – and that do not promote effective restoration strategies – review the Fading Forests report at http://treeimprovement.utk.edu/FadingForests.htm

or

www.fadingforests.org

West Coast Steps Up Efforts to Protect Ash

Oregon-ash dominated swamp in the Ankeny National Wildlife Refuge, Willamette Valley, Oregon; photo by Wyatt Williams, Oregon Department of Forestry

In April 2022 I blogged about efforts on the West Coast to prepare for arrival of the emerald ash borer (EAB).

That blog focused on Oregon ash (Fraxinus latifolia), which is an important component of riparian forests. I alerted you to the availability of ODA/ODF EAB 2018 Response Plan.

I also mentioned Oregon’s active participation in “don’t move firewood” campaigns.

California has long inspected incoming firewood. In 2021 it establishment of a state quarantine in response to APHIS ending the federal quarantine. Washington State operates a statewide trapping program for invasive insects but does not regulate firewood.

Contributions from the Tualatin Soil and Water Conservation District enabled the USDA Forest Service Dorena Genetic Resource Center to begin testing Oregon ash for resistance to EAB and related genetics work. Other funding came from the USFS Forest Health Protection program.

EAB has now been detected in Oregon — in the Willamette Valley! (See photo above, by Wyatt Williams) Concerned stakeholders have established a new newsletter to keep people informed and promote cooperative efforts.

The newsletter is “Ash across the West”.

The first issue of the newsletter provides the following information:

  • there are eight ash species in the West; all are vulnerable to the emerald ash borer (EAB)

Single-leaf ash (Fraxinus anomala)     CA, NV, AZ, UT, NM, CO, WY

Fragrant ash (Fraxinus cuspidata)       NV, AZ, NM, UT

Calif ash (Fraxinus dipetala)               CA, NV, AZ, UT

Fresnillo (Fraxinus gooddingii)               AZ

Gregg’s ash (Fraxinus greggii)                        AZ

OR ash (Fraxinus latifolia)                  WA, OR, CA

Chihuahuan ash (Fraxinus papillosa)    AZ, NM, TX

Velvet ash (Fraxinus velutina)                         CA, NV, AZ, UT, NM, TX

  • EAB Risk Map for OR: based upon known occurrences of ash & corresponding human activities associated with known pathways of EAB introduction and establishment.
  • 2022 status of the two field trials
    • the Dorena Genetic Resource Center (DGRC): planted 600 seedlings from 27 families; 85% survival in 2022; controlling competing vegetation
    • Washington State University Puyallup Research Center: planted seedlings from 26 of these families; 95% survival rate. Possible complication from a foliar disease.  
  • Seedlings from 17 Oregon ash families (including 14 of those in the DGRC field trial) sent to Dr. Jennifer Koch (USFS) in Ohio) for EAB resistance/susceptibility testing.
  • Seed collections began in 2019; interrupted by COVID-19 in 2020 but resumed in 2021 and continue in 2022. Several consortia are involved in Oregon and Washington. In California and the other states, The Huntington Botanical Gardens will lead the collecting effort. Funding is from USFS Forest Health Protection. Seeds are stored for gene conservation; some are used for the field trials in Oregon and Washington and the initial EAB-resistance studies going on in Ohio.
  • Penn State Ash Genomic Project: Dr. Jill Hamilton is trying to create a ‘genomic passport’ for Oregon ash populations for use in establishing genotype-environment associations to inform seed transfer guidelines. If you would like to help Dr. Hamilton collect leaves for sampling, contact: Dr. Jill Hamilton at jvh6349@psu.edu

To help with seed collection, ash monitoring, documenting the importance of ash to various communities, and other activities; or to get on the mailing list for the newsletter, contact Richard Sniezko at Richard.sniezko@usda.gov

A video explaining the campaign to save Oregon ash is at https://youtu.be/uZmfLrxEA7g

Posted by Faith Campbell

We welcome comments that supplement or correct factual information, suggest new approaches, or promote thoughtful consideration. We post comments that disagree with us — but not those we judge to be not civil or inflammatory.

For a detailed discussion of the policies and practices that have allowed these pests to enter and spread – and that do not promote effective restoration strategies – review the Fading Forests report at http://treeimprovement.utk.edu/FadingForests.htm

or

www.fadingforests.org

Invasive shot hole borers: global threat; will international phytosanitary system prevent further spread?

ISHB-infested California sycamore; photo by Beatriz Nobua-Behrmann, University of California Cooperative Extension

Numerous ambrosia beetles have become introduced species. Their invasions are facilitated by their cryptic habits and ecologies, wide host ranges, and specialized breeding systems – all of which allow extremely low populations to start an infestation. The way they breed often results in low genetic diversity in their introduced ranges, but this has not hampered their success. [Bierman et al. 2022]

Also, ambrosia beetles carry fungi, which provide food needed by their larvae. While most of these fungi don’t harm living trees, some do. The United States has been invaded by three damaging ambrosia beetle-fungal complexes: laurel wilt in the Southeast, and Fusarium dieback disease, carried to southern California with polyphagous and Kuroshio shot hole borers.

These shot hole borers and their fungi represent an especially high risk to our forests because they can be transported in both living and dead wood. So not only massive U.S. imports of live plants but also the global movement of goods enclosed in solid wood packaging offer ready pathways for them to arrive and spread here. Neither pathway is regulated effectively enough to prevent either pest imports or interstate spread.

Invasive ambrosia beetles in California and Hawai’i

The invasive ambrosia beetles introduced to California are in the genus Euwallacea. This genus has undergone several taxonomic revisions. Now, the Euwallacea are divided into four species (Stouthammer 2017), of which three are in the U.S.:

  • Euwallacea fornicatus s.s. – common name polyphagous shot hole borer; first came to attention in southern California in 2012; formerly known as E. whitfordiodendrus.
  • E. perbrevis – common name tea shot hole borer; formerly known as E. fornicatus s.l.
  •  E. kuroshio – unchanged nomenclature since detected in California in 2013;
  • E. fornicatior — apparently has not invaded outside of its native range in Asia.

Those now in the U.S. have been introduced to naïve habitats here and elsewhere, often with dire consequences. E. perbrevis, and possibly other species in the complex, are established on the Hawaiian islands.

For an extensive discussion of their introduction history go here  

The Fungi: U.S. and Worldwide

Several fungal associates are vectored by the polyphagous shot hole borer (PSHB) and Kuroshio shot hole borer (KSHB). The most important are Fusarium euwallacea and Fusarium kuroshium, respectively. These fungi were only described after they appeared in California in the 2010s. They cause Fusarium dieback disease.

Because the two beetle species are difficult to distinguish and the associated diseases cause very similar impacts, Californians studying them and educating stakeholders now speak of the two beetle-fungus complexes as one unit, “invasive shot hole borers”.  

Both PSHB and KSHB have numerous genetic strains, or haplotypes. For PSHB, the greatest haplotype diversity is in Asia – Thailand, Vietnam and China. Remember that these same regions are also a center of diversity for the huge genus Phytophthora, blog a genus widely recognized as containing many plant pathogens. https://www.dontmovefirewood.org/pest_pathogen/sudden-oak-death-syndrome-html/ One of the PSHB haplotypes, H33, has invaded many more regions than the others, including Israel, California, and South Africa. It has also been detected in several tropical plant greenhouses in Europe (where it has been eradicated). H33apparently is native to Vietnam – near Hanoi and Ho Chi Minh City – the country’s major ports (Rugman-Jones et al 2020 and pers. comm.). Does this haplotype’s spread to three continents reflect circumstances, such as the proximity of its native range to major ports and a “bridgehead effect” from its multiple introductions (the insects can be introduced to new regions on shipments from invaded regions established earlier)? Or does it point to an unknown genetic superiority (Bierman et al. 2022). This issue seems worth exploring.

I have blogged about the rising volume of imports from Vietnam, including to ports on the Gulf Coast –a region that has climatic similarities to Vietnam and known host species, so it seems quite vulnerable to invasion by either PSHB or KSHB.

A second species in the genus, KSHB, was detected in southern California in 2012; it has now spread to Mexico. So far, only one haplotype of this species has been detected in North America; this haplotype is widespread in Taiwan.

Finally, E. perbrevis (formerly known as E. fornicatus s.l.) has been detected in Florida, Hawai`i (island of Maui), and West Australia (to which it is probably native). This species has also been detected in nurseries in the Netherlands, where authorities report that it has been eradicated (Rugman-Jones et al. 2020).

Akacia koa – native tree in Hawai“i attacked by Euwallaceae; photo by David Eckhoff, via Flickr

Some species or haplotypes have been detected in only one introduced location: E. fornicatus H35 and E. kuroshio (H20) in California; H38 in South Africa; H43 on Oahu and the Big Island of Hawai`i; and an unnamed haplotype in West Australia (Rugman-Jones et al. 2020).

This is a brief guide to worldwide invasions by one or more Euwallacea-fungus complexes (Rugman-Jones et al. 2020):

  • Southern California — two haplotypes of E. fornicatus s.s. (H33 & H35) and E. kuroshio (one  haplotype).
  • Hawai`i – a unique haplotype of E. fornicatus s.s. (H43) on Oahu, the Big Island, and possibly other islands; E. perbrevis on Maui and possibly other islands.
  • Israel — E. fornicatus s.s. haplotype H33 only.
  • South Africa — E. fornicatus s.s. haplotype H33 and a unique haplotype (H38).
  • Western Australia — a unique haplotype of E. fornicatus s.s. and E. perbrevis (which is probably native in northern Queensland).
  • Greenhouses in Europe – both E. fornicatus s.s. (haplotype not specified) and – in the Netherlands — E. perbrevis; both reported eradicated.

When a location has been invaded by two or more species or haplotypes, this is probably an indication of separate introductions. Multiple introductions thus are suspected in California (Stouthamer et al. 2017; Bierman et al. 2022); South Africa (Bierman et al. 2022); and Hawai`i (Bierman et al. 2022).

As is true of other pathogens, e.g., Phytophthoras, there appears to have been a spurt of introductions in recent decades, to, e.g., California, South Africa, and the second species in Hawai`i. Bierman et al 2022 note the constantly growing number of locations with introductions.

Indigofera jucuna – reproductive host of PSHB in South Africa; photo by Giardano de Barcelona

Impact and Spread

As is common in the case of forest pests, especially pathogens, detection occurred only years after the initial introduction. In South Africa this delay was five years – from 2012 to 2017 or 2018. In California, identification of the species as PSHB in 2012 was nine years after the organism was first detected in the state (2003).

Over the decade since 2012, PHSB, KSHB, and the pathogens they transmit have spread through large portions of southern California. KSHB has spread through “jumps” to distant locations in Orange, Los Angeles, and as far as Santa Barbara and Ventura counties. There have also been detections in even more distant San Luis Obispo and Santa Clara. These latter apparently have not become established.

A likely explanation for this pattern is the movement of firewood. (Rugman-Jones et al 2020 and pers. comm.) See the map here The two beetles and the plant pathogens they carry are expected to spread throughout much of California wherever their many host plants occur.

On Hawai`i, PSHB is attacking several endemic species including one of the largest forest trees, Acacia koa, as well as Pipturus albidus and Planchonella sandwicensis. Numerous non-native species growing on the Islandsare also attacked, including crops (Macadamia and Mangifera) and invasive species

In South Africa, PSHB has spread faster and farther. It has been present since at least 2012 (Stouthamer et al. 2017), although it was not identified until 2018. In about a decade it has spread to every province except Limpopo – PSHB’s largest geographical outbreak of this beetle [Bierman et al. 2022]

Hosts and Areas at Greatest Risk

Hundreds of plant species in at least 33 plant families support successful reproduction of both beetle and fungus. These include many species widespread in southern California, other parts of the U.S., and South Africa. Some California ecosystems are at particular risk because they are dominated by susceptible tree or shrub species. These vulnerable ecosystems are mixed evergreen forests, oak woodlands, foothill woodlands, and riparian habitats. In San Diego County alone, more than 58,000 acres of riparian woodlands are at risk (California Forest Pest Council).

Experience with the Kuroshio shot hole borer (KSHB) in the Tijuana River valley along the California-Mexico border demonstrates the importance of ecological factors in determining disease outcomes. Following introduction, the KSHB killed a high proportion of the willows near the main river channel. However, beginning in 2016, these trees have regrown to almost pre-infestation sizes. Lead researcher John Boland is not certain why these new, fast-growing trees have not been attacked by the KSHB which remains in the area. See links to the Boland studies below.

riparian forest in Tijuana River Valley after recovery from KSHB attack; photo by John Bolton

Urban forests are at particular risk. For example, in South Africa, conservative estimates were that 25% of urban trees would be lost (Bierman et al. 2022). In California, a model developed by Shannon Lynch found the cities at greatest jeopardy are San Diego, Los Angeles, the San Francisco Bay area, and Sacramento. In other areas in the state that lack data on city tree composition, Lynch applied climate models; this approach extended the list of threatened areas to the eastern half of southern California and other parts of the Central Valley. (Lynch presentation to ISHB webinar April 2022; 2nd day.) In my view, this model should also be applied to cities in Arizona and Nevada with similar climates.

Management

Symptoms of PSHB attack and fungus infection differ among tree species. For illustrations of the symptoms on various species, visit here.

Most important, prevent the beetles’ spread through movement of dead or cut wood, e.g., green waste, firewood, and even large wood chips or mulch. Websites provide information on managing these sources.

Where the beetles have already established, California scientists recommend focusing management on heavily infested “amplifier trees”. On these trees, dead limbs should be pruned; dying trees and those with beetles infesting the main trunk should be removed. The wood must be disposed of properly.

Sources

Bierman, A., F. Roets, J.S. Terblanche. 2022.  Population structure of the invasive ambrosia beetle, Euwallacea fornicatus, indicates multiple introductions into South Africa. Biol Invasions (2022) 24:2301–2312 https://doi.org/10.1007/s10530-022-02801-x

Boland, J.M. — all of Boland’s reports and articles on the KSHB are available at: The Ecology and Management of the Kuroshio Shot Hole Borer in the Tijuana River Valley — Tijuana Estuary : TRNERR]

California Forest Pest Council. 2015. 2015 California Forest Pest Conditions. http://bofdata.fire.ca.gov/hot_topics_resources/2015_california_forest_pest_conditions_report.pdf

Eskalen, A., Stouthamer, R., Lynch, S. C., Twizeyimana, M., Gonzalez, A., and Thibault, T. 2013. Host range of Fusarium dieback and its ambrosia beetle (Coleoptera: Scolytinae) vector in southern California. Plant Dis. 97:938-951.

Stouthamer, R., P. Rugman-Jones, P.Q. Thu, et al. 2017. Tracing the origin of a cryptic invader: phylogeography of the Euwallacea fornicatus (Coleoptera: Curculionidae: Scolytinae) species complex. Agric For Entomol 19:366-375. https://doi.org/10.1111/afe.12215

recordings of April 2022 webinar posted at https://youtu.be/RyqJYyLkshk  day 1; and https://youtu.be/kWmtcbjTczw day 2

Posted by Faith Campbell

We welcome comments that supplement or correct factual information, suggest new approaches, or promote thoughtful consideration. We post comments that disagree with us — but not those we judge to be not civil or inflammatory.

For a detailed discussion of the policies and practices that have allowed these pests to enter and spread – and that do not promote effective restoration strategies – review the Fading Forests report at http://treeimprovement.utk.edu/FadingForests.htm

or

www.fadingforests.org