A Forest without Big Trees — Which Animals Will be Decimated?

In an earlier blog about tree extinctions, I commented that less drastic impacts by pests can also be important. I mentioned specifically that clumps of beech root sprouts cannot duplicate the quantities of nuts and cavities provided by mature beech trees.

This thought prompted me to search for information about use of tree cavities by wildlife. The articles I have found are decades old and largely focus on implications for management of forests for timber. Timber production conflicts with a goal of ensuring the presence of large (“overmature”), trees, especially those with dead branches, and completely dead trees (“snags”). These articles were written too long ago to address the possible impacts of non-native insects and pathogens – although there is some discussion of widespread mortality of pines caused by the mountain pine beetle.

These sources make clear that species that make cavities are keystone species. Many other wildlife species depend on them — birds, bats and terrestrial animals – mammals and herps. Furthermore, these cavity-associated species require forests with significant numbers of large, old, declining trees. When non-native insects or pathogens kill those trees, there might be a short-term bonanza of dying trees – suitable for nesting and foraging; and wood-feeding insects to provide food. But afterwards – for decades or longer – there will probably be small-diameter trees, and different species. Can the cavity-dependent species find habitat or food under these circumstances?

[By coincidence, the PBS program “Nature” broadcast an episode on woodpeckers on the 2nd of November! The title is “The Hole Story”. ]

Cavities provide a variety of habitats for many species – including some not usually thought of as “forest” species. Among the 85 North American bird species identified by Scott et al. as associated with cavities are seven species of ducks, two vultures, three falcons, 12 owls, two swifts, six flycatchers, two swallows, purple martin, seven chickadees, three titmice, four nuthatches, brown creeper, five wrens, three bluebirds, and two warblers. They point out that the majority of these birds are insectivores. Woodpeckers are especially important predators of tree-killing bark beetles.

Goodburn and Lorimer found that more than 40 species of birds and mammals in hardwood forests of Wisconsin and Michigan use cavities in snags and dead portions of live trees for nest sites, dens, escape cover, and winter shelter. Bunnell reported that 67 vertebrate species commonly use cavities in the Pacific Northwest. Chepps et al., Daily et al., and Wiggins focus on specific species in the Rocky Mountains. (Full citations for all sources are at the end of the blog.)

While Scott et al. (published in 1977) do not address the impact of non-native pests, their profiles of individual bird species sometimes name specific types of trees favored. Several of these tree taxa have been decimated by such non-native pests, or face such attack in the near future. Thus, concern appears warranted for:

pileated woodpecker; photo by Jo Zimni via Flickr
  • birds nesting in American elm, including two that are quite large so they require large trees to accommodate their nests: common goldeneye (a duck) and pileated woodpecker (larger than a crow).
  • the pileated woodpecker also nests in ash and beech and here
  • the yellow-bellied sapsucker nests in butternut.

How many species depended on American chestnut, which – before the blight — grew to diameters up to 5 feet, heights of 70 to 100 feet, and had hollow centers (USDA 2022)?

In the West, some nesting tree species are under imminent threat from invasive shot hole borers, goldspotted oak borer, or sudden oak death. Detection of the emerald ash borer in Oregon portends a longer-term threat. Birds likely to feel these impacts include the acorn woodpecker, ash-throated flycatcher, and purple martin. The golden-fronted woodpecker is associated with oaks in parts of Texas where oak wilt is severely affecting live oaks.

ash-throated flycatcher; photo by Mick Thompson via Flickr

At the beginning of the 21st Century – before widespread mortality caused by the emerald ash borer — densities of snags in the managed forests in the Lake States were apparently already insufficient to sustain population densities of cavity nesting birds. Pileated woodpeckers and chimney swifts both prefer snags greater than 50 cm dbh, which are significantly less abundant in harvested stands. For six of eight bird species studied, the number of breeding pairs was significantly higher in old-growth northern hardwood stands than in those under management (Goodburn and Lorimer).

Strong Primary Excavators are Keystone Species

Cavity nesters are commonly divided into:

1) primary excavators that excavate their own cavities. These are further divided into strong excavators – those species that forage by drilling, boring, or hammering into wood or soil; and weak excavators – those species that probe or glean bark, branches, and leaves to acquire prey.

2) secondary cavity users, that use holes made by primary cavity excavators (Bunnell).

Strong primary excavators tend to be large, e.g., most woodpeckers, sapsuckers, and the northern flicker. Weak excavators are mostly smaller species, such as chickadees and nuthatches; plus those woodpeckers that forage primarily by probing and gleaning, extracting seeds, or capturing insects in flight [e.g., acorn woodpecker (Melanerpes formicivorus), downy woodpecker (Picoides pubescens)] (Bunnell).

Bunnell considers strong excavators to be keystone species because so many other cavity users depend on them. Their loss would seriously disrupt forest ecosystems. For example, in the Pacific Northwest, only nine of 22 avian primary excavators are strong excavators. Another 45 species are secondary cavity users. These include waterfowl, tree swallows, and some mammals such as flying squirrels. Some cavity nesters support an even wider group of species: in the Pacific Northwest, at least 23 bird species, six mammal species, and numerous arthropods (nine orders and 22 families) feed on sap and insects collected at holes drilled by sapsuckers (Bunnell). [I discuss sapsuckers’ ecosystem role in greater detail later.]

Tree Characteristics

There is general agreement that animals dependent on tree cavities “prefer” (actually, require) trees that are large – tall, of large circumference, and sturdy – while having decayed interiors.

Size:

As Bunnell notes, larger snags provide more room and tend to stand longer without breaking, so they provide greater opportunities for cavity use. They also tend to be taller, so they offer higher nest sites that provide better protection from ground-dwelling predators. While larger-diameter trees remain standing longer regardless of the cause of mortality, snags created by fire usually fall sooner than do other snags. Beetle-killed trees are more attractive to cavity nesters that tend to excavate nest sites in trees on which they have foraged.

In the upper Midwest, cavity trees were a scare resource, even in unmanaged forests. Mean diameters for live cavity trees were twice as large as the mean diameter of the live trees in stands under a management regime. Such larger-diameter snags were more numerous in old-growth than in managed stands, especially in mixed hemlock-hardwood stands (Goodburn and Lorimer).

The Importance of Decay

Excavating a cavity demands considerable energy, so birds seek sites where a fungal infection has softened the interior wood. The exterior wood must remain strong to prevent collapse of the nest. These rots take time to develop, so they appear more often in older, even dying, trees. Bunnell, Scott et al., Chepps et al., and Goodburn and Lorimer all emphasize the role of decay in providing suitable cavity sites. Chepps et al. compared the aspen trees used by four species of cavity-nesting birds in central Arizona. Not only were nest trees softer than neighboring trees; they were softer at the spot where the nests were excavated than at other heights. [Spring (1965) provides a fun discussion of different species’ adaptations to the energy demands of hard pecking and climbing vertical trunks.]

Live v. Dead Trees

However, the need for decay does not necessarily mean birds prefer dead trees. Goodburn and Lorimer found that in Wisconsin and Michigan, a large percentage of all cavities found were in live trees.  

Bunnell found that strong excavators select trees with less visible signs of decay. Where possible, secondary users will also use live trees. However, intense competition often forces them to use dead trees.

Hardwoods v. Conifers

Bunnell states that deciduous trees more often contain internal rot surrounded by a sound outer shell than do conifers (at least this is true in the Pacific Northwest). He found that cavity nesters chose hardwoods for 80–95% of their nest sites even where hardwoods comprised only 5–15% of the available tree stems. He concluded that availability of living hardwoods had a significant influence on strong excavators in the West, although probably was less important in hardwood stands in the East.

Taxa Dependent on Other Types of Cavity

Some species depend on cavities created by forces other than bird excavations, such as decay or fire. These include most of the mammals, especially the larger ones e.g., American martens, fishers, porcupines, and black bears. These natural cavities are often uncommon. Vaux’s swifts nest and roost in hollow snags large enough that they can fly in a spiral formation to enter and leave (Bunnell).

little brown bat Myotis sp. photo by S.M. Bishop via Wikimedia Commons

Bats are a special case. Bats are unique among mammals of their size in having long lives, low reproductive rates, and relatively long periods of infant dependency. They also play a key ecological role as the major predators of nocturnal flying insects (van den Driesche 1999). Also many species are in perilous conservation status: half of the 16 bat species in British Columbia were listed as threatened or endangered as of 1998 (van den Driesche). This was before the deadly disease whitenose syndrome had been detected in North America.

Bats require larger trees. In the Pacific Northwest at least, that choice often means conifers (Bunnell). Roosts are difficult to find, so samples are small. A study on the west coast of Vancouver Island (van den Driessche), located only nine roosts despite searching during three summers. Five roosts were in large-diameter (old) western red cedar, with dead tops and extensive cracks.

Brown creepers and some amphibians and reptiles nest or seek cover under slabs of loose bark, which are typically found on dead or dying trees. The same large, mature and old-growth conifer trees also provide preferred foraging habitat, since there is a higher density of arthropod prey on their deeply furrowed bark. While Wiggins (2005) studied bird populations in the Rocky Mountains, he cited studies in the eastern United States, specifically in the Blue Ridge and Allegheny mountains, that have found similar results. Goodburn and Lorimer found that in National forests in Wisconsin and Michigan, only 15% of trees consisted of the necessary snags with loose bark plates. Suitable trees were most frequent old-growth hemlock-hardwood stands, and on larger-diameter snags. A high proportion of the snags with loose bark were yellow birch (Betula alleghaniensis).

Importance of foraging sites

As Bunnell points out, a bird must feed itself before it can nest. Foraging trees and snags are usually smaller than nesting trees. Furthermore, birds need many more foraging sites than nesting sites. The situation perhaps most pertinent to our usual focus on invasive pests concerns bird species’ response to mountain pine beetle outbreaks. Red-breasted nuthatches and mountain chickadees increasing dramatically in apparent response to the beetle epidemic. When most of the conifers had been killed, and numbers of beetles diminished, numbers of these bird species also declined–despite the increased availability of conifer snags for nesting. Indeed, the birds continued to nest primarily in aspen during the epidemic.

Bunnell reiterates that snags of all sizes are needed; they provide perching, foraging, and hawking sites for bird species beyond cavity nesters as well as sustenance for bryophytes, insects, and terrestrial breeding salamanders. He says more than 200 studies reported harvesting of standing dead trees in beetle-killed forests had negative effects on bird, mammal, and fish species.  

Other Dependencies – Food Sources

yellow-bellied flycather; photo by Dennis Church via Flickr

A few studies looked at the role of cavity-creating birds in providing food sources. The focus was on sapsuckers. They drill sapwells into trees’ phloem; sap flowing into these wells attracts many other species. In Michigan, Rissler determined that yellow-bellied sapsuckers’ sapwells attracted insects in seven orders and 20 families, especially Coleoptera, Diptera (other than Tephritidae), bald-faced hornets, and Lepidoptera. Daily et al. (1993) cites other studies showing that ruby throat and rufous hummingbirds have extended their breeding ranges by relying on these sapwells for nutrition in early spring before flowers open. [The “Nature” program covers this behavior.]

In a subalpine ecosystem in Colorado, Daily et al. found that red-naped sapsuckers support other species in two ways. First, they excavate nest cavities in fungus-infected aspens that are utilized by at least seven secondary cavity nesting bird species. When they feed, they drill sapwells that nourish more than 40 species – including hummingbirds, warblers, and chipmunks. Daily et al. called this a keystone species complex comprised of sapsuckers, willows, aspens, and a heartwood fungus. Disappearance of any element of the complex could cause an unanticipated unraveling of the community.

Goodburn and Lorimer looked at the availability of downed wood but did not discuss the implications of the presence of only small-diameter coarse woody debris.

Efforts to Accommodate Biodiversity Needs

Scott et al. reported in 1977 that the USDA Forest Service had required staff at regional and National Forest levels to develop snag retention policies. Twenty years later, Goodburn and Lorimer noted that Forest Service management guidelines for some Wisconsin and Michigan National forests since the early 1980s have called for the retention of all active cavity trees and  5-10 snags (larger than 30 cm dbh)/ha. However, as I noted above, they fear that these recommended snag retention levels might still be too limited to support cavity nesters. They found that two species that prefer snags greater than 50 cm dbh, pileated woodpeckers and chimney swifts, were significantly more abundant in old-growth than in selection stands. Furthermore, the number of breeding pairs of six species was at least 30% higher in old-growth northern hardwood than in selection stands and more than 85% higher in selection cuts than even-aged.

Goodburn and Lorimer cited others’ findings that removal of some live timber and snags in an Arizona ponderosa pine forest reduced cavity-nesting bird populations by 50%. Species affected were primarily violet-green swallows, pygmy nuthatches, and northern three-toed woodpeckers.

Female mountain bluebird by Jacob W. Frank. Original public domain image from Flickr

As I noted, none of these experts has addressed the impacts of wide-spread pest-caused tree mortality. If I may speculate, it seems likely that when the first wave of mortality sweeps through a forest, the result might be an expansion of both nesting opportunities (in dead or dying trees) and food availability for those that feed on wood borers. These would probably be more plentiful even in trees killed by pathogens or nematodes. Sapsuckers and those that depend on them might experience an immediate decline in sap sources. Over the longer term it seems likely that all cavity-dependent species will confront a much lower supply of large mature trees. I note that many deciduous/hardwood tree species are being affected by introduced pests.

Are there current studies in Michigan, where so many ash have died?

SOURCES

Bunnell, F.L. 2013. Sustaining Cavity-Using Species: Patterns of Cavity Use and Implications to Forest Management. Hindawi Publishing Corporation. ISRN Forestry. Volume 2013, Article ID 457698

Chepps, J., S. Lohr, and T.E. Martin. 1999. Does Tree Hardness Influence Nest-Tree Selection by Primary Cavity Nesters? The Auk 116(3):658-665, 1999

Daily, G.C., P.R. Ehrlich, and N.M. Haddad. 1993. Double keystone bird in a keystone species complex. Proc. Natl. Acad. Sci. USA Vol. 90, pp. 592-594, January 1993 Ecology

Goodburn, J.M. and C.G. Lorimer. 1998. Cavity trees and coarse woody debris in old-growth and managed northern hardwood forests in Wisconsin and Michigan. Can. For. Res. 28: 427.438 (1998)

Rissler, L.J., D.N. Karowe, F. Cuthbert, B. Scholtens. 1995. Wilson Bull., 107(4), 1995, pp. 746-752

Spring, L.W.  1965. Climbing and Pecking Adaptations in Some North American Woodpeckers.

Scott, V.E., K.E. Evans, D.R. Patton, C.P. Stone. 1977. Cavity-Nesting Birds of North American Forests. Agriculture Handbook 511 USDA Forest Service. https://www.gutenberg.org/files/49172/49172-h/49172-h.htm

United States Department of Agriculture, Animal and Plant Health Inspection Service. Draft Enviromental Impact Statement. 2022. State University of New York College of Enviromental Science and Forestry Petition (19-309-01p) for Determination of Nonregulated Status for Blight-Tolerant Darling 58 c’nut (Castanea dentata)

van den Driessche, R., M. Mather, T. Chatwin. 1999. Habitat use by bats in temperate old-growth forests, Clayoquot Sound, British Columbia 

Wiggins, D.A. (2005, January 27). Brown Creeper (Certhia americana): a technical conservation assessment. [Online]. USDA Forest Service, Rocky Mountain Region. Available: http://www.fs.fed.us/r2/projects/scp/assessments/browncreeper.pdf [date of access].

Posted by Faith Campbell

We welcome comments that supplement or correct factual information, suggest new approaches, or promote thoughtful consideration. We post comments that disagree with us — but not those we judge to be not civil or inflammatory.

For a detailed discussion of the policies and practices that have allowed these pests to enter and spread – and that do not promote effective restoration strategies – review the Fading Forests report at http://treeimprovement.utk.edu/FadingForests.htm

or

www.fadingforests.org

Australia Builds Capacity to Address Forest Pests

Australian Eucalypts; photo by John Turnbull via Flickr

I congratulate Australian scientists for bringing about substantial improvements of their country’s biosecurity program for forest pests. While it is too early to know how effective the changes will be in preventing new introductions, they are promising. What can we Americans learn from the Australian efforts? [I have previously praised South Africa’s efforts – there is much to learn there, too.]

Australia has a reputation of being very active in managing the invasive species threat. However, until recently biosecurity programs targetting forest pests were minimal and ad hoc. Scientists spent 30 years trying to close those gaps (Carnegie et al. 2022). Their efforts included publishing several reports or publications (listed at the end of the blog) and an international webinar on myrtle rust. Scientists are hopeful that the new early detection program (described below) will greatly enhance forest protection. However, thorough pest risk assessments are still not routinely conducted for forest pests. (Nahrung and Carnegie 2022).

The native flora of Australia is unique. That uniqueness has provided protection because fewer of the non-native insects and pathogens familiar to us in the Northern Hemisphere have found suitable hosts (Nahrung and Carnegie 2020). Also – I would argue – the uniqueness of this flora imposes a special responsibility to protect it from threats that do arise.

Only 17% of Australia’s landmass is covered by forests. Australia is large, however; consequently, these forests cover 134 million hectares (Nahrung and Carnegie 2020). This is the 7th largest forest estate in the world (Carnegie et al. 2022).

Australia’s forests are dominated by eucalypts (Eucalyptus, Corymbia and Angophora). These cover 101 million ha; or 75% of the forest). Acacia (11 million ha; 8%); and Melaleuca (6 million ha) are also significant. The forest also includes one million ha of plantations dominated by Pinus species native to North America (Carnegie et al. 2022). A wide range of native and exotic genera have been planted as amenity trees in urban and peri-urban areas, including pines, sycamores, poplars, oaks, and elms (Carnegie et al. 2022). These urban trees are highly valued for their ecosystem services as well as social, cultural, and property values (Nahrung and Carnegie 2020). Of course, these exotic trees can support establishment and spread of the forest pest species familiar to us in the Northern Hemisphere. On the positive side, they can also be used as sentinel plantings for early detection of non-native species (Carnegie et al. 2022 and Nahrung and Carnegie 2020).

Despite Australia’s geographic isolation, its unique native flora, and what is widely considered to be one of the world’s most robust biosecurity system, at least 260 non-native arthropods and pathogens of forests have established in Australia since 1885 (Nahrung and Carnegie 2020). [(This number is about half the number of non-native forest insects and pathogens that have established in the United States over a period just 25 years longer (Aukema et al. 2010).] As I noted, forest scientists have cited these introductions as a reason to strengthen Australia’s biosecurity system specifically as it applies to forest pests.

What steps have been taken to address this onslaught? For which pests? With what impacts? What gaps have been identified?

Which Pests?

Nahrung and Carnegie (2020) compiled the first comprehensive database of tree and forest pests established in Australia. The 260 species of non-native forest insect pests and pathogens comprise 143 arthropods, 117 pathogens. Nineteen of them (17 insects and 2 fungal species) had been detected before 1900. These species have accumulated at an overall rate of 1.9 species per year; the rate of accumulation after 1955 is slightly higher than during the earlier period, but it has not grown at the exponential rate of import volumes.

While over the entire period insects and pathogens were detected at an almost equal rate (insects at 1.1/year; pathogens at 0.9/year), this disguises an interesting disparity: half of the arthropods were detected before 1940; half of the pathogens after 1960 (Nahrung and Carnegie (2020). By 2022, Nahrung and Carnegie (2022) said that, on average, one new forest insect is introduced each year. Some of these recently detected organisms have probably been established for years. More robust surveillance has  just detected them recently. I have blogged often about an apparent explosion of pathogens being transported globally in recent decades.

In a more recent article (Nahrung and Carnegie, 2022), gave 135 as the number of non-native forest insect pests. The authors don’t explain why this differs from the 143 arthropods listed before.

damage to pine plantations caused by Sirex noctilio; photo courtesy of Helen Nahrung

Eighty-seven percent of the established alien arthropods are associated with non-native hosts (e.g., Pinus, Platanus, Populus, Quercus, Ulmus) (Carnegie et al. 2022). Some of these have escaped eradication attempts and caused financial impact to commercial plantations (e.g., sirex wood wasp, Sirex noctilio) and amenity forests (e.g., elm leaf beetle, Xanthogaleruca luteola) (Carnegie and Nahrung 2019).

About 40% of the alien arthropods were largely cosmopolitan at the time of their introduction in Australia (Carnegie et al. 2022). Only six insects and six fungal species are not recorded as invasive elsewhere (Nahrung and Carnegie 2020). Of the species not yet established, 91% of interceptions from 2003 to- 2016 were known to be invasive elsewhere. There is strong evidence of the bridgehead effect: 95% of interceptions of three species were from their invaded range (Nahrung and Carnegie 2022). These included most of the insects detected in shipments from North America, Europe and New Zealand. These ubiquitous “superinvaders” have been circulating in trade for decades and continue to be intercepted at Australia’s borders. This situation suggests that higher interception rates of these species reflect their invasion success rather than predict it (Nahrung and Carnegie 2021).  

I find it alarming that most species detected in shipments from Africa, South America, and New Zealand were of species not even recorded as established in those regions (Nahrung and Carnegie 2021; Nahrung and Carnegie 2022).

Arhopalus ferus, a Eurasian pine insect often detected in wood from New Zealand; photo by Jon Sullivan – in New Zealand; via Flickr

Half of the alien forest pests established in Australia are highly polyphagous. This includes 73% of Asian-origin pests but only 15% of those from Europe (Nahrung and Carnegie 2021). Nahrung and Carnegie (2022) confirm that polyphagous species are more likely to be detected during border inspections.

PATHWAYS

As in North America and Europe, introductions of Hemiptera are overwhelmingly (98%) associated with fresh plant material (e.g. nursery stock, fruit, foliage). Coleoptera introductions are predominantly (64%) associated with wood (e.g. packaging, timber, furniture, and artefacts). Both pathways are subject to strict regulations by Australia (Nahrung and Carnegie 2021).

Eradication of High-Priority Pests

Eight-five percent of all new detections were not considered high-priority risks. Of the four that were, two had not previously been recognized as threats (Carnegie and Nahrung 2019). One high-priority pest – expected to pose a severe threat to at least some of Australia’s endemic plant species – is myrtle rust, Austropuccinia psidii. Despite this designation, when the rust appeared in Australia in 2010, the response was confused and ended in an early decision that eradication was impossible.  Myrtle rust has now spread along the continent’s east coast, with localized distribution in Victoria, Tasmania, the Northern Territory, and – in 2022, Western Australia.   `

Melaleuca quinquenervia forest; photo by Doug Beckers via Wikimedia

There have been significant impacts to native plant communities. Several reviews of the emergency response criticized the haste with which the initial decision was made to end eradication (Carnegie and Nahrung 2019). (A review of these impacts is here; unfortunately, it is behind a paywall.)

A second newly introduced species has been recognized as a significant threat, but only after its introduction to offshore islands. This is Erythina gall wasp Quadrastichus erythrinae (Carnegie and Nahrung 2019). DMF Although Australia is home to at least one native species in the Erythrina genus, E. vespertilio,, the gall wasp is not included on the environmental pest watch list.

Four of the recently detected species were considered to be high impact. Therefore eradication was attempted. Unfortunately, these attempts failed in three cases. The single success involved a pinewood nematode, Bursaphelenchus hunanesis. See Nahrung and Carnegie (2021) for a discussion of the reasons. This means three species recognized as high-impact pests have established in Australia over 15 years (Nahrung and Carnegie (2021). In fact, Australia’s record of successful forest pest eradications is only half the global average (Carnegie and Nahrung (2019).

Carnegie and Nahrung (2019) conclude that improving early detection strategies is key to increasing the likelihood of eradication. They discuss the strengths and weaknesses of various strategies. Non-officials (citizen scientists) reported 59% of the 260 forest pests detected (Carnegie and Nahrung 2019). Few alien pests have been detected by official surveillance (Carnegie et al 2022). However, managing citizen scientists’ reports involves a significant workload. Futhermore, surveillance by industry, while appreciated, is likely to detect only established species (Carnegie and Nahrung 2019).

Interception Frequency Is Not an Indicator of Likelihood of Establishment

Nahrung & Carnegie (2021) document that taxonomic groups already established in Australia are rarely detected at the border. Furthermore, only two species were intercepted before they were discovered to be established in Australia.

Indeed, 76% of species established in Australia were either never or rarely intercepted at the border. While more Hemiptera species are established in Australia, significantly more species of Coleoptera are intercepted at the border. Among beetles, the most-intercepted family is Bostrichid borers (powderpost beetles). Over the period 2003 – 2016, Bostrichid beetles made up 82% of interceptions in wood packaging and 44% in wood products (Nahrung and Carnegie 2022). This beetle family is not considered a quarantine concern by either Australian or American phytosanitary officials. I believe USDA APHIS does not even bother recording detections of powderpost beetles. Nahrung and Carnegie (2021) think the high proportion of Bostrichids might be partially explained by intense inspection of baggage, mail, and personal effects. While Australia actively instructs travelers not to bring in fruits and vegetables because of the pest risk, there are fewer warnings about risks associated with wood products. 

Nahrung & Carnegie (2021) concluded that interception frequencies did not provide a good overall indicator of likelihood of risk of contemporaneous establishment.

Do Programs Focus on the Right Species?

Although Hemiptera comprise about a third of recent detections and establishments, and four of eight established species are causing medium-to-high impact, no Hemiptera are currently listed as high priority forestry pests by Australian phytosanitary agencies (Nahrung & Carnegie (2021). On the other hand, Lepidoptera make up about a third of the high-priority species, yet only two have established in Australia over 130 years. Similarly, Cerambycidae are the most frequently intercepted forest pests and several are listed as high risk. But only three forest-related species have established (Nahrung and Carnegie 2020). (Note discussion of Bostrichidae above.).

Unlike the transcontinental exchanges under way in the Northern Hemisphere, none of the established beetles is from Asia; all are native to Europe. This is especially striking since interceptions from Asia-Pacific areas account for more than half of all interceptions Nahrung and Carnegie (2021).

Interestingly, 32 Australian Lepidopteran and eight Cerambycid species are considered pests in New Zealand. However, no forest pests native to New Zealand have established in Australia despite high levels of trade, geographic proximity, and the high number of shared exotic tree forest species (Nahrung and Carnegie 2020).

STRUCTURE OF PROGRAM

The structure of Australia’s plant biosecurity system is described in detail in Carnegie et al. (2022). These authors call the program “comprehensive” but to me it looks highly fragmented. The federal Department of Agriculture and Water Resources (DAWR,[recently renamed the Department of Agriculture, Fisheries, and Forestry, or DAFF) is responsible for pre-border (e.g., off-shore compliance) and border (e.g., import inspection) activities. The seven state governments, along with DAFF, are responsible for surveillance within the country, management of pest incursions, and regulation of pests. Once an alien pest has become established, its management becomes the responsibility of the land manager. In Australia, then, biosecurity is considered to be a responsibility shared between governments, industry and individuals.

Even this fragmented approach was developed more recently than one might expect given Australia’s reputation for having a stringent biosecurity system. Perhaps this reflects the earlier worldwide neglect of the Plant Kingdom? Carnegie and Nahrung (2019) describe recent improvements. Until the year 2000, Australia’s response to the detection of exotic plant pests was primarily case-by-case. In that year Plant Health Australia (PHA) was incorporated. Its purpose was to facilitate preparedness and response arrangements between governments and industry for plant pests. In 2005, the Emergency Plant Pest Response Deed (EPPRD) was created. It is a legally-binding agreement between the federal, state, and territorial governments and plant industry bodies. As of 2022, 38 were engaged. It sets up a process to implement management and funding of agreed responses to the detection of exotic plant pests – including cost-sharing and owner reimbursement. A national response plan (PLANTPLAN) provides management guidelines and outlines procedures, roles and responsibilities for all parties. A national committee (Consultative Committee on Emergency Plant Pests (CCEPP) works with surveys to determine invaded areas (delimitation surveys) and other data to determine whether eradicating the pest is technically feasible and has higher economic benefits than costs..

Austropuccinia psidii on Melaleuca quinquenervia; photo by John Tann via Flickr

Even after creation of EPPRD in 2005, studies revealed significant gaps in Australia’s post-border forest biosecurity systems regarding forest pests (Carnegie et al. 2022; Carnegie and Nahrung 2019). These studies – and the disappointing response to the arrival of myrtle rust – led to development of the National Forest Biosecurity Surveillance Strategy (NFBSS) – published in 2018; accompanied by an Implementation Plan. A National Forest Biosecurity Coordinator was appointed.

The forest sector is funding a significant proportion of the proposed activities for the next five years; extension is probable. Drs. Carnegie and Nahrung are pleased that the national surveillance program has been established. It includes specific surveillance at high-risk sites and training of stakeholders who can be additional eyes on the ground. The Australian Forest Products Association has appointed a biosecurity manager (pers. comm.)

This mechanism is expected to ensure that current and future needs of the plant biosecurity system can be mutually agreed on, issues identified, and solutions found. Plant Health Australia’s independence and impartiality allow the company to put the interests of the plant biosecurity system first. It also supports a longer-term perspective (Carnegie et al. (2022). Leading natural resource management organizations are also engaged (Carnegie, pers. comm.).

Presumably the forest surveillance strategy (NFBSS) structure is intended to address the following problems (Carnegie and Nahrung 2019):

  • Alien forest pests are monitored offshore and at the border, but post-border surveillance is less structured and poorly resourced. Australia still lacks a surveillance strategy for environmental pests.
  • Several plant industries have developed their own biosecurity programs, co-funded by the government. These include the National Forest Biosecurity Surveillance Strategy (NFBSS).

Some pilot projects targetting high risk sites were initiated in the early 2000s. By 2019, only one surveillance program remained — trapping for Asian spongy (gypsy) moth.

  • The states of Victoria and New South Wales have set up sentinel site programs. Victoria’s uses local council tree databases. It is apparently focused on urban trees and is primarily pest-specific – e.g., Dutch elm disease. The New South Wales program monitors more than 1,500 sentinel trees and traps insects near ports. This program is funded by a single forest grower through 2022.  

Dr. Carnegie states: “With the start of the national forest biosecurity surveillance program in December 2022, the issues and gaps identified by Carnegie et al. 2022 are starting to be addressed. The program will conduct biosecurity surveillance specifically for forest pests and pathogens and be integrated with national and state biosecurity activities. While biosecurity in Australia is still agri-centric, a concerted and sustained effort from technical experts from the forest industry is changing this. And finally, the new Biosecurity Levy should ensure sustained funding for biosecurity surveillance.”

There is a separate National Environmental Biosecurity Response Agreement (NEBRA), adopted in 2012. It is intended to provide guidelines for responding, cost-sharing arrangements, etc. when the alien pest threatens predominantly the environment or public amenity assets (Carnegie et al. (2022). However, when the polyphagous shot hole borer was detected, the system didn’t work as might have been expected. While PSHB had previously been identified as an environmental priority pest, specifically to Acacia, the decision whether to engage was made under auspices of the the Emergency Plant Pest Response Deed (EPPRD) rather than the environmental agreement (NEBRA). As a result, stakeholders focused on environmental, amenity and indigenous concerns had no formal representation in decision-making processes; instead, industries that had assessed the species as a low priority (e.g., avocado and plantation forestry) did (Nahrung, pers.comm.).

Additional Issues Needing Attention

Some needs are not addressed by the National Forest Pest Strategic Plan (Carnegie et al. 2022) (Nahrung, pers. comm.):

1) The long-term strategic investment from the commercial forestry sector and government needed to maintain surveillance and diagnostic expertise;

2) Studies to assess social acceptance of response and eradication activities such as tree removal; 

3) Studies to improve pest risk prioritization and assessment methods; and

4) Resolving the biosecurity responsibilities for pests of timber that has been cut and used in construction.

In 2019, Carnegie and Nahrung (2019) called for developing more effective methods of detection, especially of Hemiptera and pathogens. They also promoted national standardization of data collection. Finally, they advocated inclusion of technical experts from state governments, research organizations and industry in developing and implementing responses to pest incursions. They note that surveillance and management programs must be prepared to expect and respond to the unexpected since 85% of the pests detected over the last 20 years—and 75% of subsequently mid-to high-impact species established—were not on high-priority pest list. See Nahrung and Carnegie 2022 for a thorough discussion of the usefulness and weaknesses of predictive pest listing.

SOURCES

Aukema, J.E., D.G. McCullough, B. Von Holle, A.M. Liebhold, K. Britton, & S.J. Frankel. 2010. Historical Accumulation of Nonindigenous Forest Pests in the Continental United States. Bioscience. December 2010 / Vol. 60 No. 11

Carnegie A.J. and H.F. Nahrung. 2019. Post-Border Forest Biosecurity in AU: Response to Recent Exotic Detections, Current Surveillance and Ongoing Needs. Forests 2019, 10, 336; doi:10.3390/f10040336 www.mdpi.com/journal/forests

Carnegie A.J., F. Tovar, S. Collins, S.A. Lawson, and H.F. Nahrung. 2022. A Coordinated, Risk-Based, National Forest Biosecurity Surveillance Program for AU Forests. Front. For. Glob. Change 4:756885. doi: 10.3389/ffgc.2021.756885

Nahrung H.F. and A.J. Carnegie. 2020. NIS Forest Insects and Pathogens in Australia: Establishmebt, Spread, and Impact. Frontiers in Forests and Global Change 3:37. doi: 10.3389/ffgc.2020.00037 March 2020 | Volume 3 | Article 37

Nahrung, H.F. and A.J. Carnegie. 2021. Border interceps of forest insects estab in AU: intercepted invaders travel early and often. NeoBiota 64: 69–86. https://doi.org/10.3897/neobiota.64.60424

Nahrung, H.F. & A.J. Carnegie. 2022. Predicting Forest Pest Threats in Australia: Are Risk Lists Worth the Paper they’re Written on? Global Biosecurity, 2022; 4(1).

Posted by Faith Campbell

We welcome comments that supplement or correct factual information, suggest new approaches, or promote thoughtful consideration. We post comments that disagree with us — but not those we judge to be not civil or inflammatory.

For a detailed discussion of the policies and practices that have allowed these pests to enter and spread – and that do not promote effective restoration strategies – review the Fading Forests report at http://treeimprovement.utk.edu/FadingForests.htm

or

www.fadingforests.org

We Need Analyses of Pest Approach Rates, but Detection Data Are Not Adequate Basis

plants for sale in UK; Evelyn Grimak via Geograph what pests could be here?

There has recently been a series of studies trying to use port detection data to determine which types of insects are most likely to arrive and possibly establish in the country. These studies – and related sources – are listed at the end of this blog. Some of the studies focus on the U.S. experience, but not all. Their – and my – conclusions are meant to be relevant around the globe.

I agree with Nahrung et al. (2022) as a correct definition of the problem:

“… despite decades of research on and implementation of [biosecurity] measures, insect invasions continue to occur with no evidence of saturation, and are even predicted to accelerate.” 

I also think the issue they raise applies more broadly. As these experts point out, forest pests have received considerable attention, are the subject of a specific international regulation (ISPM#15), and the pest risks to a range of forests is relatively well understood and appreciated. So what does failing to control this group of pests – as I say the international phytosanitary system is – imply for other pests and pathways?

I appreciate these experts’ efforts to improve the many elements of excluding pests: prediction, pest risk analysis, targeted phytosanitary measures, enforcement actions, and early detection. However, we have a long way to go before we can confidently apply port data to determine pest approach rates as well as the efficacy of phytosanitary measures.

Problems with the Quality of the Port Detection Data

inspection by APHIS

There is general agreement that detection data are not a reliable indicator of the true pest approach / arrival rate. Even Turner et al. (2022) – who titled their article “Worldwide border interceptions provide a window …” — concede this, although they try to find ways to apply the detection data anyway. According to pages 2 and 15 of Turner et al., true arrival rates of potentially invading species are usually difficult to estimate and probably exceed the number reported in the article. Allison et al. (2021) agree.

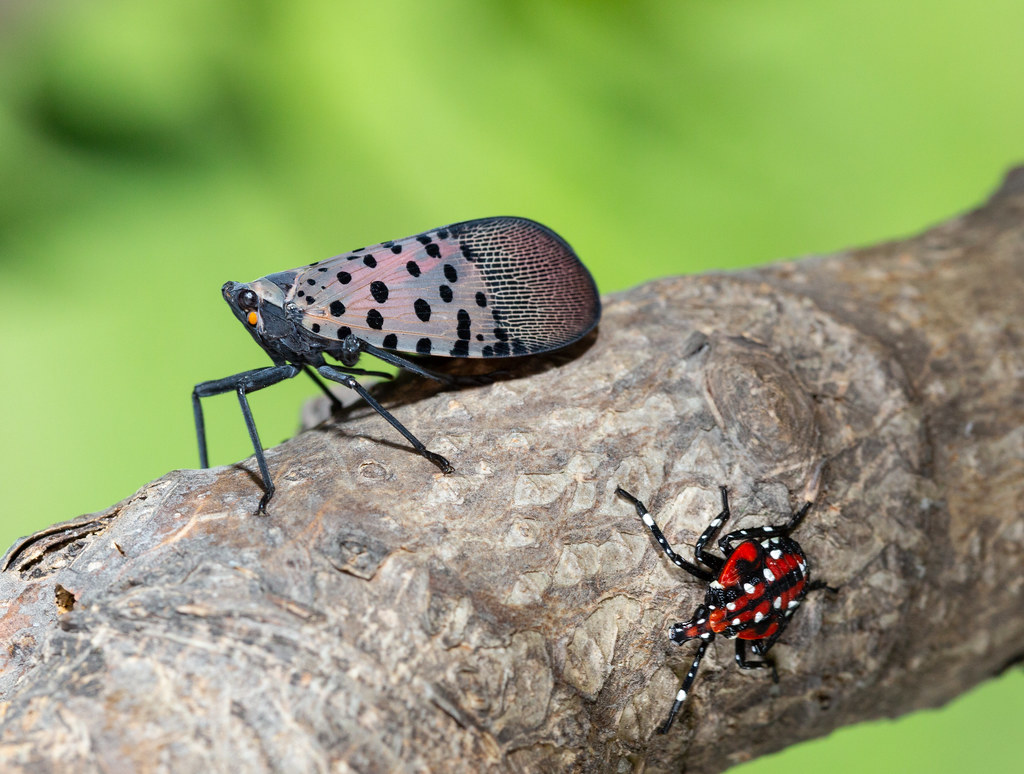
Turner et al. and Nahrung & Carnegie both note that many insect species established in the destination country are never or rarely detected. Turner et al. cite as an example spotted lanternfly, Lycorma delicatula, which appeared only once out of almost 1.9 million interceptions recorded in the combined global data. Nahrung & Carnegie note that 76% of species established in Australia were either never or rarely intercepted at the border.

Turner et al. explain that interception frequencies are a function of both the true arrival rates and the probability of (1) being detected during inspections (which depends on how these are carried out) and (2) being recorded. They say the data are more reliable when they report detections at the family-level. . The authors call on countries to base port inspections on a statistically based sampling program that would better reflect pest approach rates than do data biased by inspection priorities.

The issue of data quality might be broader. Certain kinds of pests travelling in certain types of imports might be sufficiently cryptic as to be rarely detected by even the best border inspections. Liebhold et al. (2012) found that APHIS inspectors detected actionable pests in only 2.6% of incoming shipments of plants, whereas a statistically valid audit determined that the actual approach rate was 12%. It is probable that many pests are never or rarely reported in official port detection data.

See a thorough discussion of the issues undermining use of interception data in Nahrung and Carnegie 2022, cited at the end of this blog.

Problems Due to Narrow Taxonomic Range of Pests Studied

Protection of our forests requires preventing introductions of many taxonomic groups, e.g., nematodes, fungal and other pathogens, viruses, and arthropods other than ambrosia beetles and Hemiptera.

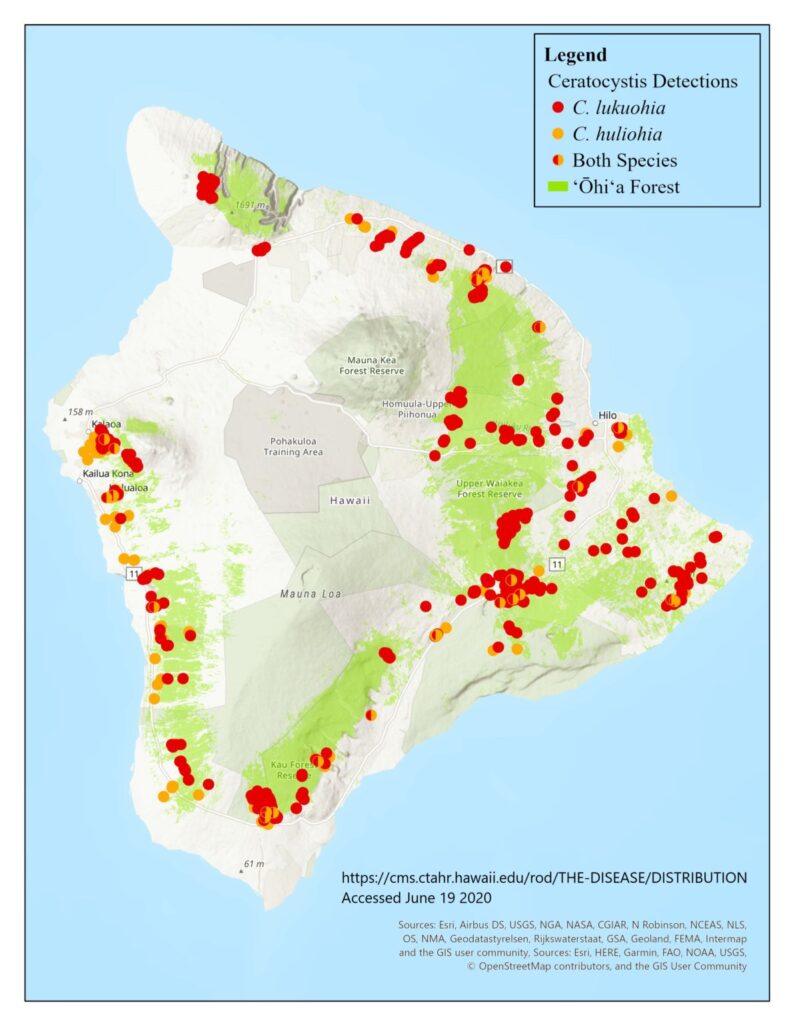
I recognize that it is much more difficult to study and manage organisms other than common beetles. But the impacts of some introduced organisms in other categories have been devastating. I list some of the pathogens that have been introduced to the United States in recent decades, probably on imported plants: several Phytophthoras, ohia rust (Austropuccinia psidii), rapid ohia death (Ceratocystis lukuohia and C. huliohia), beech leaf disease, and the boxwood blight fungi. See Garbelotto and Gonthier (2022) for a thorough discussion of impacts of introduced forest pathogens.

boxwood hedge at Longwood Gardens; photo by F.T. Campbell

Points of Agreement

I agree with Nahrung et al. that:

  1. Biosecurity successes are probably under-recognized because they are difficult to see whereas failures are more evident. They call this the “Biosecurity Paradox”: the more successful biosecurity is, the fewer new species establish so the less important it appears.
  2. Uncertainty regarding the costs and benefits of forest border biosecurity measures appears to have led to under-regulation and wait-and-see approaches. Some recent reviews (Cuthbert et al.) show that delay substantially increases the costs associated with bioinvasion. 297https://www.nivemnic.us/?p=3209
  3. Helping “weakest links” improve their performance is crucial. (see Geoff Williams et al.  
  4. We need to revise international and national biosecurity practices. However, my proposals differ from those cited on page 221 of Nahrung et al.; see my “Fading Forests” reports [links at end of this blog] and earlier blogs here and here. A new complication is that pathologists complain that proposed systems proposed by various invasive species experts don’t reflect realities of managing plant pathogens (Paap et al. 2022).

I wish Nahrung et al. had suggested bolder interim steps that go beyond data management and research.

I appreciate that the Canadian report on forest biosecurity (Allison et al.) notes that claiming most introduced forest pests are reported to cause no measurable impact probably reflects our ignorance. I wish others who repeat this assertion, e.g., Nahrung et al. 2022, would explore this claim’s truth more carefully.

Points of Disagreement

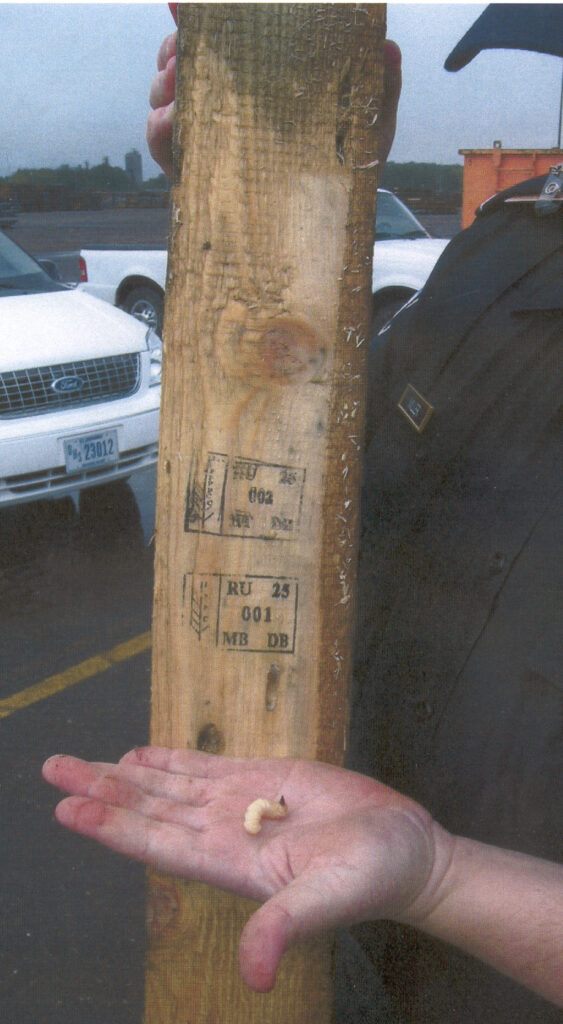
Customs and Border Protection officers inspecting infested pallet

I also found other statements about the efficacy of existing efforts to be too uncritical. So yes, ISPM#15 has resulted in decreased arrivals of bark- and wood-boring insects, as stated by Nahrung et al. 2022. However, the 36-52% decrease documented by Haack et al. (2014) is not sufficient to protect forests, in my view. Many publications have documented continuing introductions of damaging pests via the wood packaging pathway. For example, there have been 16 outbreaks of the Asian longhorned beetle (ALB) detected around the globe between 2012 and 2015 (Wang). Before we conclude that ISPM#15 has been a success, let’s see what the just-completed new study by Haack and colleagues shows. In addition, there has been controversy for a decade or more about what causes continuing introductions, that is, whether they result from treatment inadequacy v. sloppy application of treatments v. fraud. Why have scientists and regulators not collaborated to clarify this issue during this time?

I note – again – that many pathogens have been introduced widely over the last couple of decades. This is a global problem. My recent blogs have discussed introductions of tens of species of Phytophthora to countries around the world. Other examples include myrtle rust (Austropuccinia psidii) to 27 countries and the two causal agents of boxwood blight to at least 24 countries in Eurasia, New Zealand, and North America. Most of these species were unknown to science at the time of their introduction. Other species were known – but not believed to pose a threat because, in their native regions, their co-evolved hosts are not harmed. 

Rhodomyrtus psidioidis in Australia killed by myrtle rust; photo by Peter Entwistle

I think Helen Nahrung (Nahrung et al.) exaggerates when she says that Australia has one of the strictest biosecurity systems in world. Several publications – some coauthored by her! – cite numerous shortfalls in applying the country’s phytosanitary programs to forest pests (Carnegie et al 2022). This latter group’s efforts have determined that at least 260 non-native arthropods and pathogens of forest hosts have established in Australia since 1885 (Nahrung and Carnegie 2020). True, this number is about half the number of non-native forest insects and pathogens that have established in the United States over a period just 25 years longer (Aukema et al. 2010). However, it is enough – and they have had sufficient impact – to prod these scientists to spend 30 years pushing for improvements.

Lessons Learned

Still, we can learn from these studies. Turner et al. compared insect interception data from nine regions over a 25-year period (1995 to 2019)at ports in New Zealand, Australia, South Korea, Japan, Canada, mainland United States, Hawai`i, United Kingdom, and the region united under European Plant Protection Organization (EPPO) – Europe and the Mediterranean region.

They found that 174 species (2% of the total) were “superinvaders.” They were intercepted more than 100 times, and constituted 81% of all interceptions across all regions. Most of the same types of insects – even the same species – are arriving at ports around the world. The three species most frequently intercepted are all sap-feeding insects commonly associated with widely traded plants. In a separate study, Australian scientists found the same: about 40% of the alien pests detected at Australian borders were already widely introduced at the time of their introduction in Australia (Carnegie et al. 2022). The Australians report strong evidence of the bridgehead effect [that is, species being spread from locations to which they have been introduced] (Nahrung and Carnegie 2021). In fact, they conclude that higher interception rates might confirm invasion success rather than predict it.

Most of the species, however, are intercepted rarely. Turner et al. found that 75% of species reported in their nine regions were intercepted in only a single region. In fact, 44% of all species were intercepted only once (= “singletons”). Such singletons made up about half of individual species in five insect orders; the exception was Thysanoptera – 29% of those species were intercepted only once.

The 75% of all species that were intercepted in only one region included both species rarely intercepted anywhere and species intercepted numerous times – but only in that one region. The authors note that several possible factors might explain these differences. Some species are less likely to be intercepted, so it is not odd that they are detected infrequently, especially if all the regions have the same blind spots. Countries also have their unique approaches to data collection and inspection prioritization that could introduce biases in the data. Finally, countries vary in the sources of goods they import. Unfortunately, some of the data sets Turner at al. analyzed said nothing about the source country, pathway, or commodity. Consequently, they were unable to evaluate the influence of these factors.

Improving Our Understanding of the Current Risk to the U.S.

Dendrobium officinale via Wikipedia; Fusarium stilboides has been detected on this orchid in China; F. stilboides is reported to attack pine trees

As I noted in a previous blog, U.S. imports of plants have increased by more than 400% since the 1960s; 35% in just the last 15 years (MacLachlan et al. 2022). In 2011, APHIS adopted an important new policy: temporary prohibition of plant taxa determined to be “Not Authorized for Importation Pending Pest Risk Assessment” (NAPPRA). Now we have a decade of experience with NAPPRA. Given that, and because the “plants for planting” pathway is among the most risky, APHIS should update the Liebhold et al. 2012 study to determine the current approach rate for all types of organisms that threaten North American tree species. Unlike the previous study, the update should include trees on Hawai`i, Guam, Puerto Rico and the other U.S possessions and territories. Finally, the study should try to evaluate the difference in risks associated with various types of plants and – possibly – also source regions.

Hawaiian native plant naio; photo by Forrest and Kim Starr

Unknown Unknowns

As I noted above, problems curtailing introduction of tree-killing pests are not limited to the U.S. For more than a decade, scientists have noted that the international phytosanitary system has failed to prevent the rapid worldwide spread of significant pathogens via the international nursery trade. Examples include Brasier 2008; Liebhold el. al. 2012; Santini et al. 2013; Roy et al. 2014; Eschen et al. 2015; Jung et al. 2015; Meurisse et al. 2019; O’Hanlon et al. 2021. One of the principal concerns is the fact that most species of microorganisms have not been named by science, much less evaluated for their potential impacts on naïve hosts. This issue was raised by Sarah Green of British Forest Research at the annual meeting of the Continental Dialogue on Non-Native Forest Insects and Pathogens. She asked the APHIS representative whether the agency’s phytosanitary procedures (described here) are working to prevent introductions. She pointed to the issues raised by numerous scientific experts: pest risk analyses address only known organisms, so they cannot protect importers from unknown organisms.

U.S. scientists are beginning to address the issue of “unknown unknowns”. Some studies have taken a stab at evaluating traits of insects that are more likely to damage conifers (Mech et al.) and hardwoods (Schultz et al.).  Jiri Hulcr – of the University of Florida — assessed the threat posed by 55 insect-vectored fungi to two species of oak and two species of pines. However, the forests of the southeastern U.S. comprise many other tree genera! He also set a very high bar for defining a threat as serious: the damage to the host must be equivalent to that caused by Dutch elm disease or laurel wilt. We urgently need APHIS, USDA/Forest Service, and academia to sponsor more similar studies to evaluate the full range of risks more thoroughly.

SOURCES

Allison J.D., M. Marcotte, M. Noseworthy and T. Ramsfield. 2021. Forest Biosecurity in Canada – An Integrated Multi-Agency Approach. Front. For. Glob. Change 4:700825. doi: 10.3389/ffgc. 2021.700825 Frontiers in Forests and Global Change July 2021 | Volume 4 | Article 700825

Carnegie A.J. and H.F. Nahrung. 2019. Post-Border Forest Biosecurity in AU: Response to Recent Exotic Detections, Current Surveillance and Ongoing Needs. Forests 2019, 10, 336; doi:10.3390/f10040336 www.mdpi.com/journal/forests

Carnegie A.J., F. Tovar, S. Collins, S.A. Lawson, and H.F. Nahrung. 2022. A Coordinated, Risk-Based, National Forest Biosecurity Surveillance Program for AU Forests. Front. For. Glob. Change 4:756885. doi: 10.3389/ffgc.2021.756885

Cuthbert, R.N., C. Diagne, E.J. Hudgins, A. Turbelin, D.A. Ahmed, C. Albert, T.W. Bodey, E. Briski, F. Essl, P. J. Haubrock, R.E. Gozlan, N. Kirichenko, M. Kourantidou, A.M. Kramer, F. Courchamp. 2022. Bioinvasion costs reveal insufficient proactive management worldwide. Science of The Total Environment Volume 819, 1 May 2022, 153404

Garbelotto M. and P. Gonthier. 2022.  Ecological, evolutionary, and societal impacts of invasions by emergent forest pathogens. Chapter 7, Forest Microbiology. Elsevier 2022.

Li, Y. C. Bateman, J. Skilton, B. Wang, A. Black, Y-T. Huang, A. Gonzalez, M.A. Jusino, Z.J. Nolen, S. Freemen, Z. Mendel, C-Y. Chen, H-F. Li, M. Kolarik, M. Knizek, J-H. Park, W. Sittichaya, P.H. Thai, S-I. Ito, M. Torii, L. Gao, A.J. Johnson, M. Lu, J. Sun, Z. Zhang, D.C. Adams, J. Hulcr. 2021. Pre-invasion assessment of exotic bark beetle-vectored fungi to detect tree-killing pathogens. Phytopathology. https://doi.org/10.1094/PHYTO-01-21-0041-R

Liebhold, A.M., E.G. Brockerhoff, L.J. Garrett, J.L. Parke, and K.O. Britton. 2012. Live Plant Imports: the Major Pathway for Forest Insect and Pathogen Invasions of the US. www.frontiersinecology.org

MacLachlan, M.J., A. M. Liebhold, T. Yamanaka, M. R. Springborn. 2022. Hidden patterns of insect establishment risk revealed from two centuries of alien species discoveries. Sci. Adv. 7, eabj1012 (2021).

Mech,  A.M., K.A. Thomas, T.D. Marsico, D.A. Herms, C.R. Allen, M.P. Ayres, K.J. K. Gandhi, J. Gurevitch, N.P. Havill, R.A. Hufbauer, A.M. Liebhold, K.F. Raffa, A.N. Schulz, D.R. Uden, & P.C. Tobin. 2019. Evolutionary history predicts high-impact invasions by herbivorous insects. Ecol Evol. 2019 Nov; 9(21): 12216–12230.

Nahrung, H.F. and A.J. Carnegie. 2020. NIS Forest Insects and Pathogens in Australia: Establishment, Spread, and Impact. Front. For. Glob. Change 3:37. doi: 10.3389/ffgc.2020.00037 Frontiers in Forests and Global Change | www.frontiersin.org 2 March 2020 | Volume 3 | Article 37

Nahrung, H.F. and A.J. Carnegie. 2021. Border interceptions of forest insects established in Australia: intercepted invaders travel early and often. NeoBiota 64: 69–86. https://doi.org/10.3897/neobiota.64.604

Nahrung, H.F. & A.J. Carnegie. 2022. Predicting Forest Pest Threats in Australia: Are Risk Lists Worth the Paper they’re Written on? Global Biosecurity, 2022; 4(1).

Nahrung, H.F., A.M. Liebhold, E.G. Brockerhoff, and D. Rassati. 2022. Forest Insect Biosecurity: Processes, Patterns, Predictions, Pitfalls. Annu. Rev. Entomol. 2023.68.

Paap, T., M.J. Wingfield, T.I. Burgess, J.R.U. Wilson, D.M. Richardson, A. Santini. 2022. Invasion Frameworks: a Forest Pathogen Perspective.  FOREST PATHOLOGY https://doi.org/10.1007/s40725-021-00157-4

Schulz, A.N.,  A.M. Mech, M.P. Ayres, K. J. K. Gandhi, N.P. Havill, D.A. Herms, A.M. Hoover, R.A. Hufbauer, A.M. Liebhold, T.D. Marsico, K.F. Raffa, P.C. Tobin, D.R. Uden, K.A. Thomas. 2021. Predicting non-native insect impact: focusing on the trees to see the forest. Biological Invasions.

Turner, R. M., E. G. Brockerhoff, C. Bertelsmeier, R. E. Blake, B. Caton, A. James, A. MacLeod, H. F. Nahrung, S. M. Pawson, M. J. Plank, D. S. Pureswaran, H. Seebens, T. Yamanaka, and A. M. Liebhold. 2021. Worldwide border interceptions provide a window into human-mediated global insect movement. Ecological Applications 31(7):e02412. 10.1002/eap.2412

Wang, Q. (Ed.). 2017. Cerambycidae of the world: biology and pest management.  Boca Raton, FL: CRC Press

Posted by Faith Campbell

We welcome comments that supplement or correct factual information, suggest new approaches, or promote thoughtful consideration. We post comments that disagree with us — but not those we judge to be not civil or inflammatory.

For a detailed discussion of the policies and practices that have allowed these pests to enter and spread – and that do not promote effective restoration strategies – review the Fading Forests report at http://treeimprovement.utk.edu/FadingForests.htm

or

www.fadingforests.org

EAB: Why Quarantines Are Essential

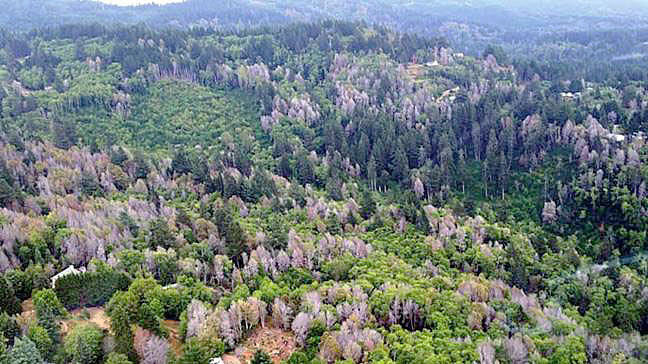
area devastated by EAB; photo by Nathan Siegert, USFS

The emerald ash borer (EAB; Agrilus planipennis) is the most damaging forest insect ever introduced. In late June 2022 it was detected in Forest Grove, Oregon — 26 miles from Portland. This is the first confirmation of EAB on the West Coast – a jump of over 1,000 miles from outbreaks in the Plains states. The infested ash trees were immediately cut down and chipped (see Oregon Department of Agriculture website; full link at end of blog). See my earlier blog on EAB’s threat to ash-dominated riparian wetlands in Oregon.

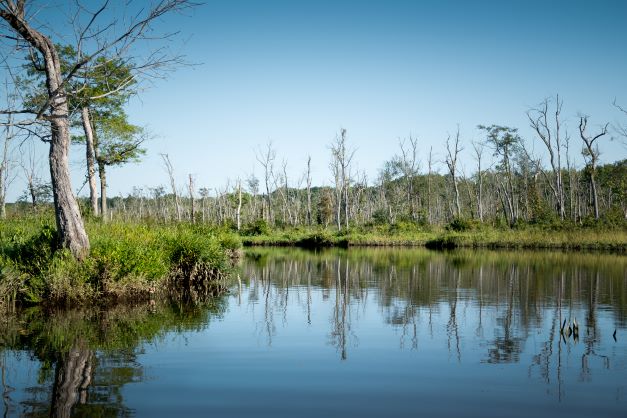
ash-dominated swamp along the Willamette River in Oregon; photo by William Wyatt, ODF

Oregon has been preparing for the EAB:

  • The state finalized its response plan in March 2021; see reference at end of blog.
  • The state sought and received funds from USDA APHIS to initiate a biocontrol program. The funds were not from APHIS’ operational budget, but from the agency’s Plant Pest and Disease Management and Disaster Prevention Program (PPDMDPP) (Farm Bill money).  
  • State and federal agencies have begun collecting seeds for resistance screening and a possible breeding program.

EAB: Why Quarantines Are Essential

As you might remember, in January 2021 APHIS dropped its federal regulations aimed at curtailing EAB’s spread via movement of wood and nursery plants. This shifted the responsibility for quarantines to state authorities. Instead, APHIS reallocated its funding to biological control. I raised objections at the time, saying the latter was no substitute for the former.

A new academic study shows that APHIS’ action was a costly mistake.

Hudgins et al. (2022; full citation at end of this blog) estimate EAB damage to street trees alone – not  counting other urban trees – in the United States will be roughly $900 million over the next 30 years. These costs cannot be avoided. Cities cannot allow trees killed by EAB to remain standing, threatening to cause injury or damage when they fall.

ash fallen onto house in Ann Arbor, Michigan; photo courtesy of former mayor John Hieftje

The authors evaluated various control options for minimizing the number of ash street trees exposed to EAB. They assessed the trees’ exposure in the next 40 years, based on management actions taken in the next 30 years.

In their evaluation of management options, Hudgins et al. tried to account for the fact that the effect of management at any specific site depends on the effects of previous management. Additional complexity comes from the facts that the EAB is spread over long distances largely by human actions (i.e., movement of infested wood); and that biocontrol organisms also disperse.

They conclude that efforts to control spread at the invasion’s leading edge alone – as APHIS’ program did – are less useful than accounting for urban centers’ role in long-distance pest dispersal via human movement. Cities with infested trees are hubs for pest transport along roads. Hudgins et al. say that quarantine programs need to incorporate this factor.

Hudgins et al. concluded that the best management strategy always relied on site-specific quarantines aimed at slowing the EAB spread rate. This optimized strategy, compared to conventional approaches, could potentially save $585 million and protect an additional 1 million street trees over the next 40 years. They also found that budgets should be allocated as follows: 74-89% of funds going to quarantine, the remaining 11% to 26% to biocontrol.

 In other words, a coherent harmonized quarantine program – either through reinstatement of the federal quarantine or coordination of state quarantines — could save American cities up to $1 billion and protect 1 million trees over several decades. Since street trees make up only a small fraction of all urban trees, up to 100 million urban ash trees could be protected, leading to even greater cost savings.

Unfortunately, such a coordinated approach seems unlikely. States continue to have very different attitudes about the risk. For example, Washington has no plans to adopt EAB regulations, despite it being detected in Oregon. To the north, Canada already has EAB quarantines and Hudgins et al. advise that they be maintained.

The authors recognize that quarantines’ efficacy is a matter of debate. Quarantines require high degrees of compliance from all economic agents in the quarantine area. Also they need significant enforcement effort. Some argue that meeting either requirement, let alone both, is unrealistic.  However, under Hudgins et al.’s model, use of quarantines was always part of the optimal management method across a variety of quarantine efficiency scenarios. Again, these models point to allocating about 75% of the total budget to quarantine implementation. In all scenarios, reliance solely on biocontrol led to huge losses of trees compared to a combined strategy.

Hudgins et al. asked their model for optimal application of both quarantines and biocontrol agents. For example, quarantine enforcement could focus on limiting entry of EAB at sites that: 1) have many ash street trees, 2) currently have low EAB propagule pressure, but 3) are vulnerable to receiving high propagule influx from many sites. Seattle is a prime example of such a vulnerable city with many transportation links to distant cities with significant ash populations.

On the other hand, quarantine enforcement could strive to limit outward spread (emigration) of EAB from which high numbers of pests could be transported to multiple other locales, each with many street trees and low propagule pressure. These sites would be along the leading edge of the invasion and where the probability of long-distance pest dispersal is high.

Authorities should be prepared to adjust quarantine actions in response to changing rates and patterns of invasion spread.

Biocontrol agents should be deployed to sites with sufficient EAB density to support the parasitoids, especially sites predicted to be hubs of spread.

Hudgins et al. concede that they did not explicitly account for:

1) The impact of uncertainty regarding EAB spread on the model;

2) Alternative objectives that might point to other approaches, e.g., minimizing extent of invaded range, or reducing the number of urban and forest trees exposed to EAB;

3) Impacts of predators, such as woodpeckers, on EAB populations;  

4) Synergistic impacts from climate change, which by exacerbating stress on ash trees will probably increase tree mortality from EAB infestations; and

5) Variation in management efficiency depending on communities’ capacities.

In the future, Hudgins et al. hope to test their model on other species to determine whether there is a predictable spatial pattern for all wood boring pests, that is, should quarantines always be focused on centers of high pest densities as probable sources of spread. Determining any patterns would greatly assist risk assessment and proactive planning.

dead ash near major road in northern Virginia; photo by F.T. Campbell

In an earlier study, Dr. Hudgins and other colleagues projected that by 2050, 1.4 million street trees in urban areas and communities of the United States will be killed by introduced insect pests – primarily EAB. This represents 2.1- 2.5% of all urban street trees. Nearly all of this mortality will occur in a quarter of the 30,000 communities evaluated. They predict that 6,747 communities not yet affected by the EAB will suffer the highest losses between now and 2060. However, they evaluated risks more broadly: the potential pest threat to 48 tree genera. Their model indicated that if a new woodboring insect pest is introduced, and that pest attacks maples or oaks, it could kill 6.1 million trees and cost American cities $4.9 billion over 30 years.  The risk would be highest if this pest were introduced via a port in the South. I have blogged often about the rising rate of shipments coming directly from Asia to the American South

SOURCES

Hudgins, E.J., J.O. Hanson, C.J.K. MacQuarrie, D. Yemshanov, C.M. Baker, I. Chadès, M. Holden, E.  McDonald-Madden, J.R. Bennett. 2022. Optimal emerald ash borer (Agrilus planipennis) control across the U.S.  preprint available here: https://doi.org/10.21203/rs.3.rs-1998687/v2

Hudgins, E.J., F.H. Koch, M.J. Ambrose, B. Leung. 2022. Hotspots of pest-induced US urban tree death, 2020–2050. Journal of Applied Ecology

Members of this team published an article earlier that evaluated the threat from introduced woodborers as a group to U.S. urban areas; see E.J. Hudgins, F.H. Koch, M.J. Ambrose, B. Leung. 2022. Hotspots of pest-induced US urban tree death, 2020–2050. Journal of Applied Ecology

Oregon Department of Agriculture: https://www.oregon.gov/oda/programs/IPPM/SurveyTreatment/Pages/EmeraldAshBorer.aspx

Posted by Faith Campbell

We welcome comments that supplement or correct factual information, suggest new approaches, or promote thoughtful consideration. We post comments that disagree with us — but not those we judge to be not civil or inflammatory.

For a detailed discussion of the policies and practices that have allowed these pests to enter and spread – and that do not promote effective restoration strategies – review the Fading Forests report at http://treeimprovement.utk.edu/FadingForests.htm

or

www.fadingforests.org

West Coast Steps Up Efforts to Protect Ash

Oregon-ash dominated swamp in the Ankeny National Wildlife Refuge, Willamette Valley, Oregon; photo by Wyatt Williams, Oregon Department of Forestry

In April 2022 I blogged about efforts on the West Coast to prepare for arrival of the emerald ash borer (EAB).

That blog focused on Oregon ash (Fraxinus latifolia), which is an important component of riparian forests. I alerted you to the availability of ODA/ODF EAB 2018 Response Plan.

I also mentioned Oregon’s active participation in “don’t move firewood” campaigns.

California has long inspected incoming firewood. In 2021 it establishment of a state quarantine in response to APHIS ending the federal quarantine. Washington State operates a statewide trapping program for invasive insects but does not regulate firewood.

Contributions from the Tualatin Soil and Water Conservation District enabled the USDA Forest Service Dorena Genetic Resource Center to begin testing Oregon ash for resistance to EAB and related genetics work. Other funding came from the USFS Forest Health Protection program.

EAB has now been detected in Oregon — in the Willamette Valley! (See photo above, by Wyatt Williams) Concerned stakeholders have established a new newsletter to keep people informed and promote cooperative efforts.

The newsletter is “Ash across the West”.

The first issue of the newsletter provides the following information:

  • there are eight ash species in the West; all are vulnerable to the emerald ash borer (EAB)

Single-leaf ash (Fraxinus anomala)     CA, NV, AZ, UT, NM, CO, WY

Fragrant ash (Fraxinus cuspidata)       NV, AZ, NM, UT

Calif ash (Fraxinus dipetala)               CA, NV, AZ, UT

Fresnillo (Fraxinus gooddingii)               AZ

Gregg’s ash (Fraxinus greggii)                        AZ

OR ash (Fraxinus latifolia)                  WA, OR, CA

Chihuahuan ash (Fraxinus papillosa)    AZ, NM, TX

Velvet ash (Fraxinus velutina)                         CA, NV, AZ, UT, NM, TX

  • EAB Risk Map for OR: based upon known occurrences of ash & corresponding human activities associated with known pathways of EAB introduction and establishment.
  • 2022 status of the two field trials
    • the Dorena Genetic Resource Center (DGRC): planted 600 seedlings from 27 families; 85% survival in 2022; controlling competing vegetation
    • Washington State University Puyallup Research Center: planted seedlings from 26 of these families; 95% survival rate. Possible complication from a foliar disease.  
  • Seedlings from 17 Oregon ash families (including 14 of those in the DGRC field trial) sent to Dr. Jennifer Koch (USFS) in Ohio) for EAB resistance/susceptibility testing.
  • Seed collections began in 2019; interrupted by COVID-19 in 2020 but resumed in 2021 and continue in 2022. Several consortia are involved in Oregon and Washington. In California and the other states, The Huntington Botanical Gardens will lead the collecting effort. Funding is from USFS Forest Health Protection. Seeds are stored for gene conservation; some are used for the field trials in Oregon and Washington and the initial EAB-resistance studies going on in Ohio.
  • Penn State Ash Genomic Project: Dr. Jill Hamilton is trying to create a ‘genomic passport’ for Oregon ash populations for use in establishing genotype-environment associations to inform seed transfer guidelines. If you would like to help Dr. Hamilton collect leaves for sampling, contact: Dr. Jill Hamilton at jvh6349@psu.edu

To help with seed collection, ash monitoring, documenting the importance of ash to various communities, and other activities; or to get on the mailing list for the newsletter, contact Richard Sniezko at Richard.sniezko@usda.gov

A video explaining the campaign to save Oregon ash is at https://youtu.be/uZmfLrxEA7g

Posted by Faith Campbell

We welcome comments that supplement or correct factual information, suggest new approaches, or promote thoughtful consideration. We post comments that disagree with us — but not those we judge to be not civil or inflammatory.

For a detailed discussion of the policies and practices that have allowed these pests to enter and spread – and that do not promote effective restoration strategies – review the Fading Forests report at http://treeimprovement.utk.edu/FadingForests.htm

or

www.fadingforests.org

APHIS: Release Study of Pest Approach Rates!

I have posted nearly 40 blogs about wood packaging (SWPM) since 2015. [You can view these by scrolling below archives to find category “wood packaging”.]

I first raised the need for APHIS to authorize Robert Haack to update his study analyzing pest “approach rates” in wood packaging in July 2018.

Why?

  1. SWPM has delivered our worst forest pests.

SWPM has been recognized as a major pathway of introduction of wood-boring insects for 30 years. Examples include the Asian longhorned beetle, emerald ash borer, redbay ambrosia beetle, and, possibly, the invasive shot hole borers.

For decades, pest-infested wood packaging has come primarily from the same countries: Mexico, Italy, China, and, more recently, Turkey. Many of our most damaging invaders have come from Asia so growing import volumes from Vietnam and other Asian countries also raise concern.    

2) The U.S. and Canada have required that wood be treated to kill pests for at least 16 years.

The U.S. and Canada fully implemented the international standard on wood packaging (ISPM#15) in early 2006 – nearly 17 years ago. They had earlier (1999) required treatment of SWPM from China – nearly 24 years ago.

3) Even old analyses concluded that more than 11,000 incoming containers harbored wood pests each year.  

The U.S., Canada, and Mexico import more than 31 million shipping containers per year (see “Background” below). Applying decade-old estimates to this number, we conclude that 11,600 of these containers are probably transporting a quarantine wood-boring pest. About 80% of the containers – and probably the pests! – come to U.S. ports. This pest risk is not limited to the West Coast; expansion of the Panama Canal and congestion at West Coast ports mean that an increasing number of ships are travelling directly to ports on the East and Gulf coasts. These region have already been demonstrated to be highly vulnerable to pests from Asia (ranging from Dutch elm disease and Asian longhorned beetle to laurel wilt and beech leaf disease.)

dead redbay trees – killed by redbay ambrosia beetle + laurel wilt fungus – introduced from Asia to Savannah, Georgia

4) Efforts to reduce the pest “approach rate” have not worked yet.

Meantime, administrative efforts to reduce the numbers of containers carrying pests have not been successful. The Bureau of Customs and Border Protection (CBP) has tried. CBP began penalizing individual shipments that are not in compliance with ISPM#15 in 2017 — 5 years ago.

As of the first three-quarters of Fiscal Year 2022 (John Sagle pers. comm. and Crenshaw-Nolan of CBD to Continental Dialogue on Non-Native Forest Insects and Diseases, September 2022), CBP has issued 510 Emergency Action Notifications (EAN) for noncompliant SWPM. About 38% (194) were issued because actionable pests had been discovered. The rest were issued because the ISPM#15 stamp (attesting to the wood having been treated) was either missing or fraudulent. The full-year interception rate will probably be comparable to interceptions in recent years: in FY2021, 548 EANs; in FY2020, 509; in FY2019, 746. CBP staff are disappointed that interceptions have not declined.  

CBP agents inspecting SWPM

5) APHIS has avoided stricter enforcement.

APHIS has not adopted an enforcement stance. It has not stiffened penalties. The agency did not raise these phytosanitary issues when it negotiated a major agriculture trade agreement with China in 2020.  The agency continued to insist that ISPM#15 is working – but agreed to work with Robert Haack to re-evaluate the approach rate only in 2021.

Correction: I became alarmed when the study had not been released four months after the analysis was completed (in May). I have since learned that the findings had not yet been completely written up and that internal reviews were proceeding. I apologize for the criticism in the original version of this blog. I impatiently await the study’s release, which I hope will be in a few weeks or months.

In the meantime, APHIS has also hired the Entomological Society to carry out an extensive study that includes analysis of interception data from five ports over a period of five years and rearing insects extracted from incoming wood packaging. I don’t want to postpone action aimed at curtailing introductions via this pathway for another five years!

APHIS has instead tried to improve foreign suppliers’ and phytosanitary agencies’ compliance with ISPM#15 through education. In partnership with Canada and Mexico, APHIS has supported two regional education workshops sponsored by the North American Plant Protection Organization (NAPPO).  APHIS is now expanding its outreach to smaller companies, industry associations, and foreign suppliers. APHIS and CBP are now collaborating with an industry initiative to train inspectors that insure other aspects of foreign purchases. In addition, the International Plant Protection Convention (IPPC) is developing a “guidance document”. These educational efforts are supported by the U.S. pallet trade association, National Wooden Pallet and Container Association.

For all of these reasons we urgently need the updated data on the pest approach rate in the analysis by Haack and colleagues. Until we see these results, we can’t know the current level of risk associated with growing volumes of imports or assess the effectiveness of new policies. For example, CBP incorporated compliance with ISPM#15 into its government-importer partnership aimed at ensuring cleanliness of supply chains (C-TPAT) in February 2021. Only by comparing the results of the “approach rate” study with future data collected using the same techniques will it be possible to know how effective this action has been. I greatly appreciate CBP’s efforts.

There is still the issue of untrustworthy stamps.

Past data indicate a high proportion – 87% – 95% — of the SWPM found to be infested bore the ISPM#15 stamp. The same proportion was found in a narrower study in Europe (Eyre et al. 2018). Nor are all problems associated with Asia – importers in Houston have complained that stamps on dunnage from Europe also cannot be trusted.

While there are questions about whether this breakdown results from treatment inadequacy (i.e., 56oC for 30 minutes does not kill the larvae), failure of application, or of fraud –

What matters is that neither regulators nor importers can rely on the stamp to identify pest-free wood packaging.

infested wood packaging bearing ISPM#15 mark; photo courtesy of Oregon Department of Agriculture

 (True: ISPM#15 was never intended to prevent pest introductions, only to “reduce the risk of introduction and spread of quarantine pests associated with the movement in international trade of  wood packaging material made from raw wood.”  Still, we should be trying to minimize pest introductions which threaten our wildland, rural, and urban forests.)

 CPB’s experience indicates that cracking down on individual shipments will not be sufficient.

Immediate actions to hold foreign suppliers responsible

  • U.S. and Canada refuse to accept wood packaging from foreign suppliers that have a record of repeated violations – whatever the apparent cause of the non-compliance. Institute severe penalties to deter foreign suppliers from taking devious steps to escape being associated with their violation record.
  • APHIS and CBP and their Canadian counterparts provide guidance to importers on which foreign treatment facilities have a record of poor compliance or suspected fraud – so they can avoid purchasing SWPM from them. I am hopeful that the voluntary industry program described here will help importers avoid using wood packaging from unreliable suppliers in the exporting country.
  • Encourage rapid switch to materials that won’t transport wood-borers. Plastic is one such material. While no one wants to encourage production of more plastic, the Earth is drowning under discarded plastic. Some firms are recycling plastic waste into pallets.

APHIS and CFIA have the authority to take these actions under the “emergency action” provision (Sec. 5.7) of the World Trade Organization’s Agreement on the Application of Sanitary and Phytosanitary Standards (WTO SPS Agreement). (For a discussion of the SPS Agreement, go to Fading Forests II, here.)

APHIS should also release the findings of the 2021-2022 study of approach rates by Haack and colleagues. Then the agency should invite stakeholders to discuss the implications, then develop and implement protective strategy reflecting its findings.

Longer-term Actions

APHIS and CFIA should cite their need for setting a higher “level of protection” to minimize introductions of pest that threaten our forests (described inter alia here.) They should then prepare a risk assessment to justify adopting more restrictive regulations that would prohibit use of packaging made from solid wood – at least from the countries with records of high levels of non-compliance.

Michigan champion green ash killed by emerald ash borer

APHIS and CFIA should also undertake the studies needed to determine the cause of the continuing issue of the wood treatment mark’s unreliability, then act to resolve it. Preferably, this work should be conducted with other countries and such international entities as the IPPC & International Forest Quarantine Research Group (IFQRG). However, if attempting such collaboration causes delays, they should begin unilaterally.  Upcoming opportunities to address this issue include:

  • FAO International Day of Forests in 2023
  • FAO global assessment of forests & health –  pest & disease outbreaks

Of course, these steps should be based on the findings of Haack and colleagues.

Meanwhile, what can we do?

  • Urge Congress to conduct oversight on APHIS’ failure to protect America’s natural resources from continuing introductions of nonnative insects and diseases.
    • These hearings should be in the context of drafting the 2023 Farm Bill.
  • Raise the issue with local, state, and federal candidates for office;
  • Urge Congress to include provisions of H.R. 1389 in the 2023 Farm Bill;
  • Ask any associations of which we are members to join in communicating these concerns to Congressional representatives and senators. These include:
    • if you work for a federal or state agency – raise to leadership; they can act directly or through National Plant Board, National Association of State Departments of Agriculture, National Association of State Foresters, National Governors Association, National Association of Counties
    • scientific membership societies – e.g., Society of American Foresters, Entomological Society of America, American Phytopathological Society;
    • individual conservation organizations, either with state chapters or at the national level;
    • woodland owners’ organizations, e.g., National Woodland Owners Association, National Alliance of Forest Owners (NAFO) and their state chapters
    • urban tree advocates
    • International Forest Quarantine Research Group
  • Write letters to the editors of your local newspaper or TV news station. 

BACKGROUND: Calculation of the Number of Infested Containers Entering U.S.

As of 2020 (when trade was greatly depressed by the COVID-19 pandemic), nearly 31 million TEUs [a standardized measure for containerized shipment; defined as the equivalent of a 20-foot long container] entered North America. Ports in the U.S. received 80% (24.5 million); Canada 11.5% (3.5 million); Mexico ~9% (2.7 million). U.S. imports have grown substantially since 2020; during the first quarter of 2022 U.S. imports from Asia each month were 20 to 30% higher than in 2019 before COVID-19 disrupted supply chains (blog #292).  The U.S. is projected to handle ~26 million TEUs in 2022 [sources here and here.

A “TEU” equals a 20-feet container. Most containers now are twice as large – 40-feet. Several steps are involved in applying findings of Haack et al. 2014 and Meissner 2009 estimates:

  1. divide estimated number of containers (26 million) in half = 13 million.
  2. Assume that three-quarters of that number (13 million) contain wood packaging (based on Meissner) = 9.75 million. 
  3. If 1 out of each thousand of these containers with wood packaging is transporting a pest = 9,750 containers / year.

I performed the same calculation for North America-wide estimate of 31 million TEUs discussed at the beginning of the blog.

container being offloaded at Savannah harbor; photo by F.T. Campbell

A separate study (Hudgins et al. 2022) projected that introduction of a new woodboring insect pest that  attacks maples or oaks it could kill 6.1 million trees and cost American cities $4.9 billion over 30 years.  The risk would be highest if this pest were introduced via a port in the South.  I have blogged often about the rising rate of shipments coming directly from Asia to the American South.

An analysis of fungi associated with Eurasian bark and ambrosia beetles reached a conclusion that the authors consider to be more optimistic. Li et al. (2021) found that none of the 111 fungi was sufficiently virulent to trigger tree mortality after a single-point inoculation. This level of lethality was considered analagous to Dutch elm disease DMF or laurel wilt DMF. Thirty-eight percent of the fungi were considered to be weak or localized pathogens that could kill trees under certain conditions. However, they tested the fungi against only two oak and two pine species. They did not evaluate fungi that might be lethal when the vector beetle engages in mass attacks. Finally, I think phytosanitary agencies should act promptly when a pathogen threatens levels of mortality somewhat below Dutch elm disease and laurel wilt!

SOURCES

Hudgins, E.J., F.H. Koch, M.J. Ambrose, B. Leung. 2022. Hotspots of pest-induced US urban tree death, 2020–2050. Journal of Applied Ecology 59(5): 1302-1312.

Li, Y., C. Bateman, J. Skelton, B. Wang, A. Black, Y-T. Huang, A. Gonzalez, M.A. Jusino, Z.J. Nolen, S. Freeman, Z. Mendel, C-Y. Chen, H-F. Li, M. Kolařík, M. Knížek, J-H. Park, W. Sittichaya, P.H. Thai, S-I. Ito, M. Torii, L. Gao, A.J. Johnson, M. Lu, J. Sun, Z. Zhang, D.C. Adams, J. Hulcr. 2021. Pre-invasion assessment of exotic bark beetle-vectored fungi to detect tree-killing pathogens Phytopathology. 112(2): 261–270. https://doi.org/10.1094/PHYTO-01-21-0041-R

Posted by Faith Campbell

We welcome comments that supplement or correct factual information, suggest new approaches, or promote thoughtful consideration. We post comments that disagree with us — but not those we judge to be not civil or inflammatory.

For a detailed discussion of the policies and practices that have allowed these pests to enter and spread – and that do not promote effective restoration strategies – review the Fading Forests report at http://treeimprovement.utk.edu/FadingForests.htm

or

www.fadingforests.org

Invasive shot hole borers: global threat; will international phytosanitary system prevent further spread?

ISHB-infested California sycamore; photo by Beatriz Nobua-Behrmann, University of California Cooperative Extension

Numerous ambrosia beetles have become introduced species. Their invasions are facilitated by their cryptic habits and ecologies, wide host ranges, and specialized breeding systems – all of which allow extremely low populations to start an infestation. The way they breed often results in low genetic diversity in their introduced ranges, but this has not hampered their success. [Bierman et al. 2022]

Also, ambrosia beetles carry fungi, which provide food needed by their larvae. While most of these fungi don’t harm living trees, some do. The United States has been invaded by three damaging ambrosia beetle-fungal complexes: laurel wilt in the Southeast, and Fusarium dieback disease, carried to southern California with polyphagous and Kuroshio shot hole borers.

These shot hole borers and their fungi represent an especially high risk to our forests because they can be transported in both living and dead wood. So not only massive U.S. imports of live plants but also the global movement of goods enclosed in solid wood packaging offer ready pathways for them to arrive and spread here. Neither pathway is regulated effectively enough to prevent either pest imports or interstate spread.

Invasive ambrosia beetles in California and Hawai’i

The invasive ambrosia beetles introduced to California are in the genus Euwallacea. This genus has undergone several taxonomic revisions. Now, the Euwallacea are divided into four species (Stouthammer 2017), of which three are in the U.S.:

  • Euwallacea fornicatus s.s. – common name polyphagous shot hole borer; first came to attention in southern California in 2012; formerly known as E. whitfordiodendrus.
  • E. perbrevis – common name tea shot hole borer; formerly known as E. fornicatus s.l.
  •  E. kuroshio – unchanged nomenclature since detected in California in 2013;
  • E. fornicatior — apparently has not invaded outside of its native range in Asia.

Those now in the U.S. have been introduced to naïve habitats here and elsewhere, often with dire consequences. E. perbrevis, and possibly other species in the complex, are established on the Hawaiian islands.

For an extensive discussion of their introduction history go here  

The Fungi: U.S. and Worldwide

Several fungal associates are vectored by the polyphagous shot hole borer (PSHB) and Kuroshio shot hole borer (KSHB). The most important are Fusarium euwallacea and Fusarium kuroshium, respectively. These fungi were only described after they appeared in California in the 2010s. They cause Fusarium dieback disease.

Because the two beetle species are difficult to distinguish and the associated diseases cause very similar impacts, Californians studying them and educating stakeholders now speak of the two beetle-fungus complexes as one unit, “invasive shot hole borers”.  

Both PSHB and KSHB have numerous genetic strains, or haplotypes. For PSHB, the greatest haplotype diversity is in Asia – Thailand, Vietnam and China. Remember that these same regions are also a center of diversity for the huge genus Phytophthora, blog a genus widely recognized as containing many plant pathogens. https://www.dontmovefirewood.org/pest_pathogen/sudden-oak-death-syndrome-html/ One of the PSHB haplotypes, H33, has invaded many more regions than the others, including Israel, California, and South Africa. It has also been detected in several tropical plant greenhouses in Europe (where it has been eradicated). H33apparently is native to Vietnam – near Hanoi and Ho Chi Minh City – the country’s major ports (Rugman-Jones et al 2020 and pers. comm.). Does this haplotype’s spread to three continents reflect circumstances, such as the proximity of its native range to major ports and a “bridgehead effect” from its multiple introductions (the insects can be introduced to new regions on shipments from invaded regions established earlier)? Or does it point to an unknown genetic superiority (Bierman et al. 2022). This issue seems worth exploring.

I have blogged about the rising volume of imports from Vietnam, including to ports on the Gulf Coast –a region that has climatic similarities to Vietnam and known host species, so it seems quite vulnerable to invasion by either PSHB or KSHB.

A second species in the genus, KSHB, was detected in southern California in 2012; it has now spread to Mexico. So far, only one haplotype of this species has been detected in North America; this haplotype is widespread in Taiwan.

Finally, E. perbrevis (formerly known as E. fornicatus s.l.) has been detected in Florida, Hawai`i (island of Maui), and West Australia (to which it is probably native). This species has also been detected in nurseries in the Netherlands, where authorities report that it has been eradicated (Rugman-Jones et al. 2020).

Akacia koa – native tree in Hawai“i attacked by Euwallaceae; photo by David Eckhoff, via Flickr

Some species or haplotypes have been detected in only one introduced location: E. fornicatus H35 and E. kuroshio (H20) in California; H38 in South Africa; H43 on Oahu and the Big Island of Hawai`i; and an unnamed haplotype in West Australia (Rugman-Jones et al. 2020).

This is a brief guide to worldwide invasions by one or more Euwallacea-fungus complexes (Rugman-Jones et al. 2020):

  • Southern California — two haplotypes of E. fornicatus s.s. (H33 & H35) and E. kuroshio (one  haplotype).
  • Hawai`i – a unique haplotype of E. fornicatus s.s. (H43) on Oahu, the Big Island, and possibly other islands; E. perbrevis on Maui and possibly other islands.
  • Israel — E. fornicatus s.s. haplotype H33 only.
  • South Africa — E. fornicatus s.s. haplotype H33 and a unique haplotype (H38).
  • Western Australia — a unique haplotype of E. fornicatus s.s. and E. perbrevis (which is probably native in northern Queensland).
  • Greenhouses in Europe – both E. fornicatus s.s. (haplotype not specified) and – in the Netherlands — E. perbrevis; both reported eradicated.

When a location has been invaded by two or more species or haplotypes, this is probably an indication of separate introductions. Multiple introductions thus are suspected in California (Stouthamer et al. 2017; Bierman et al. 2022); South Africa (Bierman et al. 2022); and Hawai`i (Bierman et al. 2022).

As is true of other pathogens, e.g., Phytophthoras, there appears to have been a spurt of introductions in recent decades, to, e.g., California, South Africa, and the second species in Hawai`i. Bierman et al 2022 note the constantly growing number of locations with introductions.

Indigofera jucuna – reproductive host of PSHB in South Africa; photo by Giardano de Barcelona

Impact and Spread

As is common in the case of forest pests, especially pathogens, detection occurred only years after the initial introduction. In South Africa this delay was five years – from 2012 to 2017 or 2018. In California, identification of the species as PSHB in 2012 was nine years after the organism was first detected in the state (2003).

Over the decade since 2012, PHSB, KSHB, and the pathogens they transmit have spread through large portions of southern California. KSHB has spread through “jumps” to distant locations in Orange, Los Angeles, and as far as Santa Barbara and Ventura counties. There have also been detections in even more distant San Luis Obispo and Santa Clara. These latter apparently have not become established.

A likely explanation for this pattern is the movement of firewood. (Rugman-Jones et al 2020 and pers. comm.) See the map here The two beetles and the plant pathogens they carry are expected to spread throughout much of California wherever their many host plants occur.

On Hawai`i, PSHB is attacking several endemic species including one of the largest forest trees, Acacia koa, as well as Pipturus albidus and Planchonella sandwicensis. Numerous non-native species growing on the Islandsare also attacked, including crops (Macadamia and Mangifera) and invasive species

In South Africa, PSHB has spread faster and farther. It has been present since at least 2012 (Stouthamer et al. 2017), although it was not identified until 2018. In about a decade it has spread to every province except Limpopo – PSHB’s largest geographical outbreak of this beetle [Bierman et al. 2022]

Hosts and Areas at Greatest Risk

Hundreds of plant species in at least 33 plant families support successful reproduction of both beetle and fungus. These include many species widespread in southern California, other parts of the U.S., and South Africa. Some California ecosystems are at particular risk because they are dominated by susceptible tree or shrub species. These vulnerable ecosystems are mixed evergreen forests, oak woodlands, foothill woodlands, and riparian habitats. In San Diego County alone, more than 58,000 acres of riparian woodlands are at risk (California Forest Pest Council).

Experience with the Kuroshio shot hole borer (KSHB) in the Tijuana River valley along the California-Mexico border demonstrates the importance of ecological factors in determining disease outcomes. Following introduction, the KSHB killed a high proportion of the willows near the main river channel. However, beginning in 2016, these trees have regrown to almost pre-infestation sizes. Lead researcher John Boland is not certain why these new, fast-growing trees have not been attacked by the KSHB which remains in the area. See links to the Boland studies below.
riparian forest in Tijuana River Valley after recovery from KSHB attack; photo by John Bolton

Urban forests are at particular risk. For example, in South Africa, conservative estimates were that 25% of urban trees would be lost (Bierman et al. 2022). In California, a model developed by Shannon Lynch found the cities at greatest jeopardy are San Diego, Los Angeles, the San Francisco Bay area, and Sacramento. In other areas in the state that lack data on city tree composition, Lynch applied climate models; this approach extended the list of threatened areas to the eastern half of southern California and other parts of the Central Valley. (Lynch presentation to ISHB webinar April 2022; 2nd day.) In my view, this model should also be applied to cities in Arizona and Nevada with similar climates.
Management

Symptoms of PSHB attack and fungus infection differ among tree species. For illustrations of the symptoms on various species, visit here.

Most important, prevent the beetles’ spread through movement of dead or cut wood, e.g., green waste, firewood, and even large wood chips or mulch. Websites provide information on managing these sources.

Where the beetles have already established, California scientists recommend focusing management on heavily infested “amplifier trees”. On these trees, dead limbs should be pruned; dying trees and those with beetles infesting the main trunk should be removed. The wood must be disposed of properly.

Sources

Bierman, A., F. Roets, J.S. Terblanche. 2022.  Population structure of the invasive ambrosia beetle, Euwallacea fornicatus, indicates multiple introductions into South Africa. Biol Invasions (2022) 24:2301–2312 https://doi.org/10.1007/s10530-022-02801-x

Boland, J.M. — all of Boland’s reports and articles on the KSHB are available at: The Ecology and Management of the Kuroshio Shot Hole Borer in the Tijuana River Valley — Tijuana Estuary : TRNERR]

California Forest Pest Council. 2015. 2015 California Forest Pest Conditions. http://bofdata.fire.ca.gov/hot_topics_resources/2015_california_forest_pest_conditions_report.pdf

Eskalen, A., Stouthamer, R., Lynch, S. C., Twizeyimana, M., Gonzalez, A., and Thibault, T. 2013. Host range of Fusarium dieback and its ambrosia beetle (Coleoptera: Scolytinae) vector in southern California. Plant Dis. 97:938-951.

Stouthamer, R., P. Rugman-Jones, P.Q. Thu, et al. 2017. Tracing the origin of a cryptic invader: phylogeography of the Euwallacea fornicatus (Coleoptera: Curculionidae: Scolytinae) species complex. Agric For Entomol 19:366-375. https://doi.org/10.1111/afe.12215

recordings of April 2022 webinar posted at https://youtu.be/RyqJYyLkshk  day 1; and https://youtu.be/kWmtcbjTczw day 2

Posted by Faith Campbell

We welcome comments that supplement or correct factual information, suggest new approaches, or promote thoughtful consideration. We post comments that disagree with us — but not those we judge to be not civil or inflammatory.

For a detailed discussion of the policies and practices that have allowed these pests to enter and spread – and that do not promote effective restoration strategies – review the Fading Forests report at http://treeimprovement.utk.edu/FadingForests.htm

or

www.fadingforests.org

Hundreds of U.S. Tree Species Endangered, Most due to Non-Native Pests

Horton House on Jekyll Island, Georgia before laurel wilt killed the giant redbay trees; photo by F.T. Campbell

Close to four hundred tree species native to the United States are at risk of extinction. The threats come mainly from non-native insects and diseases – a threat we know gets far too little funding, policy attention, and research.

As Murphy Westwood, Vice President of Science and Conservation at the Morton Arboretum, which led the U.S. portion of a major new study, said to Gabriel Popkin, writing for Science: “We have the technology and resources to shift the needle,” she says. “We can make a difference. We have to try.”

Staggering Numbers

More than 100 tree species native to the “lower 48” states are endangered (Carrero et al. 2022; full citation at the end of this blog). These data come from a global effort to evaluate tree species’ conservation status around the world. I reported on the global project and its U.S. component in September 2021. This month Christina Carrero and colleagues (full citation at the end of this blog) published a summary of the overall picture for the 881 “tree” species (including palms and some cacti and yuccas) native to the contiguous U.S. (the “lower 48”).

This study did not address tree species in Hawai`i or the U.S. Pacific and Caribbean territories. However, we know that another 241 Hawaiian tree species are imperiled (Megan Barstow, cited here).

Assessing Threats: IUCN, NatureServe, and CAPTURE

Carrero and colleagues assessed trees’ status by applying methods developed by IUCN and NatureServe. (See the article for descriptions of these methods.) These two systems consider all types of threats. Meanwhile, three years ago Forest Service scientists assessed the specific impacts of non-native insects and pathogens on tree species in the “lower 48” states and Alaska in “Project CAPTURE” (Conservation Assessment and Prioritization of Forest Trees Under Risk of Extirpation). All three systems propose priorities for conservation efforts. For CAPTURE’s, go here.

Analyses carried out under all three systems (IUCN, NatureServe, and CAPTURE) concur that large numbers of tree species are imperiled. Both IUCN and CAPTURE agree that non-native insects and pathogens are a major cause of that endangerment. While the overall number of threatened species remained about the same for all three systems, NatureServe rated threats much lower for many of the tree species that IUCN and CAPTURE considered most imperiled.

This difference arises from the criteria used to rate a species as at risk. IUCN’s Criterion A is reduction in population size. Under this criterion, even extremely widespread and abundant species can qualify as threatened if the population declines by at least 30% over three generations in the past, present, and/or projected future. NatureServe’s assessment takes into account rapid population decline, but also considers other factors, for example, range size, number of occurrences, and total population size. As a result, widespread taxa are less likely to be placed in “at risk” categories in NatureServe’s system.

In my view, the IUCN criteria better reflect our experience with expanding threats from introduced pests. Chestnut blight, white pine blister rust, dogwood anthracnose, emerald ash borer, laurel wilt disease, beech leaf disease, and other examples all show how rapidly introduced pathogens and insects can spread throughout their hosts’ ranges. (All these pests are profiled here . ) They can change a species’ conservation status within decades whether that host is widespread or not.  

Which Species Are at Risk: IUCN

Carrero and colleagues found that under both IUCN and NatureServe criteria, 11% to 16% of the 881 species native to the “lower 48” states are endangered. Another five species are possibly extinct in the wild. Four of the extinct species are hawthorns (Crataegus); the fifth is the Franklin tree (Franklinia alatamaha) from Georgia. A single specimen of a sixth species, an oak native to Texas (Quercus tardifolia),was recently re-discovered in Big Bend National Park.

Franklinia (with Bachman’s warbler); both are extinct in the wild; painting by John Jacob Audubon

The oak and hawthorn genera each has more than 80 species. Relying on the IUCN process, Carrero and colleagues found that a significant number of these are at risk: 17 oaks (20% of all species in the genus); 29 hawthorns (34.5% percent). A similar proportion of species in the fir (Abies), birch (Betula), and walnut (Juglans) genera are also threatened.

Other genera have an even higher proportion of their species under threat, per the IUCN process:

  • all species in five tree genera, including Persea (redbay, swampbay) and Torreya (yews);
  • two-thirds of chestnuts and chinkapins (Castanea), and cypress (Cupressus);
  • almost half (46.7%) of ash trees (Fraxinus).                                                    

Pines are less threatened as a group, with 15% of species under threat. However, some of these pines are keystone species in their ecosystems, for example the whitebark pine of high western mountains.

Carrero et al. conclude that the principal threats to these tree species are problematic and invasive species; climate change and severe weather; modifications of natural systems; and overharvest (especially logging). Non-native insects and pathogens threaten about 40 species already ranked by the IUCN criteria as being at risk and another 100 species that are not so ranked. Climate change is threatening about 90 species overall.

range of black ash

Considering the invasive species threat, Carrero and colleagues cite specifically ash trees and the bays (Persea spp.). In only 30 years, the emerald ash borer has put five of 14 ash species at risk. All these species are widespread, so they are unlikely to be threatened by other, more localized, causes. In about 20 years, laurel wilt disease threatens to cause extinction of all U.S. tree species in the Persea genus.

Carrero and colleagues note that conservation and restoration of a country’s trees and native forests are extremely important in achieving other conservation goals, including mitigating climate change, regulating water cycles, removing pollutants from the air, and supporting human well-being. They note also forests’ economic importance.

As I noted above, USFS scientists’ “Project CAPTURE” also identified species that deserve immediate conservation efforts.

Where Risk Assessments Diverge

All three systems for assessing risks agree about the severe threat to narrowly endemic Florida torreya and Carolina hemlock.

With three risk ranking systems, all can agree (as above), all can disagree, or pairs can agree in four different ways. Groups of trees fall into each pair, with various degrees of divergence.  Generally, only two of the three systems agree on more widespread species:

  • black ash: IUCN and Project CAPTURE prioritize this species. NatureServe ranked it as “secure” (G5) as recently as 2016.
  • whitebark pine: considered endangered by IUCN, “vulnerable” (G3) by NatureServe. The US Fish and Wildlife Service has proposed listing the species as “threatened” under the Endangered Species Act. https://www.fws.gov/species-publication-action/endangered-and-threatened-wildlife-and-plants-threatened-species-18 However, Project CAPTURE does not include it among its highest priorities for conservation. Perhaps this is because there are significant resistance breeding and restoration projects already under way.
  • tanoak: considered secure by both IUCN and NatureServe, but prioritized by Project CAPTURE for protection.
dead tanoak in Curry County, Oregon; photo by Oregon Department of Forestry

Carrero notes the divergence between IUCN and NatureServe regarding ashes. Four species ranked “apparently secure” (G4) by NatureServe (Carolina, pumpkin, white, and green ash) are all considered vulnerable by IUCN. They are also prioritized by Project CAPTURE. I have described the impact of the emerald ash borer on black ash. Deborah McCullough, noted expert on ash status after invasion by the emerald ash borer, also objects to designating this species as “secure” (pers. comm.).

This same divergence appears for eastern hemlock.

Port-Orford cedar is currently ranked as at risk by IUCN and Project CAPTURE, but not NatureServe. Growing success of the restoration breeding project has prompted IUCN to change the species’ rank from “vulnerable” to “near threatened”. IUCN is expected to reclassify it as of “least concern” in about a decade if breeding efforts continue to be successful (Sniezko presentation to POC restoration webinar February 2022).

While these differing detailed assessments are puzzling, the main points are clear: several hundred of America’s tree species (including many in Hawai`i, which – after all – is our 50th state!) are endangered and current conservation and restoration efforts are inadequate.

Furthermore, a tree species loses its function in the ecosystem long before it becomes extinct. It might still be quite numerous throughout its range – but if each individual has shrunken in size it cannot provide the same ecosystem services. Think of thickets of beech root sprouts – they cannot provide the bounteous nut crops and nesting cavities so important to wildlife. Extinction is the extreme. We should act to conserve species much earlier.

YOU CAN HELP!

Congress is considering the next Farm Bill – which is due to be adopted in 2023. Despite its title, this legislation has often provided authorization and funding for forest conservation (for example, the US Forest Service’ Landscape Scale Restoration Program).

There is already a bill in the House of Representatives aimed at improving the US Department of Agriculture’s prevention and early detection/rapid response programs for invasive pests. Also, it would greatly enhance efforts to restore decimated tree species via resistance breeding, biocontrol, and other strategies. This bill is H.R. 1389.

The bill was introduced by Rep. Peter Welch of Vermont, who has been a solid ally and led on this issue for several years. As of August 2022, the bill has seven cosponsors, most from the Northeast: Rep. Mike Thompson [CA], Rep. Chellie Pingree [ME], Reps. Ann M. Kuster and Chris Pappas [NH], Rep. Elise Stefanik [NY], Rep. Deborah K. Ross [NC], Rep. Brian Fitzpatrick [PA].

Please write your Representative and Senators. Urge them to seek incorporation of H.R. 1389 in the 2023 Farm Bill. Also, ask them to become co-sponsors for the House or Senate bills. (Members of the key House and Senate Committees are listed below, along with supporting organizations and other details.)

Details of the Proposed Legislation

The Invasive Species Prevention and Forest Restoration Act [H.R. 1389]

  • Expands USDA APHIS’ access to emergency funding to combat invasive species when existing federal funds are insufficient and broadens the range of actives that these funds can support.
  • Establishes a grant program to support research on resistance breeding, biocontrol, and other methods to counter tree-killing introduced insects and pathogens.
  • Establishes a second grant program to support application of promising research findings from the first grant program, that is, entities that will grow large numbers of pest-resistant propagules, plant them in forests – and care for them so they survive and thrive.
  • [A successful restoration program requires both early-stage research to identify strategies and other scientists and institutions who can apply that learning; see how the fit together here.]
  • Mandates a study to identify actions needed to overcome the lack of centralization and prioritization of non-native insect and pathogen research and response within the federal government, and develop national strategies for saving tree species.

Incorporating the provisions of H.R. 1389 into the 2023 Farm Bill would boost USDA’s efforts to counter bioinvasion. As Carrera and colleagues and the Morton Arboretum study on which their paper is based demonstrate, our tree species desperately need stronger policies and more generous funding. Federal and state measures to prevent more non-native pathogen and insect pest introductions – and the funding to support this work – have been insufficient for years. New tree-killing pests continue to enter the country and make that deficit larger –see beech leaf disease here. Those here, spread – see emerald ash borer to Oregon.

For example, funding for the USDA Forest Service Forest Health Protection program has been cut by about 50%; funding for USFS Research projects that target 10 high-profile non-native pests has been cut by about 70%.

H.R. 1389 is endorsed by several organizations in the Northeast: Audubon Vermont, the Maine Woodland Owners Association, Massachusetts Forest Alliance, The Nature Conservancy Vermont, the New Hampshire Timberland Owners Association, Vermont Woodlands Association, and the Pennsylvania Forestry Association.

Also, major forest-related national organizations support the bill: The American Chestnut Foundation (TACF), American Forest Foundation, The Association of Consulting Foresters (ACF), Center for Invasive Species Prevention, Ecological Society of America, Entomological Society of America, National Alliance of Forest Owners (NAFO), National Association of State Foresters (NASF), National Woodland Owners Association (NWOA), North American Invasive Species Management Association (NAISMA), Reduce Risk from Invasive Species Coalition, The Society of American Foresters (SAF).

HOUSE AND SENATE AGRICULTURE COMMITTEE MEMBERS – BY STATE

STATEMember, House CommitteeMember, Senate CommitteeKey members * committee leadership # forestry subcommittee leadership @ cosponsor of H.R. 1389
AlabamaBarry Moore  
ArizonaTom O’Halleran  
ArkansasRick CrawfordJohn Boozman* 
CaliforniaJim Costa Salud Carbajal Ro Khanna Lou Correa Josh Harder Jimmie Panetta Doug LaMalfa  
Colorado Michael Bennet # 
ConnecticutJahana Hayes  
FloridaAl Lawson Kat Cammack  
GeorgiaDavid Scott * Sanford Bishop Austin Scott Rick AllenRaphael Warnock Tommy Tuberville 
IllinoisBobby Rush Cheri Bustos Rodney Davis Mary MillerRichard DurbinNote that the report was led by scientists at the Morton Arboretum – in Illinois!
IndianaJim BairdMike Braun 
IowaCindy Axne Randy FeenstraJoni Ernst Charles Grassley 
KansasSharice Davids Tracey MannRoger Marshall# 
Kentucky Mitch McConnell 
MaineChellie Pingree @  
MassachusettsJim McGovern  
Michigan Debbie Stabenow * 
MinnesotaAngie Craig Michelle FischbachAmy Klobuchar Tina Smith 
MississippiTrent KellyCindy Hyde-Smith 
MissouriVicky Hartzler  
NebraskaDon BaconDeb Fischer 
New HampshireAnn McLane Kuster @  
New Jersey Cory Booker 
New Mexico Ben Ray Lujan 
New YorkSean Patrick Maloney Chris JacobsKristen Gillibrand 
North CarolinaAlma Adams David Rouzer  
North Dakota John Hoeven 
OhioShontel Brown Marcy Kaptur Troy BaldersonSherrod Brown 
PennsylvaniaGlenn Thompson  
South DakotaDusty JohnsonJohn Thune 
TennesseeScott DesJarlais  
TexasMichael Cloud Mayra Flores  
Vermont Patrick Leahy 
VirginiaAbigail Spanberger #  
WashingtonKim Schreir  

SOURCES

Christina Carrero, et al. Data sharing for conservation: A standardized checklist of US native tree species and threat assessments to prioritize and coordinate action. Plants People Planet. 2022;1–17. wileyonlinelibrary.com/journal/ppp3

Washington Post: Sarah Kaplan, “As many as one in six U.S. tree species is threatened with extinction” https://www.washingtonpost.com/climate-environment/2022/08/23/extinct-tree-species-sequoias/

Popkin, G. “Up to 135 tree species face extinction—and just eight enjoy federal protection”, Science August 25, 2022. https://www.science.org/content/article/135-u-s-tree-species-face-extinction-and-just-eight-enjoy-federal-protection

Posted by Faith Campbell

We welcome comments that supplement or correct factual information, suggest new approaches, or promote thoughtful consideration. We post comments that disagree with us — but not those we judge to be not civil or inflammatory.

For a detailed discussion of the policies and practices that have allowed these pests to enter and spread – and that do not promote effective restoration strategies – review the Fading Forests report at http://treeimprovement.utk.edu/FadingForests.htm

or

www.fadingforests.org

Firewood – How to Change Risky Behavior

The Nature Conservancy (TNC) and Clemson University have analyzed how to persuade people not to move firewood – and the tree pests that can accompany it. (Full citation at the end of this blog) Their study is based on five surveys conducted by TNC between 2005 and 2016. These surveys guided TNC’s “Don’t Move Firewood” campaign and its outreach efforts since the beginning in 2008

As Solano et al. note, wood-boring pests continue to enter the country and spread, causing immense damage. Firewood transport by campers is a significant contributor to that spread. Millions of individuals decide whether to move firewood. Yet the scientific literature is quite limited regarding their behavior and TNC’s survey data has never been published.

The patchwork of state and federal quarantines is largely reactive and has failed to prevent continuing spread. The regulatory regime has been further fragmented by APHIS’ deregulation of the emerald ash borer.  As a consequence, limiting the spread of pests depends even more on educating campers to behave responsibly – voluntarily.

The TNC’s surveys each focused on different geographic areas and asked different questions in each. So their compilation cannot show trends in awareness or other measures. Nevertheless, the authors find:

  • Most people in the United States don’t know firewood can harbor invasive forest insects and diseases, but when targeted by effective education they can learn and are likely to change their behavior.
  • The two best ways to reach the public is through emails confirming campsite reservations and flyers handed out at parks. Web-based information seemed less effective. However, most of the surveys were done before 2011, the year when 50% of adults reported using internet media.
  • Forestry-related public agencies (especially state forestry departments) are the most trusted sources of information about forest health issues.
  • It works better to “push” information, not expect people to seek it on their own.
  • Messages should focus on encouraging the public to make better choices, including how they, themselves, will benefit. Positive, empowering calls to action, like “Buy it Where You Burn It” or “Buy Local, Burn Local” are better than negative messages, such as “Don’t Move Firewood”.
  • People respond to messages that emphasize protecting forest resources, e.g., ecosystem services like clean water. They response less to messages about forest threats.
Hungerford Lake Recreation Area at Equestrian Campground. Original public domain image from Flickr

Solano et al. describe the ways that different socioeconomic groups differ in their awareness of forest pests and in how they respond to various statements about forests, pests, and messengers. The focus is on how to overcome four psychological barriers to changing behavior that had been identified in a study of climate change. In the firewood context, those barriers were: 1) lack of awareness; 2) mistrust and negative reactions to the messengers; 3) habit; and 4) social comparison, norms, conformity, and perceived poor quality of purchased firewood.

From this work, the authors suggested further work::

  • Development of education and outreach programs that target those with lower education levels, since, on average, ~60% of people who camp did not graduate from college. Further research is probably needed to identify the most effective messengers and messages.
  • While 80% of the survey respondents were over 40, the proportion of campers made up of Gen X and millennials is increasing. Managers need to improve outreach for younger audiences. This includes engaging the messengers they trust: scientists, environmentalist politicians, peer networks, and social media.
  • While women trust the USDA Forest Service and conservation organizations, 55% of campers in a given year are men. Further research is needed to clarify the most effective messengers and messages for men. The outreach agencies should select the messengers that both sexes trust. 
  • Levels of awareness should be assessed both before and after implementing new educational strategies so that the strategies’ effectiveness can be determined.

Since 80% of the respondents were white, determining the most effective messages and messengers for other ethnic groups also seems necessary, although the authors did not address this.

SOURCE:

Solano, A., Rodriguez, S.L., Greenwood, L., Rosopa, P.J., and Coyle, D.R. 2022. Achieving effective outreach for invasive species: firewood case studies from 2005-2016. Biological Invasions.
https://link.springer.com/article/10.1007/s10530-022-02848-w

You can read the article – but not download it – at https://rdcu.be/cRRVH 

To request a copy of this study from the author, contact the lead author at Clemson University.

Posted by Faith Campbell

We welcome comments that supplement or correct factual information, suggest new approaches, or promote thoughtful consideration. We post comments that disagree with us — but not those we judge to be not civil or inflammatory.

For a detailed discussion of the policies and practices that have allowed these pests to enter and spread – and that do not promote effective restoration strategies – review the Fading Forests report at http://treeimprovement.utk.edu/FadingForests.htm

or

www.fadingforests.org

Invasive Species Costs Point to Inadequate Effort – especially Prevention

EAB-killed ash tree falls before it can be taken down; photo courtesy of former Ann Arbor mayor John Hieftje

Concerned by growing impacts of bioinvasion and inadequate responses by national governments worldwide and by international bodies, a group of experts have attempted to determine how much invasive species are costing. They’ve built the global database – InvaCost. See Daigne et al. 2020 here.

Several studies have been based on these data. In two earlier blogs, I summarized two of these articles, e.g., Cuthbert et al. on bioinvasion costs, generally, and Moodley et al. on invasive species costs in protected areas, specifically. Here, I look at two additional studies. Ahmed et al. focusses on the “worst” 100 invasives affecting conservation — as determined by the International Union of Conservation and Nature (IUCN). The second, by Turbelin et al., examines pathways of introduction. Full citations of all sources appear at the end of this blog.

It is clear from all of these papers that the authors (and I!) are frustrated by the laxity with which virtually all governments respond to bioinvasions. Thus more robust actions are needed. The authors and I also agree that data on economic costs influence political decision-makers more than ecological concerns. However, InvaCost – while the best source in existence — is not yet comprehensive enough to generate the thoroughly-documented economic data about specific aspects of bioinvasion that would be most useful in supporting proposed strategies.

Scientists working with InvaCost recognize that the data are patchy. At the top level, these data demonstrate high losses and management costs imposed by bioinvasion. The global total – including both realized damage and management costs – is estimated at about $1.5 trillion since 1960. In fact, these overall costs are probably substantially underestimates (Cathbert et al.). [For a summary of data gaps, go to the end of the blog.] Furthermore, they recognize that species imposing the highest economic costs might not cause the greatest ecological harm (Moodley et al).

citrus longhorned beetle exit hole in bonsai tree; USDA APHIS photo

Comparing estimated management costs to estimated damage, the authors conclude that countries invest too little in bioinvasion management efforts and — furthermore — that expenditures are squandered on the wrong “end” of bioinvasion – after introduction and even establishment, rather than in preventive efforts or rapid response upon initial detection of an invader. While I think this is true, these findings might be skewed by the fact that fewer than a third of countries reporting invasive species costs included data on specifically preventive actions. Cuthbert et al. notes that failing to try to prevent introductions imposes an avoidable burden on resource management agencies. Ahmed et al. developed a model they hope will overcome the perverse   incentives that lead decision-makers to either do nothing or delay.

  1. Why Decision-Makers Delay

Citing the InvaCost data, the participating experts reiterate the long-standing call for prioritizing investments at the earliest possible invasion stage. Ahmed et al. found that this was the most effective practice even when costs accrue slowly. They ask, then, why decision-makers often delay initiating management. I welcome this attention because we need to find ways to rectify this situation.

They conclude, first, that invasive species threats compete for resources with other threats to agriculture and natural systems. Second, Cuthbert et al. and Ahmed et al. both note that decision-makers find it difficult to justify expenditures before impacts are obvious and/or stakeholders demand action. By that time, of course, management of invasions are extremely difficult and expensive – if possible at all. I appreciate the wording in Ahmed et al.: bioinvasion costs can be deceitfully slow to accrue, so policy makers don’t appreciate the urgency of taking action.

Cuthbert et al. also note that impacts are often imposed on other sectors, or in different regions, than those focused on by the decision-makers. Stakeholders’ perceptions of whether an introduced species is causing a “detrimental” impact also vary. Finally, when efficient proactive management succeeds – prevents any impact – it paradoxically undermines evidence of the value of this action!

Ahmed et al. point out that in many cases, biosecurity measures and other proactive approaches are even more cost effective when several species are managed simultaneously. They cite as examples airport quarantine and interception programs; Check Clean Dry campaigns encouraging boaters to avoid moving mussels and weeds; ballast water treatment systems; and transport legislation e.g., the international standard for wood packaging (ISPM#15) [I have often discussed the weaknesses in ISPM#15 implementation; go to “wood packaging” under “Categories” (below the archive list)].

pallet “graveyard”; photo by Anand Prasad
  • Pathways of Species’ Introduction

Tuberlin et al. focus on pathways of introduction, which they say influence the numbers of invaders, the frequency of their arrival, and the geography of their eventual distribution. This study found sufficient data to analyze arrival pathways of 478 species – just 0.03% of the ~14,000 species in the full database. They found that intentional pathways – especially what they categorized as “Escape” – were responsible for the largest number of invasive species (>40% of total). On the other hand, the two unintentional pathways called “Stowaway” and “Contaminant” introduced the species causing the highest economic costs.

Tuberlin et al. therefore emphasize the importance of managing these unintentional pathways. Also, climate change and emerging shipping technologies will increase potential invaders’ survivability during transit. Management strategies thus must be adapted to countering these additive trends. They suggest specifically:

  • eDNA detection techniques;
  • Stricter enforcement of ISPM#15 and exploring use of recyclable plastic pallets (e.g., IKEA’s OptiLedge); [see my blog re: plastic pallets, here]
  • Application of fouling-resistant paints to ship hulls;
  • Prompt adoption of international agreements addressing pathways (they cite the Ballast Water Management Treaty as entered into force only in 2017 — 13 years after adoption);
  • Ensuring ‘pest free status’ (per ISPM#10) before allowing export of goods—especially goods in the “Agriculture”, “Horticulture”, and “Ornamental” trades; and
  • Increasing training of interception staff at ports.

What InvaCost Data say re: Taxa of greatest concern to me

Two-thirds of reported expenditures are spent on terrestrial species (Cuthbert et al.). Insects as a Class constitute the highest number of species introduced as ‘Contaminants’ (n = 74) and ‘Stowaways’ (n = 43). They also impose the highest costs among species using these pathways. Forest insects and pathogens account for less than 1% of the records in the InvaCost database, but constitute 25% of total annual costs ($43.4 billion) (Williams et al., in prep.). Indeed, one of 10 species for which reported spending on post-invasion management is highest is the infamous Asian longhorned beetle (Tuberlin et al.)

ALB pupa in wood packaging; Pennsylvania Dept. of Natural Resources via Bugwood

Mammals and plants are often introduced deliberately – either as intentional releases or as escapes. Plant invasions are reported as numerous but impose lower costs.

Tuberlin et al. state that intentional releases and escapes should in theory be more straightforward to monitor and control, so less costly. They propose two theories: 1) Eradication campaigns are more likely to succeed for plants introduced for cultivation and subsequently escaped, than for plants introduced through unintentional pathways in semi-natural environments. 2) Species introduced unintentionally may be able to spread undetected for longer; they expect that better measures already exist to control invasions by deliberate introductions. I question both. Their theories ignore that constituencies probably like the introduced plants … and the near absence of attention to the possible need to control their spread. This is odd because elsewhere they recognize conflicts over whether to control or eradicate “charismatic” species.

Geographies of greatest concern to me

  • North America reported spending 54% of the total expenditure in InvaCost. Oceania spent 30%. The remaining regions each spent less than $5 billion. (Cuthbert et al.)
  • North America funded preventative actions most generously than other regions. Cuthbert suggests this was because David Pimentel published an early estimate of invasive species costs. I doubt it. The Lacey Act was adopted in 1905. USDA APHIS was formed in 1972 – based on predecessor agencies — because officials recognized the damage by non-native pests to agriculture. APHIS began addressing natural area pests with discovery of the Asian longhorned beetle in 1996. Of course, most of APHIS’ budget is still allocated to agricultural pests. I conclude that North America’s lead in this area has not resulted in adequate prevention programs.
Oregon ash swamp before attack by EAB (photo by Wyatt Williams, Oregon Dept. of Forestry)

Equity Issues

Tuberlin et al and Moodley et al. address equity issues of who causes introductions vs. who is impacted. This is long overdue.

  • More than 80% of bioinvasion management costs in protected areas fell on governmental services and/or official organizations (e.g. conservation agencies, forest services, or associations). With the partial exception of the agricultural sector, the economic sectors that contribute the most to movement of invasive species are spared from carrying the resulting costs (Moodley et al.)
  • A lack of willingness to invest might represent a moral problem when the invader’s impacts are incurred by regions, sectors, or generations other than those that on whom management action falls (Ahmed et al.)
  • People are perhaps more inclined to spend money to mitigate impacts that cause economic losses than those that damage ecosystems (Tuberlin et al.)

Data deficiencies

  • Only 41% of countries (83 out of 204) reported management costs; of those, only 24 reported costs specifically associated with pre-invasion (prevention) efforts (Cuthbert et al.).
  • Reliable economic cost estimates were available for only 60% of the “worst” invasive species (Cuthbert et al.)
  • Only 55 out of 266,561 protected areas reported losses or management costs (Moodley et al.).
  • Information on pathways of introduction was available for only three species out of 10,000 (Turbelin et al).
  • Taxonomic and geographic biases in reporting skew examples and possibly conclusions (Cuthbert et al.).

SOURCES

Ahmed, D.A., E.J. Hudgins, R.N. Cuthbert, .M. Kourantidou, C. Diagne, P.J. Haubrock, B. Leung, C. Liu, B. Leroy, S. Petrovskii, A. Beidas, F. Courchamp. 2022. Managing biological invasions: the cost of inaction. Biol Invasions (2022) 24:1927–1946 https://doi.org/10.1007/s10530-022-02755-0

Cuthbert, R.N., C. Diagne, E.J. Hudgins, A. Turbelin, D.A. Ahmed, C. Albert, T.W. Bodey, E. Briski, F. Essl, P. J. Haubrock, R.E. Gozlan, N. Kirichenko, M. Kourantidou, A.M. Kramer, F. Courchamp. 2022. Bioinvasion costs reveal insufficient proactive management worldwide. Science of The Total Environment Volume 819, 1 May 2022, 153404

Moodley, D., E. Angulo, R.N. Cuthbert, B. Leung, A. Turbelin, A. Novoa, M. Kourantidou, G. Heringer, P.J. Haubrock, D. Renault, M. Robuchon, J. Fantle-Lepczyk, F. Courchamp, C. Diagne. 2022. Surprisingly high economic costs of bioinvasions in protected areas. Biol Invasions. https://doi.org/10.1007/s10530-022-02732-7

Turbelin, A.J., C. Diagne, E.J. Hudgins, D. Moodley, M. Kourantidou, A. Novoa, P.J. Haubrock, C. Bernery, R.E. Gozlan, R.A. Francis, F. Courchamp. 2022. Introduction pathways of economically costly invasive alien species. Biol Invasions (2022) 24:2061–2079 https://doi.org/10.1007/s10530-022-02796-5

Williams, G.M., M.D. Ginzel, Z. Ma, D.C. Adams, F.T. Campbell, G.M. Lovett, M. Belén Pildain, K.F. Raffa, K.J.K. Gandhi, A. Santini, R.A. Sniezko, M.J. Wingfield, and P. Bonello 2022. The Global Forest Health Crisis: A Public Good Social Dilemma in Need of International Collective Action. Submitted

Posted by Faith Campbell

We welcome comments that supplement or correct factual information, suggest new approaches, or promote thoughtful consideration. We post comments that disagree with us — but not those we judge to be not civil or inflammatory.

For a detailed discussion of the policies and practices that have allowed these pests to enter and spread – and that do not promote effective restoration strategies – review the Fading Forests report at http://treeimprovement.utk.edu/FadingForests.htm

or

www.fadingforests.org