Australia Builds Capacity to Address Forest Pests

Australian Eucalypts; photo by John Turnbull via Flickr

I congratulate Australian scientists for bringing about substantial improvements of their country’s biosecurity program for forest pests. While it is too early to know how effective the changes will be in preventing new introductions, they are promising. What can we Americans learn from the Australian efforts? [I have previously praised South Africa’s efforts – there is much to learn there, too.]

Australia has a reputation of being very active in managing the invasive species threat. However, until recently biosecurity programs targetting forest pests were minimal and ad hoc. Scientists spent 30 years trying to close those gaps (Carnegie et al. 2022). Their efforts included publishing several reports or publications (listed at the end of the blog) and an international webinar on myrtle rust. Scientists are hopeful that the new early detection program (described below) will greatly enhance forest protection. However, thorough pest risk assessments are still not routinely conducted for forest pests. (Nahrung and Carnegie 2022).

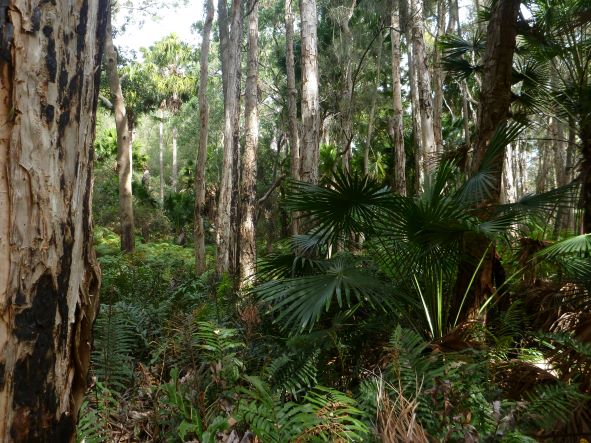
The native flora of Australia is unique. That uniqueness has provided protection because fewer of the non-native insects and pathogens familiar to us in the Northern Hemisphere have found suitable hosts (Nahrung and Carnegie 2020). Also – I would argue – the uniqueness of this flora imposes a special responsibility to protect it from threats that do arise.

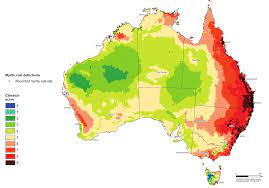
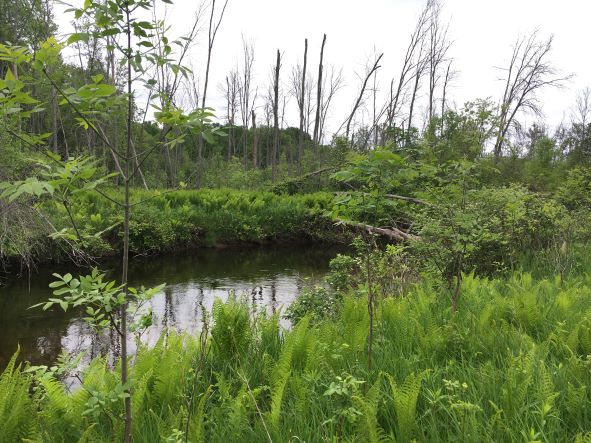
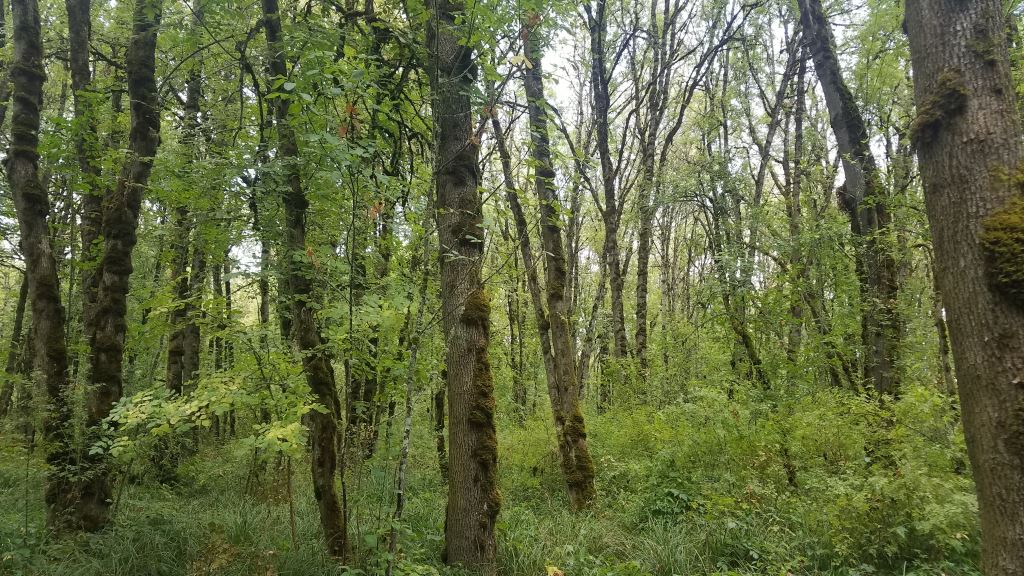
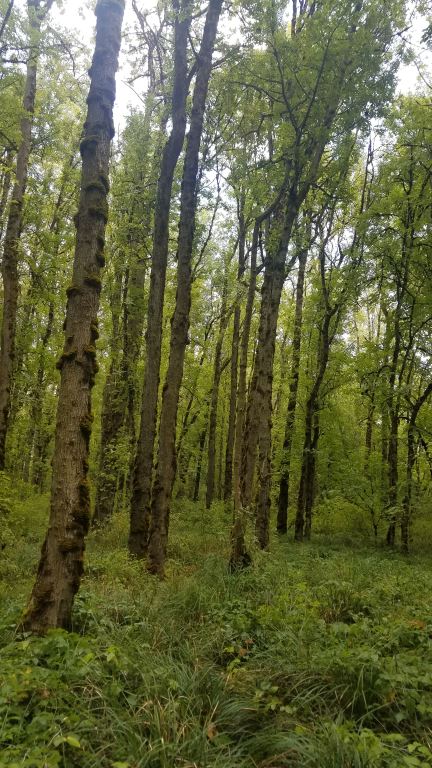
Only 17% of Australia’s landmass is covered by forests. Australia is large, however; consequently, these forests cover 134 million hectares (Nahrung and Carnegie 2020). This is the 7th largest forest estate in the world (Carnegie et al. 2022).

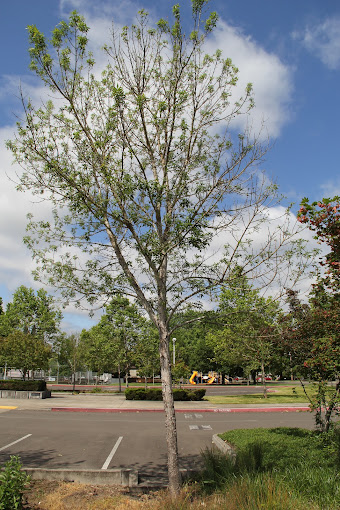
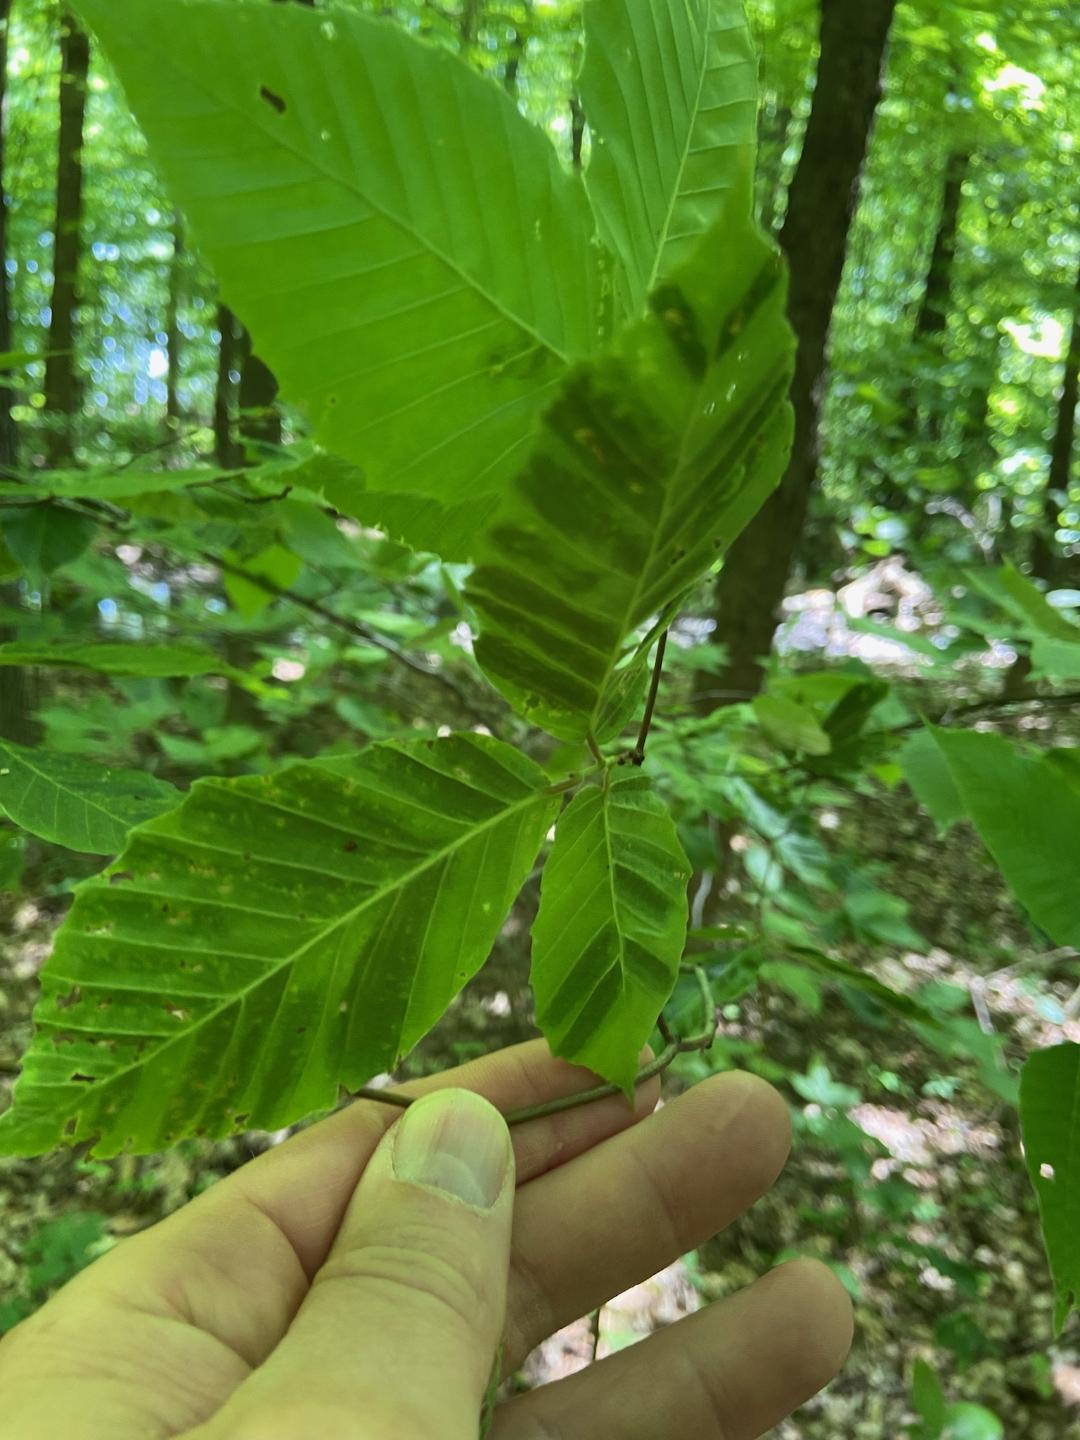
Australia’s forests are dominated by eucalypts (Eucalyptus, Corymbia and Angophora). These cover 101 million ha; or 75% of the forest). Acacia (11 million ha; 8%); and Melaleuca (6 million ha) are also significant. The forest also includes one million ha of plantations dominated by Pinus species native to North America (Carnegie et al. 2022). A wide range of native and exotic genera have been planted as amenity trees in urban and peri-urban areas, including pines, sycamores, poplars, oaks, and elms (Carnegie et al. 2022). These urban trees are highly valued for their ecosystem services as well as social, cultural, and property values (Nahrung and Carnegie 2020). Of course, these exotic trees can support establishment and spread of the forest pest species familiar to us in the Northern Hemisphere. On the positive side, they can also be used as sentinel plantings for early detection of non-native species (Carnegie et al. 2022 and Nahrung and Carnegie 2020).

Despite Australia’s geographic isolation, its unique native flora, and what is widely considered to be one of the world’s most robust biosecurity system, at least 260 non-native arthropods and pathogens of forests have established in Australia since 1885 (Nahrung and Carnegie 2020). [(This number is about half the number of non-native forest insects and pathogens that have established in the United States over a period just 25 years longer (Aukema et al. 2010).] As I noted, forest scientists have cited these introductions as a reason to strengthen Australia’s biosecurity system specifically as it applies to forest pests.

What steps have been taken to address this onslaught? For which pests? With what impacts? What gaps have been identified?

Which Pests?

Nahrung and Carnegie (2020) compiled the first comprehensive database of tree and forest pests established in Australia. The 260 species of non-native forest insect pests and pathogens comprise 143 arthropods, 117 pathogens. Nineteen of them (17 insects and 2 fungal species) had been detected before 1900. These species have accumulated at an overall rate of 1.9 species per year; the rate of accumulation after 1955 is slightly higher than during the earlier period, but it has not grown at the exponential rate of import volumes.

While over the entire period insects and pathogens were detected at an almost equal rate (insects at 1.1/year; pathogens at 0.9/year), this disguises an interesting disparity: half of the arthropods were detected before 1940; half of the pathogens after 1960 (Nahrung and Carnegie (2020). By 2022, Nahrung and Carnegie (2022) said that, on average, one new forest insect is introduced each year. Some of these recently detected organisms have probably been established for years. More robust surveillance has  just detected them recently. I have blogged often about an apparent explosion of pathogens being transported globally in recent decades.

In a more recent article (Nahrung and Carnegie, 2022), gave 135 as the number of non-native forest insect pests. The authors don’t explain why this differs from the 143 arthropods listed before.

damage to pine plantations caused by Sirex noctilio; photo courtesy of Helen Nahrung

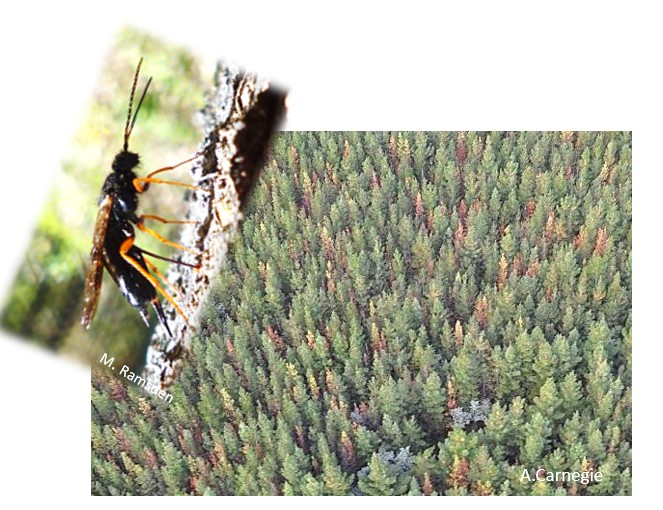
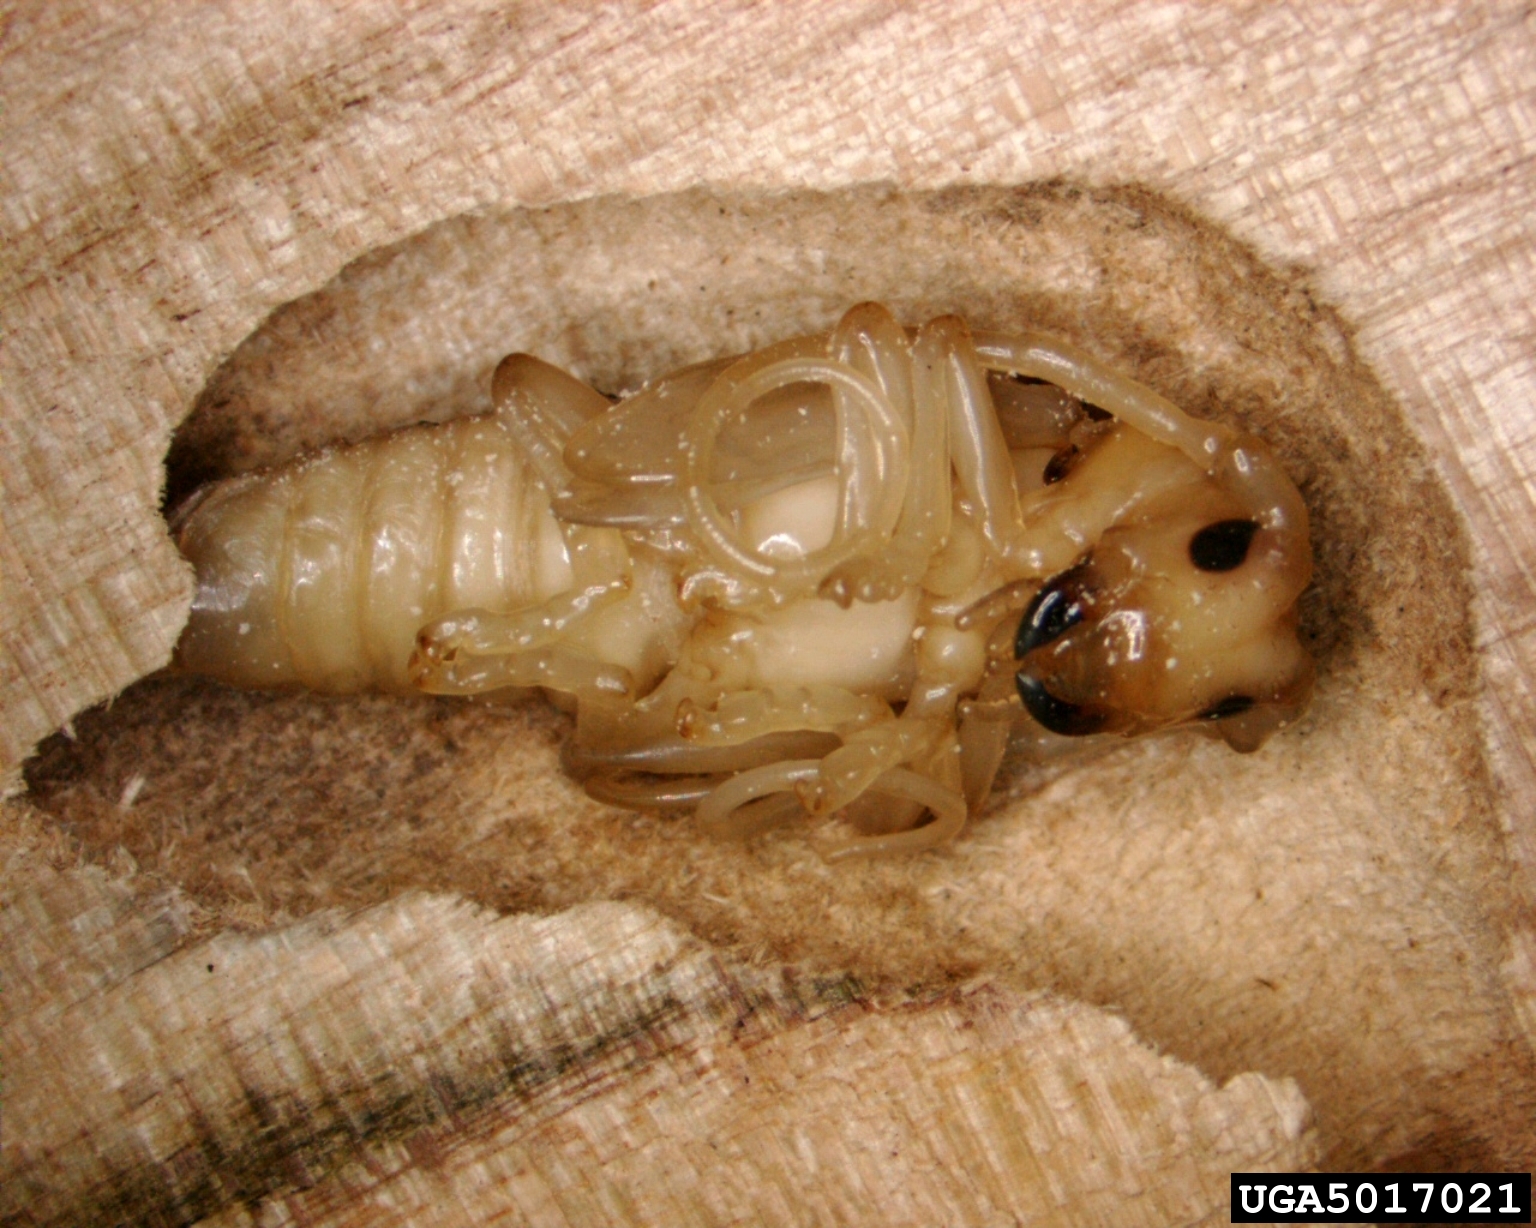
Eighty-seven percent of the established alien arthropods are associated with non-native hosts (e.g., Pinus, Platanus, Populus, Quercus, Ulmus) (Carnegie et al. 2022). Some of these have escaped eradication attempts and caused financial impact to commercial plantations (e.g., sirex wood wasp, Sirex noctilio) and amenity forests (e.g., elm leaf beetle, Xanthogaleruca luteola) (Carnegie and Nahrung 2019).

About 40% of the alien arthropods were largely cosmopolitan at the time of their introduction in Australia (Carnegie et al. 2022). Only six insects and six fungal species are not recorded as invasive elsewhere (Nahrung and Carnegie 2020). Of the species not yet established, 91% of interceptions from 2003 to- 2016 were known to be invasive elsewhere. There is strong evidence of the bridgehead effect: 95% of interceptions of three species were from their invaded range (Nahrung and Carnegie 2022). These included most of the insects detected in shipments from North America, Europe and New Zealand. These ubiquitous “superinvaders” have been circulating in trade for decades and continue to be intercepted at Australia’s borders. This situation suggests that higher interception rates of these species reflect their invasion success rather than predict it (Nahrung and Carnegie 2021).  

I find it alarming that most species detected in shipments from Africa, South America, and New Zealand were of species not even recorded as established in those regions (Nahrung and Carnegie 2021; Nahrung and Carnegie 2022).

Arhopalus ferus, a Eurasian pine insect often detected in wood from New Zealand; photo by Jon Sullivan – in New Zealand; via Flickr

Half of the alien forest pests established in Australia are highly polyphagous. This includes 73% of Asian-origin pests but only 15% of those from Europe (Nahrung and Carnegie 2021). Nahrung and Carnegie (2022) confirm that polyphagous species are more likely to be detected during border inspections.

PATHWAYS

As in North America and Europe, introductions of Hemiptera are overwhelmingly (98%) associated with fresh plant material (e.g. nursery stock, fruit, foliage). Coleoptera introductions are predominantly (64%) associated with wood (e.g. packaging, timber, furniture, and artefacts). Both pathways are subject to strict regulations by Australia (Nahrung and Carnegie 2021).

Eradication of High-Priority Pests

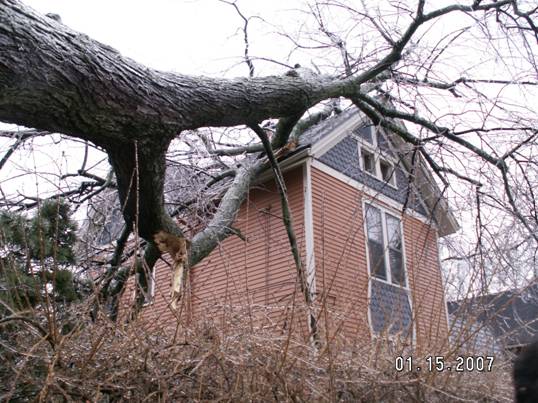
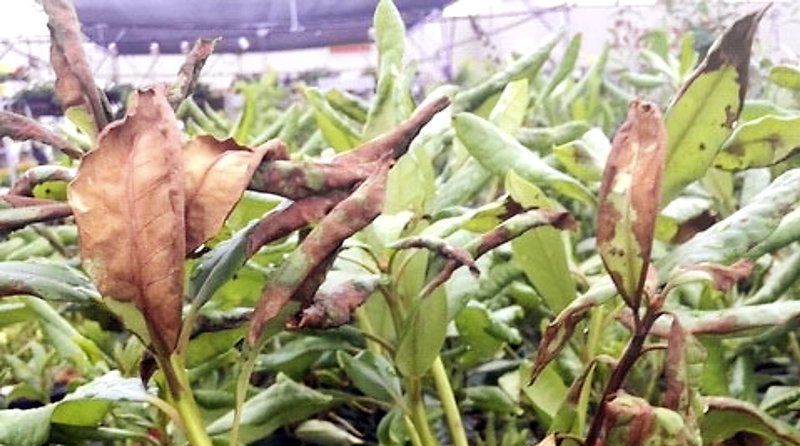
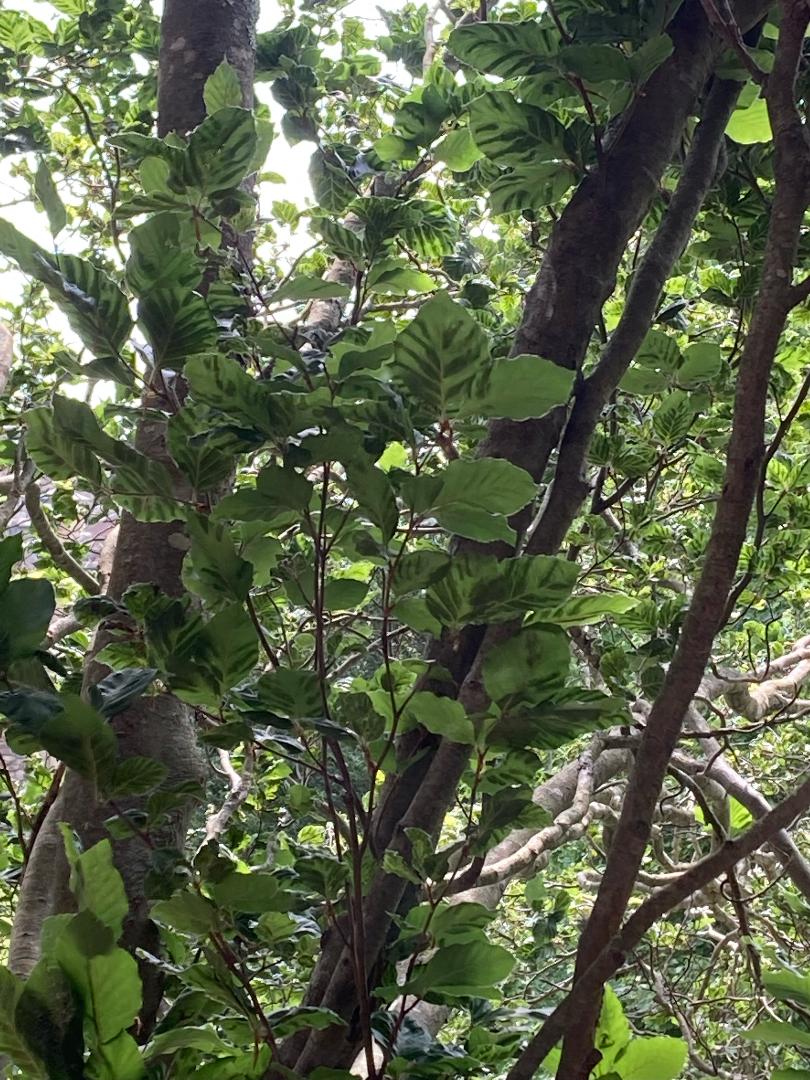
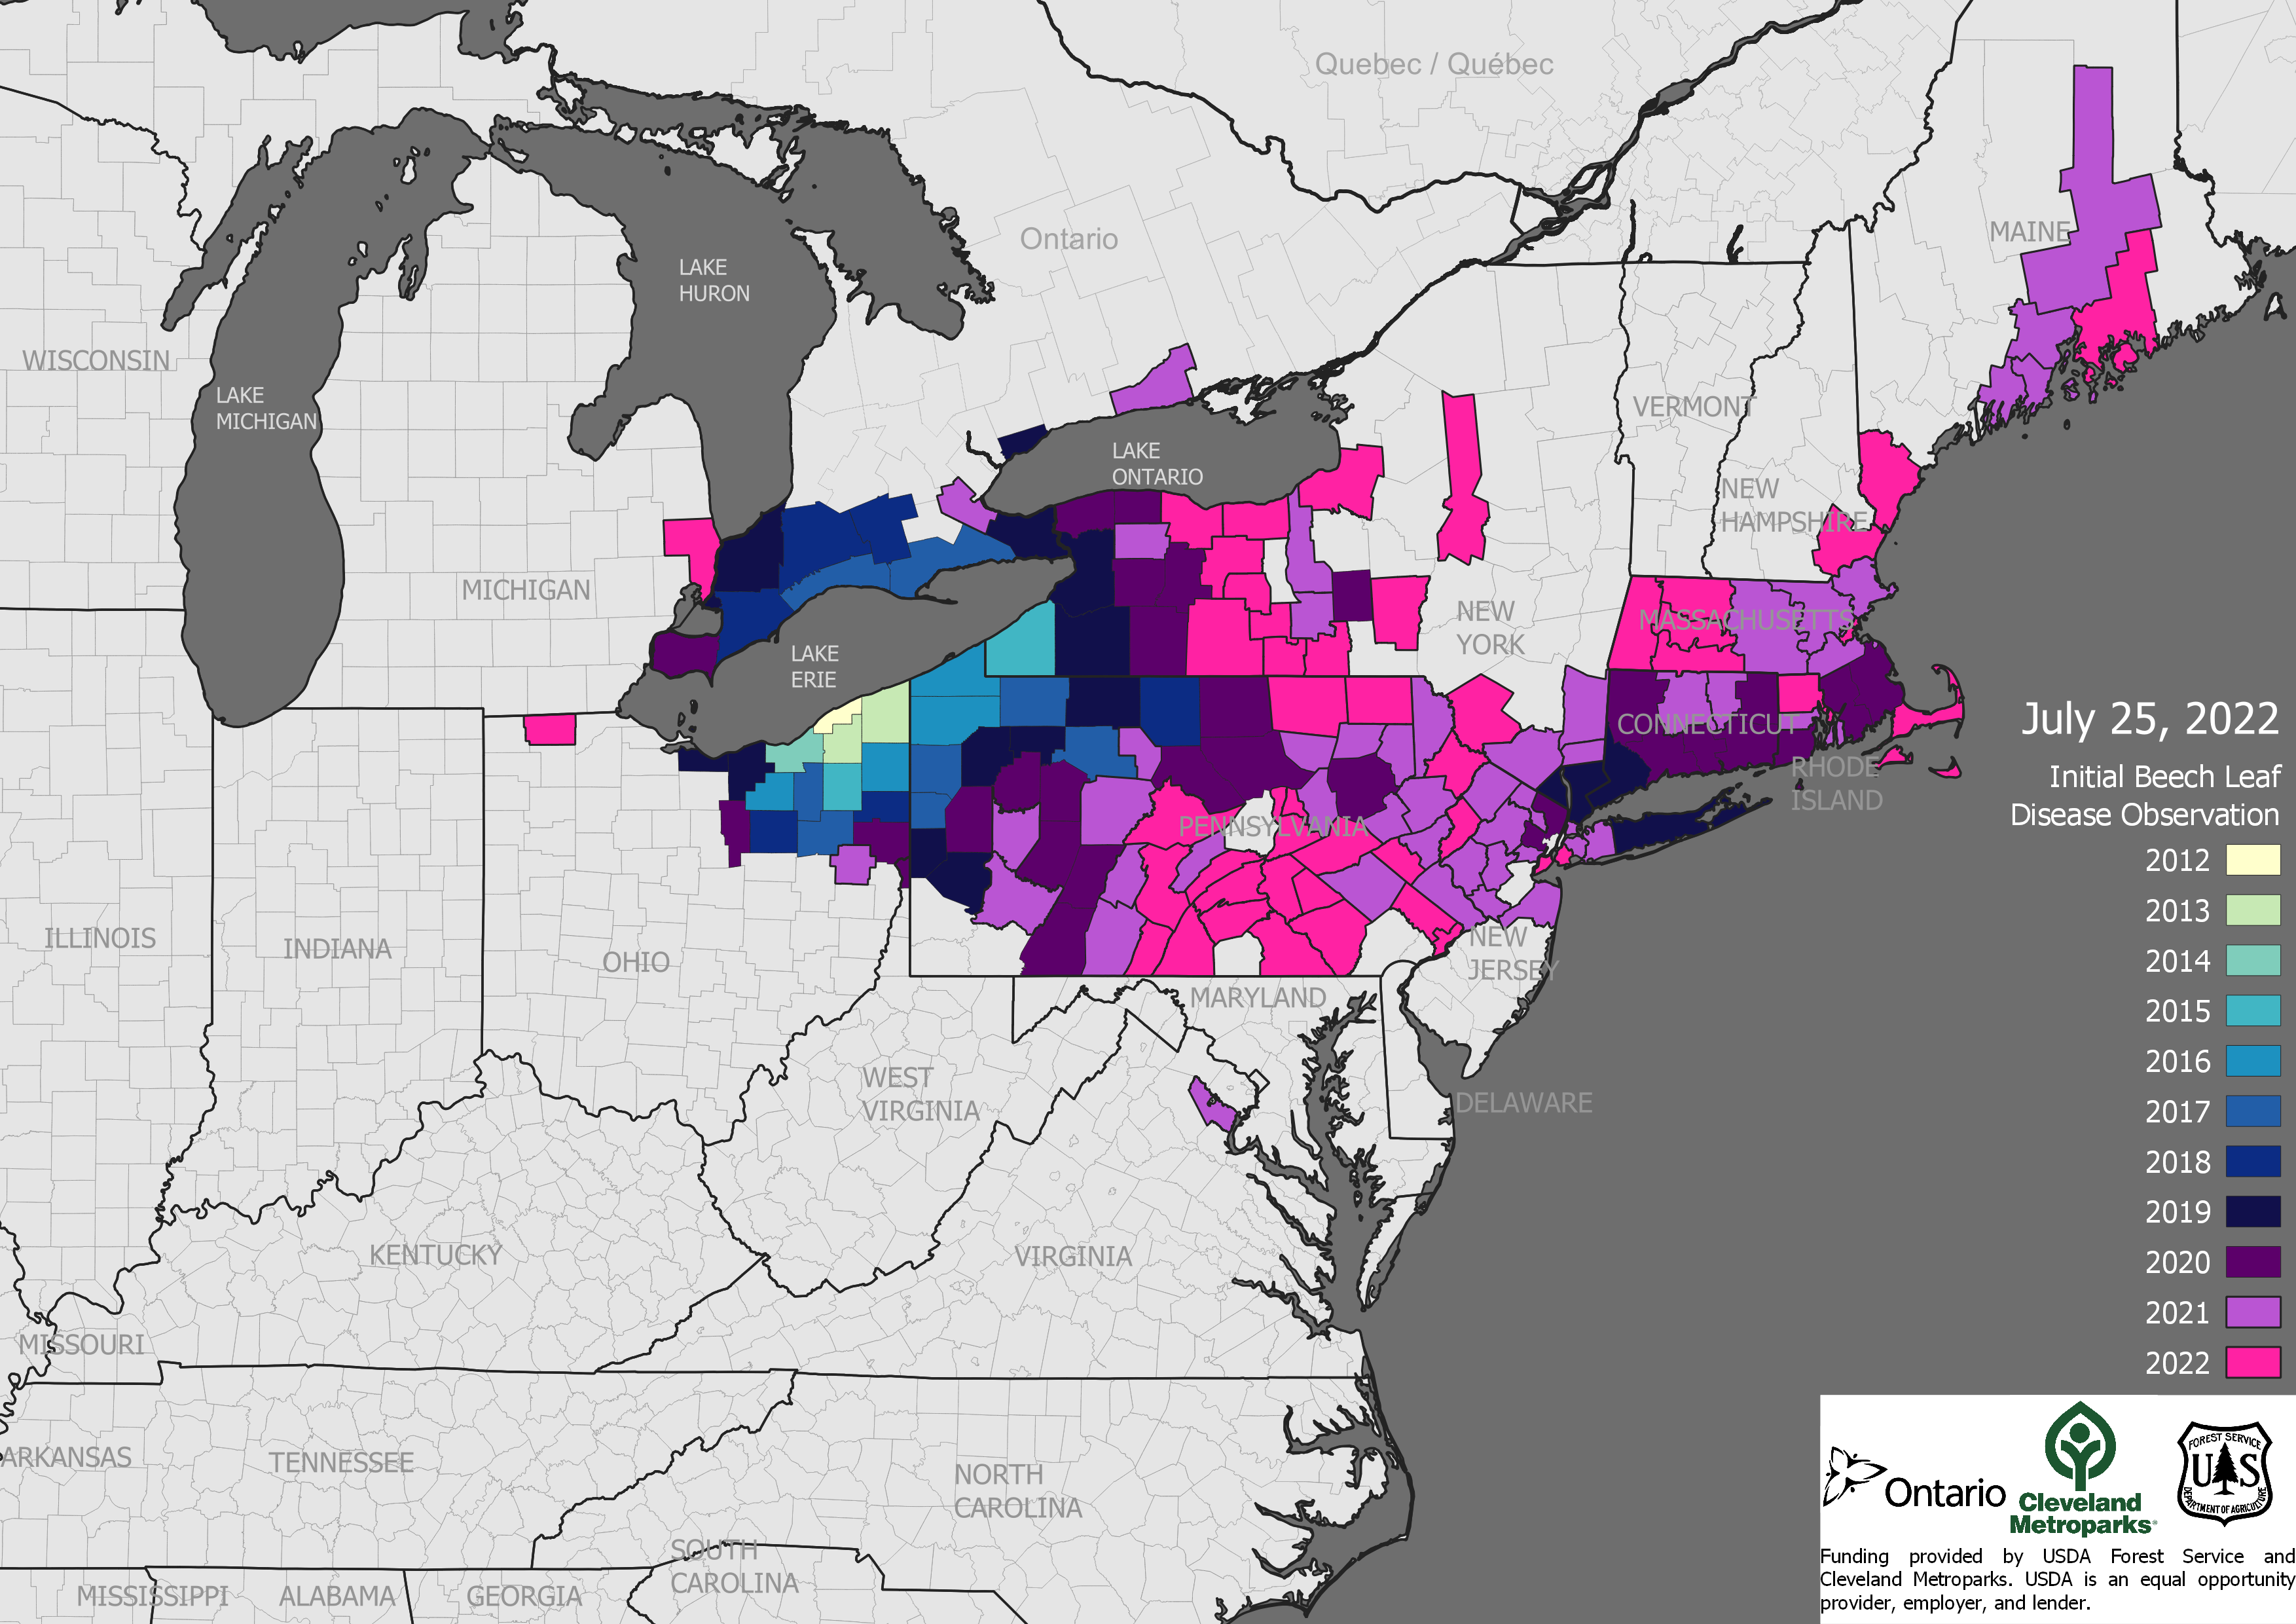
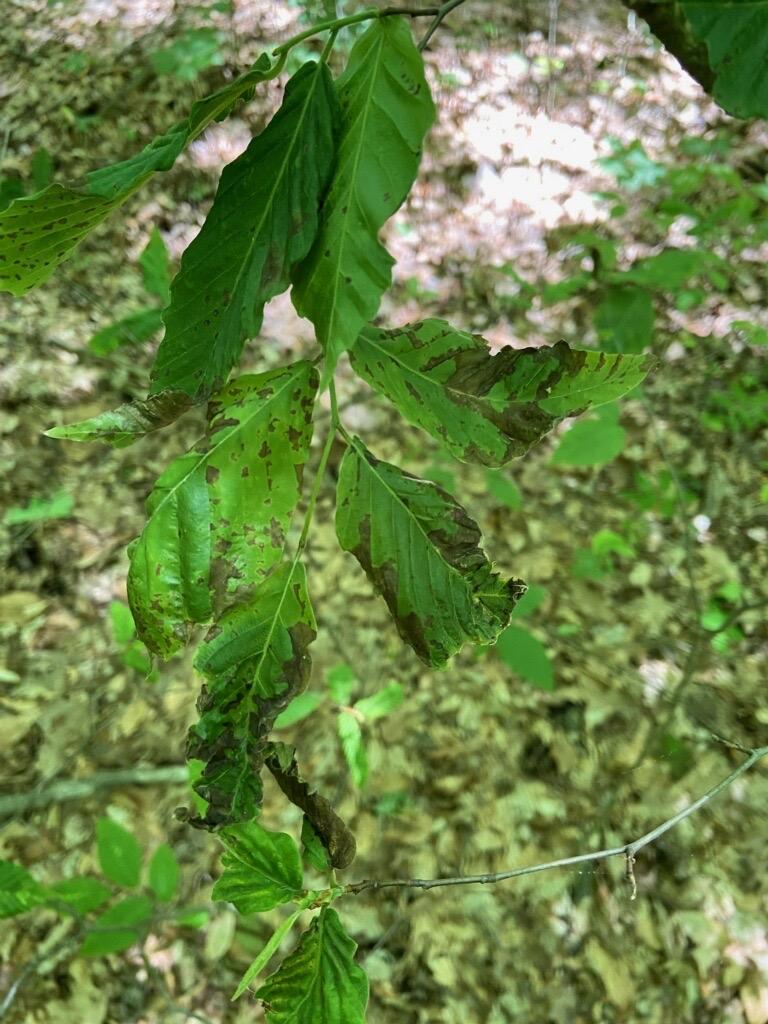
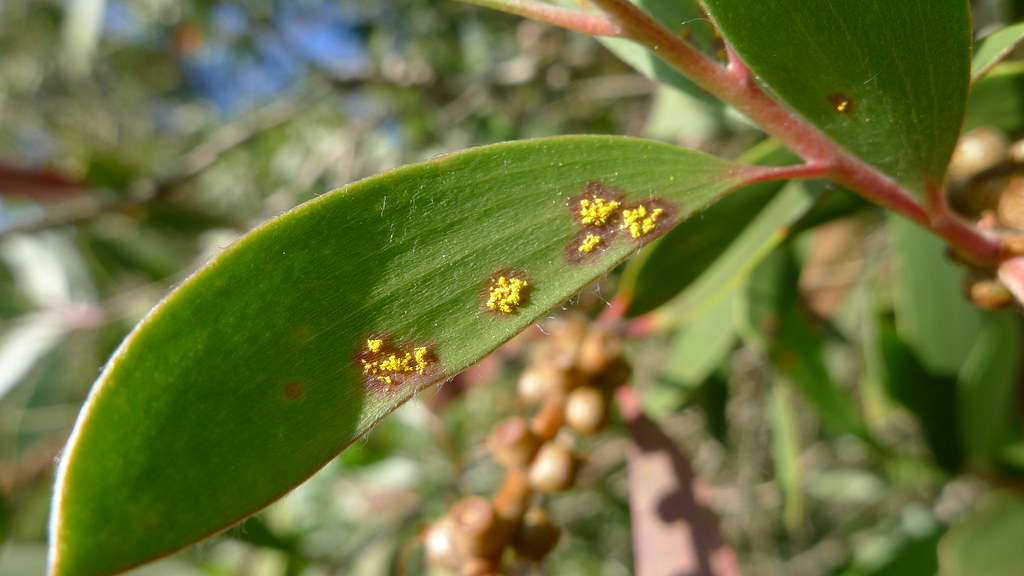
Eight-five percent of all new detections were not considered high-priority risks. Of the four that were, two had not previously been recognized as threats (Carnegie and Nahrung 2019). One high-priority pest – expected to pose a severe threat to at least some of Australia’s endemic plant species – is myrtle rust, Austropuccinia psidii. Despite this designation, when the rust appeared in Australia in 2010, the response was confused and ended in an early decision that eradication was impossible.  Myrtle rust has now spread along the continent’s east coast, with localized distribution in Victoria, Tasmania, the Northern Territory, and – in 2022, Western Australia.   `

Melaleuca quinquenervia forest; photo by Doug Beckers via Wikimedia

There have been significant impacts to native plant communities. Several reviews of the emergency response criticized the haste with which the initial decision was made to end eradication (Carnegie and Nahrung 2019). (A review of these impacts is here; unfortunately, it is behind a paywall.)

A second newly introduced species has been recognized as a significant threat, but only after its introduction to offshore islands. This is Erythina gall wasp Quadrastichus erythrinae (Carnegie and Nahrung 2019). DMF Although Australia is home to at least one native species in the Erythrina genus, E. vespertilio,, the gall wasp is not included on the environmental pest watch list.

Four of the recently detected species were considered to be high impact. Therefore eradication was attempted. Unfortunately, these attempts failed in three cases. The single success involved a pinewood nematode, Bursaphelenchus hunanesis. See Nahrung and Carnegie (2021) for a discussion of the reasons. This means three species recognized as high-impact pests have established in Australia over 15 years (Nahrung and Carnegie (2021). In fact, Australia’s record of successful forest pest eradications is only half the global average (Carnegie and Nahrung (2019).

Carnegie and Nahrung (2019) conclude that improving early detection strategies is key to increasing the likelihood of eradication. They discuss the strengths and weaknesses of various strategies. Non-officials (citizen scientists) reported 59% of the 260 forest pests detected (Carnegie and Nahrung 2019). Few alien pests have been detected by official surveillance (Carnegie et al 2022). However, managing citizen scientists’ reports involves a significant workload. Futhermore, surveillance by industry, while appreciated, is likely to detect only established species (Carnegie and Nahrung 2019).

Interception Frequency Is Not an Indicator of Likelihood of Establishment

Nahrung & Carnegie (2021) document that taxonomic groups already established in Australia are rarely detected at the border. Furthermore, only two species were intercepted before they were discovered to be established in Australia.

Indeed, 76% of species established in Australia were either never or rarely intercepted at the border. While more Hemiptera species are established in Australia, significantly more species of Coleoptera are intercepted at the border. Among beetles, the most-intercepted family is Bostrichid borers (powderpost beetles). Over the period 2003 – 2016, Bostrichid beetles made up 82% of interceptions in wood packaging and 44% in wood products (Nahrung and Carnegie 2022). This beetle family is not considered a quarantine concern by either Australian or American phytosanitary officials. I believe USDA APHIS does not even bother recording detections of powderpost beetles. Nahrung and Carnegie (2021) think the high proportion of Bostrichids might be partially explained by intense inspection of baggage, mail, and personal effects. While Australia actively instructs travelers not to bring in fruits and vegetables because of the pest risk, there are fewer warnings about risks associated with wood products. 

Nahrung & Carnegie (2021) concluded that interception frequencies did not provide a good overall indicator of likelihood of risk of contemporaneous establishment.

Do Programs Focus on the Right Species?

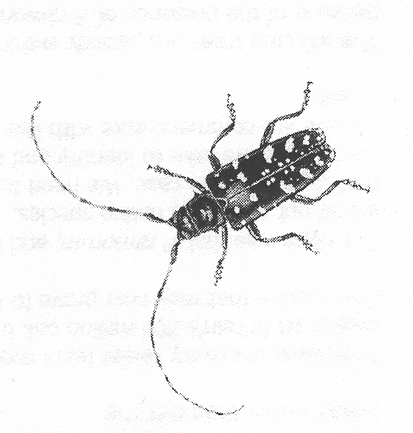
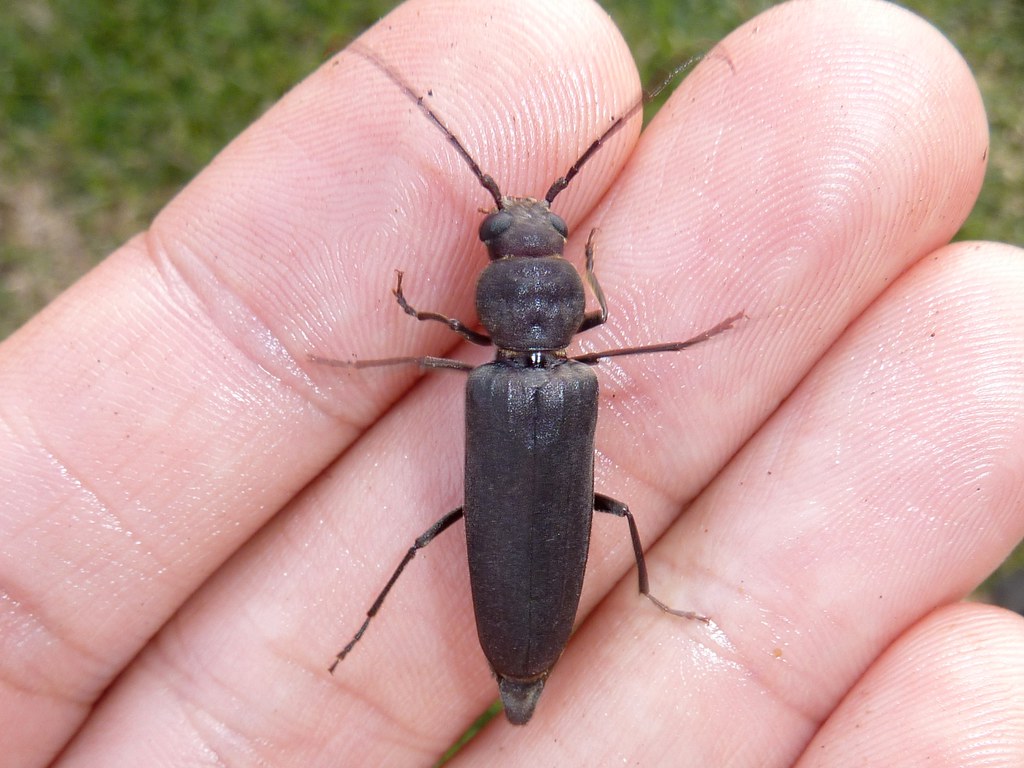
Although Hemiptera comprise about a third of recent detections and establishments, and four of eight established species are causing medium-to-high impact, no Hemiptera are currently listed as high priority forestry pests by Australian phytosanitary agencies (Nahrung & Carnegie (2021). On the other hand, Lepidoptera make up about a third of the high-priority species, yet only two have established in Australia over 130 years. Similarly, Cerambycidae are the most frequently intercepted forest pests and several are listed as high risk. But only three forest-related species have established (Nahrung and Carnegie 2020). (Note discussion of Bostrichidae above.).

Unlike the transcontinental exchanges under way in the Northern Hemisphere, none of the established beetles is from Asia; all are native to Europe. This is especially striking since interceptions from Asia-Pacific areas account for more than half of all interceptions Nahrung and Carnegie (2021).

Interestingly, 32 Australian Lepidopteran and eight Cerambycid species are considered pests in New Zealand. However, no forest pests native to New Zealand have established in Australia despite high levels of trade, geographic proximity, and the high number of shared exotic tree forest species (Nahrung and Carnegie 2020).

STRUCTURE OF PROGRAM

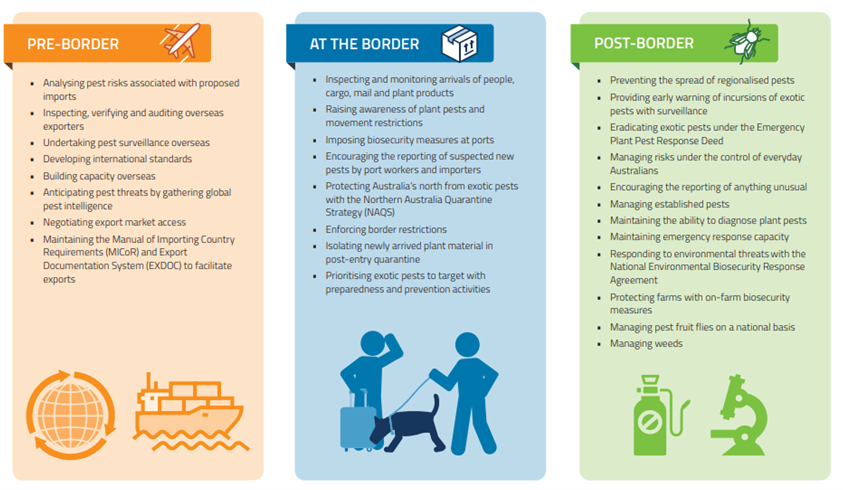
The structure of Australia’s plant biosecurity system is described in detail in Carnegie et al. (2022). These authors call the program “comprehensive” but to me it looks highly fragmented. The federal Department of Agriculture and Water Resources (DAWR,[recently renamed the Department of Agriculture, Fisheries, and Forestry, or DAFF) is responsible for pre-border (e.g., off-shore compliance) and border (e.g., import inspection) activities. The seven state governments, along with DAFF, are responsible for surveillance within the country, management of pest incursions, and regulation of pests. Once an alien pest has become established, its management becomes the responsibility of the land manager. In Australia, then, biosecurity is considered to be a responsibility shared between governments, industry and individuals.

Even this fragmented approach was developed more recently than one might expect given Australia’s reputation for having a stringent biosecurity system. Perhaps this reflects the earlier worldwide neglect of the Plant Kingdom? Carnegie and Nahrung (2019) describe recent improvements. Until the year 2000, Australia’s response to the detection of exotic plant pests was primarily case-by-case. In that year Plant Health Australia (PHA) was incorporated. Its purpose was to facilitate preparedness and response arrangements between governments and industry for plant pests. In 2005, the Emergency Plant Pest Response Deed (EPPRD) was created. It is a legally-binding agreement between the federal, state, and territorial governments and plant industry bodies. As of 2022, 38 were engaged. It sets up a process to implement management and funding of agreed responses to the detection of exotic plant pests – including cost-sharing and owner reimbursement. A national response plan (PLANTPLAN) provides management guidelines and outlines procedures, roles and responsibilities for all parties. A national committee (Consultative Committee on Emergency Plant Pests (CCEPP) works with surveys to determine invaded areas (delimitation surveys) and other data to determine whether eradicating the pest is technically feasible and has higher economic benefits than costs..

Austropuccinia psidii on Melaleuca quinquenervia; photo by John Tann via Flickr

Even after creation of EPPRD in 2005, studies revealed significant gaps in Australia’s post-border forest biosecurity systems regarding forest pests (Carnegie et al. 2022; Carnegie and Nahrung 2019). These studies – and the disappointing response to the arrival of myrtle rust – led to development of the National Forest Biosecurity Surveillance Strategy (NFBSS) – published in 2018; accompanied by an Implementation Plan. A National Forest Biosecurity Coordinator was appointed.

The forest sector is funding a significant proportion of the proposed activities for the next five years; extension is probable. Drs. Carnegie and Nahrung are pleased that the national surveillance program has been established. It includes specific surveillance at high-risk sites and training of stakeholders who can be additional eyes on the ground. The Australian Forest Products Association has appointed a biosecurity manager (pers. comm.)

This mechanism is expected to ensure that current and future needs of the plant biosecurity system can be mutually agreed on, issues identified, and solutions found. Plant Health Australia’s independence and impartiality allow the company to put the interests of the plant biosecurity system first. It also supports a longer-term perspective (Carnegie et al. (2022). Leading natural resource management organizations are also engaged (Carnegie, pers. comm.).

Presumably the forest surveillance strategy (NFBSS) structure is intended to address the following problems (Carnegie and Nahrung 2019):

  • Alien forest pests are monitored offshore and at the border, but post-border surveillance is less structured and poorly resourced. Australia still lacks a surveillance strategy for environmental pests.
  • Several plant industries have developed their own biosecurity programs, co-funded by the government. These include the National Forest Biosecurity Surveillance Strategy (NFBSS).

Some pilot projects targetting high risk sites were initiated in the early 2000s. By 2019, only one surveillance program remained — trapping for Asian spongy (gypsy) moth.

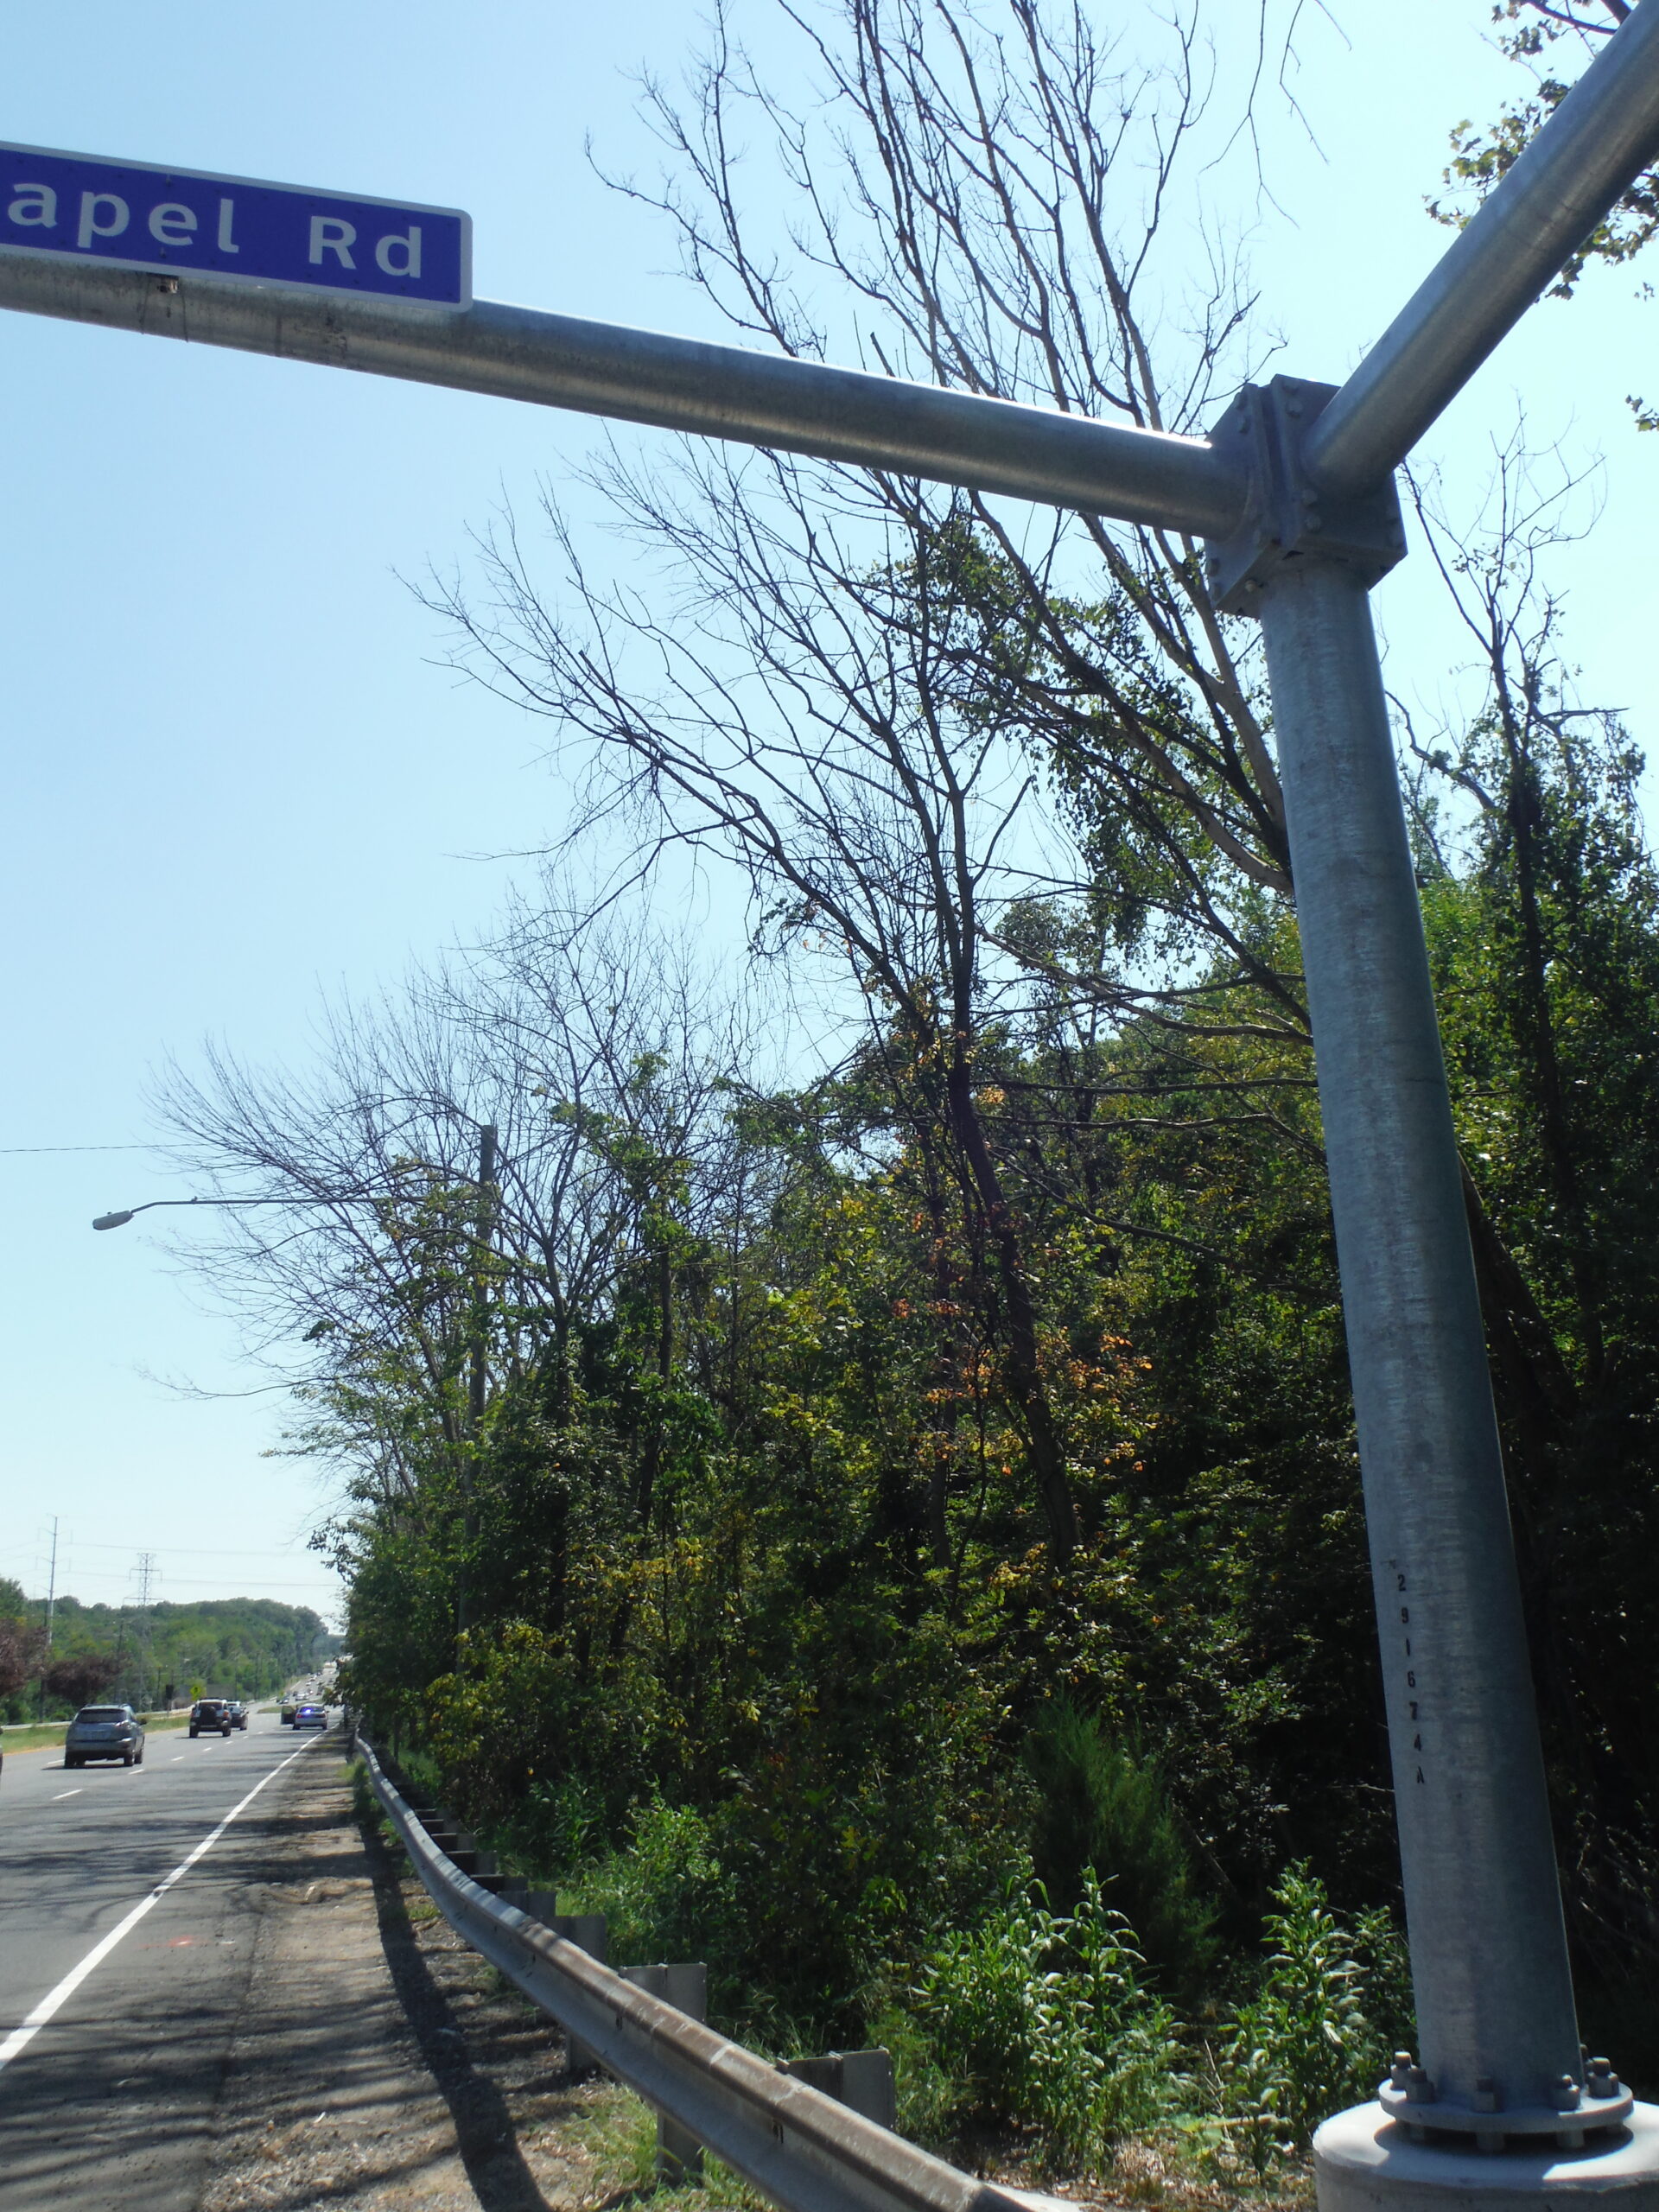
  • The states of Victoria and New South Wales have set up sentinel site programs. Victoria’s uses local council tree databases. It is apparently focused on urban trees and is primarily pest-specific – e.g., Dutch elm disease. The New South Wales program monitors more than 1,500 sentinel trees and traps insects near ports. This program is funded by a single forest grower through 2022.  

Dr. Carnegie states: “With the start of the national forest biosecurity surveillance program in December 2022, the issues and gaps identified by Carnegie et al. 2022 are starting to be addressed. The program will conduct biosecurity surveillance specifically for forest pests and pathogens and be integrated with national and state biosecurity activities. While biosecurity in Australia is still agri-centric, a concerted and sustained effort from technical experts from the forest industry is changing this. And finally, the new Biosecurity Levy should ensure sustained funding for biosecurity surveillance.”

There is a separate National Environmental Biosecurity Response Agreement (NEBRA), adopted in 2012. It is intended to provide guidelines for responding, cost-sharing arrangements, etc. when the alien pest threatens predominantly the environment or public amenity assets (Carnegie et al. (2022). However, when the polyphagous shot hole borer was detected, the system didn’t work as might have been expected. While PSHB had previously been identified as an environmental priority pest, specifically to Acacia, the decision whether to engage was made under auspices of the the Emergency Plant Pest Response Deed (EPPRD) rather than the environmental agreement (NEBRA). As a result, stakeholders focused on environmental, amenity and indigenous concerns had no formal representation in decision-making processes; instead, industries that had assessed the species as a low priority (e.g., avocado and plantation forestry) did (Nahrung, pers.comm.).

Additional Issues Needing Attention

Some needs are not addressed by the National Forest Pest Strategic Plan (Carnegie et al. 2022) (Nahrung, pers. comm.):

1) The long-term strategic investment from the commercial forestry sector and government needed to maintain surveillance and diagnostic expertise;

2) Studies to assess social acceptance of response and eradication activities such as tree removal; 

3) Studies to improve pest risk prioritization and assessment methods; and

4) Resolving the biosecurity responsibilities for pests of timber that has been cut and used in construction.

In 2019, Carnegie and Nahrung (2019) called for developing more effective methods of detection, especially of Hemiptera and pathogens. They also promoted national standardization of data collection. Finally, they advocated inclusion of technical experts from state governments, research organizations and industry in developing and implementing responses to pest incursions. They note that surveillance and management programs must be prepared to expect and respond to the unexpected since 85% of the pests detected over the last 20 years—and 75% of subsequently mid-to high-impact species established—were not on high-priority pest list. See Nahrung and Carnegie 2022 for a thorough discussion of the usefulness and weaknesses of predictive pest listing.

SOURCES

Aukema, J.E., D.G. McCullough, B. Von Holle, A.M. Liebhold, K. Britton, & S.J. Frankel. 2010. Historical Accumulation of Nonindigenous Forest Pests in the Continental United States. Bioscience. December 2010 / Vol. 60 No. 11

Carnegie A.J. and H.F. Nahrung. 2019. Post-Border Forest Biosecurity in AU: Response to Recent Exotic Detections, Current Surveillance and Ongoing Needs. Forests 2019, 10, 336; doi:10.3390/f10040336 www.mdpi.com/journal/forests

Carnegie A.J., F. Tovar, S. Collins, S.A. Lawson, and H.F. Nahrung. 2022. A Coordinated, Risk-Based, National Forest Biosecurity Surveillance Program for AU Forests. Front. For. Glob. Change 4:756885. doi: 10.3389/ffgc.2021.756885

Nahrung H.F. and A.J. Carnegie. 2020. NIS Forest Insects and Pathogens in Australia: Establishmebt, Spread, and Impact. Frontiers in Forests and Global Change 3:37. doi: 10.3389/ffgc.2020.00037 March 2020 | Volume 3 | Article 37

Nahrung, H.F. and A.J. Carnegie. 2021. Border interceps of forest insects estab in AU: intercepted invaders travel early and often. NeoBiota 64: 69–86. https://doi.org/10.3897/neobiota.64.60424

Nahrung, H.F. & A.J. Carnegie. 2022. Predicting Forest Pest Threats in Australia: Are Risk Lists Worth the Paper they’re Written on? Global Biosecurity, 2022; 4(1).

Posted by Faith Campbell

We welcome comments that supplement or correct factual information, suggest new approaches, or promote thoughtful consideration. We post comments that disagree with us — but not those we judge to be not civil or inflammatory.

For a detailed discussion of the policies and practices that have allowed these pests to enter and spread – and that do not promote effective restoration strategies – review the Fading Forests report at http://treeimprovement.utk.edu/FadingForests.htm

or

www.fadingforests.org

EAB: Why Quarantines Are Essential

area devastated by EAB; photo by Nathan Siegert, USFS

The emerald ash borer (EAB; Agrilus planipennis) is the most damaging forest insect ever introduced. In late June 2022 it was detected in Forest Grove, Oregon — 26 miles from Portland. This is the first confirmation of EAB on the West Coast – a jump of over 1,000 miles from outbreaks in the Plains states. The infested ash trees were immediately cut down and chipped (see Oregon Department of Agriculture website; full link at end of blog). See my earlier blog on EAB’s threat to ash-dominated riparian wetlands in Oregon.

ash-dominated swamp along the Willamette River in Oregon; photo by William Wyatt, ODF

Oregon has been preparing for the EAB:

  • The state finalized its response plan in March 2021; see reference at end of blog.
  • The state sought and received funds from USDA APHIS to initiate a biocontrol program. The funds were not from APHIS’ operational budget, but from the agency’s Plant Pest and Disease Management and Disaster Prevention Program (PPDMDPP) (Farm Bill money).  
  • State and federal agencies have begun collecting seeds for resistance screening and a possible breeding program.

EAB: Why Quarantines Are Essential

As you might remember, in January 2021 APHIS dropped its federal regulations aimed at curtailing EAB’s spread via movement of wood and nursery plants. This shifted the responsibility for quarantines to state authorities. Instead, APHIS reallocated its funding to biological control. I raised objections at the time, saying the latter was no substitute for the former.

A new academic study shows that APHIS’ action was a costly mistake.

Hudgins et al. (2022; full citation at end of this blog) estimate EAB damage to street trees alone – not  counting other urban trees – in the United States will be roughly $900 million over the next 30 years. These costs cannot be avoided. Cities cannot allow trees killed by EAB to remain standing, threatening to cause injury or damage when they fall.

ash fallen onto house in Ann Arbor, Michigan; photo courtesy of former mayor John Hieftje

The authors evaluated various control options for minimizing the number of ash street trees exposed to EAB. They assessed the trees’ exposure in the next 40 years, based on management actions taken in the next 30 years.

In their evaluation of management options, Hudgins et al. tried to account for the fact that the effect of management at any specific site depends on the effects of previous management. Additional complexity comes from the facts that the EAB is spread over long distances largely by human actions (i.e., movement of infested wood); and that biocontrol organisms also disperse.

They conclude that efforts to control spread at the invasion’s leading edge alone – as APHIS’ program did – are less useful than accounting for urban centers’ role in long-distance pest dispersal via human movement. Cities with infested trees are hubs for pest transport along roads. Hudgins et al. say that quarantine programs need to incorporate this factor.

Hudgins et al. concluded that the best management strategy always relied on site-specific quarantines aimed at slowing the EAB spread rate. This optimized strategy, compared to conventional approaches, could potentially save $585 million and protect an additional 1 million street trees over the next 40 years. They also found that budgets should be allocated as follows: 74-89% of funds going to quarantine, the remaining 11% to 26% to biocontrol.

 In other words, a coherent harmonized quarantine program – either through reinstatement of the federal quarantine or coordination of state quarantines — could save American cities up to $1 billion and protect 1 million trees over several decades. Since street trees make up only a small fraction of all urban trees, up to 100 million urban ash trees could be protected, leading to even greater cost savings.

Unfortunately, such a coordinated approach seems unlikely. States continue to have very different attitudes about the risk. For example, Washington has no plans to adopt EAB regulations, despite it being detected in Oregon. To the north, Canada already has EAB quarantines and Hudgins et al. advise that they be maintained.

The authors recognize that quarantines’ efficacy is a matter of debate. Quarantines require high degrees of compliance from all economic agents in the quarantine area. Also they need significant enforcement effort. Some argue that meeting either requirement, let alone both, is unrealistic.  However, under Hudgins et al.’s model, use of quarantines was always part of the optimal management method across a variety of quarantine efficiency scenarios. Again, these models point to allocating about 75% of the total budget to quarantine implementation. In all scenarios, reliance solely on biocontrol led to huge losses of trees compared to a combined strategy.

Hudgins et al. asked their model for optimal application of both quarantines and biocontrol agents. For example, quarantine enforcement could focus on limiting entry of EAB at sites that: 1) have many ash street trees, 2) currently have low EAB propagule pressure, but 3) are vulnerable to receiving high propagule influx from many sites. Seattle is a prime example of such a vulnerable city with many transportation links to distant cities with significant ash populations.

On the other hand, quarantine enforcement could strive to limit outward spread (emigration) of EAB from which high numbers of pests could be transported to multiple other locales, each with many street trees and low propagule pressure. These sites would be along the leading edge of the invasion and where the probability of long-distance pest dispersal is high.

Authorities should be prepared to adjust quarantine actions in response to changing rates and patterns of invasion spread.

Biocontrol agents should be deployed to sites with sufficient EAB density to support the parasitoids, especially sites predicted to be hubs of spread.

Hudgins et al. concede that they did not explicitly account for:

1) The impact of uncertainty regarding EAB spread on the model;

2) Alternative objectives that might point to other approaches, e.g., minimizing extent of invaded range, or reducing the number of urban and forest trees exposed to EAB;

3) Impacts of predators, such as woodpeckers, on EAB populations;  

4) Synergistic impacts from climate change, which by exacerbating stress on ash trees will probably increase tree mortality from EAB infestations; and

5) Variation in management efficiency depending on communities’ capacities.

In the future, Hudgins et al. hope to test their model on other species to determine whether there is a predictable spatial pattern for all wood boring pests, that is, should quarantines always be focused on centers of high pest densities as probable sources of spread. Determining any patterns would greatly assist risk assessment and proactive planning.

dead ash near major road in northern Virginia; photo by F.T. Campbell

In an earlier study, Dr. Hudgins and other colleagues projected that by 2050, 1.4 million street trees in urban areas and communities of the United States will be killed by introduced insect pests – primarily EAB. This represents 2.1- 2.5% of all urban street trees. Nearly all of this mortality will occur in a quarter of the 30,000 communities evaluated. They predict that 6,747 communities not yet affected by the EAB will suffer the highest losses between now and 2060. However, they evaluated risks more broadly: the potential pest threat to 48 tree genera. Their model indicated that if a new woodboring insect pest is introduced, and that pest attacks maples or oaks, it could kill 6.1 million trees and cost American cities $4.9 billion over 30 years.  The risk would be highest if this pest were introduced via a port in the South. I have blogged often about the rising rate of shipments coming directly from Asia to the American South

SOURCES

Hudgins, E.J., J.O. Hanson, C.J.K. MacQuarrie, D. Yemshanov, C.M. Baker, I. Chadès, M. Holden, E.  McDonald-Madden, J.R. Bennett. 2022. Optimal emerald ash borer (Agrilus planipennis) control across the U.S.  preprint available here: https://doi.org/10.21203/rs.3.rs-1998687/v2

Hudgins, E.J., F.H. Koch, M.J. Ambrose, B. Leung. 2022. Hotspots of pest-induced US urban tree death, 2020–2050. Journal of Applied Ecology

Members of this team published an article earlier that evaluated the threat from introduced woodborers as a group to U.S. urban areas; see E.J. Hudgins, F.H. Koch, M.J. Ambrose, B. Leung. 2022. Hotspots of pest-induced US urban tree death, 2020–2050. Journal of Applied Ecology

Oregon Department of Agriculture: https://www.oregon.gov/oda/programs/IPPM/SurveyTreatment/Pages/EmeraldAshBorer.aspx

Posted by Faith Campbell

We welcome comments that supplement or correct factual information, suggest new approaches, or promote thoughtful consideration. We post comments that disagree with us — but not those we judge to be not civil or inflammatory.

For a detailed discussion of the policies and practices that have allowed these pests to enter and spread – and that do not promote effective restoration strategies – review the Fading Forests report at http://treeimprovement.utk.edu/FadingForests.htm

or

www.fadingforests.org

West Coast Steps Up Efforts to Protect Ash

Oregon-ash dominated swamp in the Ankeny National Wildlife Refuge, Willamette Valley, Oregon; photo by Wyatt Williams, Oregon Department of Forestry

In April 2022 I blogged about efforts on the West Coast to prepare for arrival of the emerald ash borer (EAB).

That blog focused on Oregon ash (Fraxinus latifolia), which is an important component of riparian forests. I alerted you to the availability of ODA/ODF EAB 2018 Response Plan.

I also mentioned Oregon’s active participation in “don’t move firewood” campaigns.

California has long inspected incoming firewood. In 2021 it establishment of a state quarantine in response to APHIS ending the federal quarantine. Washington State operates a statewide trapping program for invasive insects but does not regulate firewood.

Contributions from the Tualatin Soil and Water Conservation District enabled the USDA Forest Service Dorena Genetic Resource Center to begin testing Oregon ash for resistance to EAB and related genetics work. Other funding came from the USFS Forest Health Protection program.

EAB has now been detected in Oregon — in the Willamette Valley! (See photo above, by Wyatt Williams) Concerned stakeholders have established a new newsletter to keep people informed and promote cooperative efforts.

The newsletter is “Ash across the West”.

The first issue of the newsletter provides the following information:

  • there are eight ash species in the West; all are vulnerable to the emerald ash borer (EAB)

Single-leaf ash (Fraxinus anomala)     CA, NV, AZ, UT, NM, CO, WY

Fragrant ash (Fraxinus cuspidata)       NV, AZ, NM, UT

Calif ash (Fraxinus dipetala)               CA, NV, AZ, UT

Fresnillo (Fraxinus gooddingii)               AZ

Gregg’s ash (Fraxinus greggii)                        AZ

OR ash (Fraxinus latifolia)                  WA, OR, CA

Chihuahuan ash (Fraxinus papillosa)    AZ, NM, TX

Velvet ash (Fraxinus velutina)                         CA, NV, AZ, UT, NM, TX

  • EAB Risk Map for OR: based upon known occurrences of ash & corresponding human activities associated with known pathways of EAB introduction and establishment.
  • 2022 status of the two field trials
    • the Dorena Genetic Resource Center (DGRC): planted 600 seedlings from 27 families; 85% survival in 2022; controlling competing vegetation
    • Washington State University Puyallup Research Center: planted seedlings from 26 of these families; 95% survival rate. Possible complication from a foliar disease.  
  • Seedlings from 17 Oregon ash families (including 14 of those in the DGRC field trial) sent to Dr. Jennifer Koch (USFS) in Ohio) for EAB resistance/susceptibility testing.
  • Seed collections began in 2019; interrupted by COVID-19 in 2020 but resumed in 2021 and continue in 2022. Several consortia are involved in Oregon and Washington. In California and the other states, The Huntington Botanical Gardens will lead the collecting effort. Funding is from USFS Forest Health Protection. Seeds are stored for gene conservation; some are used for the field trials in Oregon and Washington and the initial EAB-resistance studies going on in Ohio.
  • Penn State Ash Genomic Project: Dr. Jill Hamilton is trying to create a ‘genomic passport’ for Oregon ash populations for use in establishing genotype-environment associations to inform seed transfer guidelines. If you would like to help Dr. Hamilton collect leaves for sampling, contact: Dr. Jill Hamilton at jvh6349@psu.edu

To help with seed collection, ash monitoring, documenting the importance of ash to various communities, and other activities; or to get on the mailing list for the newsletter, contact Richard Sniezko at Richard.sniezko@usda.gov

A video explaining the campaign to save Oregon ash is at https://youtu.be/uZmfLrxEA7g

Posted by Faith Campbell

We welcome comments that supplement or correct factual information, suggest new approaches, or promote thoughtful consideration. We post comments that disagree with us — but not those we judge to be not civil or inflammatory.

For a detailed discussion of the policies and practices that have allowed these pests to enter and spread – and that do not promote effective restoration strategies – review the Fading Forests report at http://treeimprovement.utk.edu/FadingForests.htm

or

www.fadingforests.org

Hundreds of U.S. Tree Species Endangered, Most due to Non-Native Pests

Horton House on Jekyll Island, Georgia before laurel wilt killed the giant redbay trees; photo by F.T. Campbell

Close to four hundred tree species native to the United States are at risk of extinction. The threats come mainly from non-native insects and diseases – a threat we know gets far too little funding, policy attention, and research.

As Murphy Westwood, Vice President of Science and Conservation at the Morton Arboretum, which led the U.S. portion of a major new study, said to Gabriel Popkin, writing for Science: “We have the technology and resources to shift the needle,” she says. “We can make a difference. We have to try.”

Staggering Numbers

More than 100 tree species native to the “lower 48” states are endangered (Carrero et al. 2022; full citation at the end of this blog). These data come from a global effort to evaluate tree species’ conservation status around the world. I reported on the global project and its U.S. component in September 2021. This month Christina Carrero and colleagues (full citation at the end of this blog) published a summary of the overall picture for the 881 “tree” species (including palms and some cacti and yuccas) native to the contiguous U.S. (the “lower 48”).

This study did not address tree species in Hawai`i or the U.S. Pacific and Caribbean territories. However, we know that another 241 Hawaiian tree species are imperiled (Megan Barstow, cited here).

Assessing Threats: IUCN, NatureServe, and CAPTURE

Carrero and colleagues assessed trees’ status by applying methods developed by IUCN and NatureServe. (See the article for descriptions of these methods.) These two systems consider all types of threats. Meanwhile, three years ago Forest Service scientists assessed the specific impacts of non-native insects and pathogens on tree species in the “lower 48” states and Alaska in “Project CAPTURE” (Conservation Assessment and Prioritization of Forest Trees Under Risk of Extirpation). All three systems propose priorities for conservation efforts. For CAPTURE’s, go here.

Analyses carried out under all three systems (IUCN, NatureServe, and CAPTURE) concur that large numbers of tree species are imperiled. Both IUCN and CAPTURE agree that non-native insects and pathogens are a major cause of that endangerment. While the overall number of threatened species remained about the same for all three systems, NatureServe rated threats much lower for many of the tree species that IUCN and CAPTURE considered most imperiled.

This difference arises from the criteria used to rate a species as at risk. IUCN’s Criterion A is reduction in population size. Under this criterion, even extremely widespread and abundant species can qualify as threatened if the population declines by at least 30% over three generations in the past, present, and/or projected future. NatureServe’s assessment takes into account rapid population decline, but also considers other factors, for example, range size, number of occurrences, and total population size. As a result, widespread taxa are less likely to be placed in “at risk” categories in NatureServe’s system.

In my view, the IUCN criteria better reflect our experience with expanding threats from introduced pests. Chestnut blight, white pine blister rust, dogwood anthracnose, emerald ash borer, laurel wilt disease, beech leaf disease, and other examples all show how rapidly introduced pathogens and insects can spread throughout their hosts’ ranges. (All these pests are profiled here . ) They can change a species’ conservation status within decades whether that host is widespread or not.  

Which Species Are at Risk: IUCN

Carrero and colleagues found that under both IUCN and NatureServe criteria, 11% to 16% of the 881 species native to the “lower 48” states are endangered. Another five species are possibly extinct in the wild. Four of the extinct species are hawthorns (Crataegus); the fifth is the Franklin tree (Franklinia alatamaha) from Georgia. A single specimen of a sixth species, an oak native to Texas (Quercus tardifolia),was recently re-discovered in Big Bend National Park.

Franklinia (with Bachman’s warbler); both are extinct in the wild; painting by John Jacob Audubon

The oak and hawthorn genera each has more than 80 species. Relying on the IUCN process, Carrero and colleagues found that a significant number of these are at risk: 17 oaks (20% of all species in the genus); 29 hawthorns (34.5% percent). A similar proportion of species in the fir (Abies), birch (Betula), and walnut (Juglans) genera are also threatened.

Other genera have an even higher proportion of their species under threat, per the IUCN process:

  • all species in five tree genera, including Persea (redbay, swampbay) and Torreya (yews);
  • two-thirds of chestnuts and chinkapins (Castanea), and cypress (Cupressus);
  • almost half (46.7%) of ash trees (Fraxinus).                                                    

Pines are less threatened as a group, with 15% of species under threat. However, some of these pines are keystone species in their ecosystems, for example the whitebark pine of high western mountains.

Carrero et al. conclude that the principal threats to these tree species are problematic and invasive species; climate change and severe weather; modifications of natural systems; and overharvest (especially logging). Non-native insects and pathogens threaten about 40 species already ranked by the IUCN criteria as being at risk and another 100 species that are not so ranked. Climate change is threatening about 90 species overall.

range of black ash

Considering the invasive species threat, Carrero and colleagues cite specifically ash trees and the bays (Persea spp.). In only 30 years, the emerald ash borer has put five of 14 ash species at risk. All these species are widespread, so they are unlikely to be threatened by other, more localized, causes. In about 20 years, laurel wilt disease threatens to cause extinction of all U.S. tree species in the Persea genus.

Carrero and colleagues note that conservation and restoration of a country’s trees and native forests are extremely important in achieving other conservation goals, including mitigating climate change, regulating water cycles, removing pollutants from the air, and supporting human well-being. They note also forests’ economic importance.

As I noted above, USFS scientists’ “Project CAPTURE” also identified species that deserve immediate conservation efforts.

Where Risk Assessments Diverge

All three systems for assessing risks agree about the severe threat to narrowly endemic Florida torreya and Carolina hemlock.

With three risk ranking systems, all can agree (as above), all can disagree, or pairs can agree in four different ways. Groups of trees fall into each pair, with various degrees of divergence.  Generally, only two of the three systems agree on more widespread species:

  • black ash: IUCN and Project CAPTURE prioritize this species. NatureServe ranked it as “secure” (G5) as recently as 2016.
  • whitebark pine: considered endangered by IUCN, “vulnerable” (G3) by NatureServe. The US Fish and Wildlife Service has proposed listing the species as “threatened” under the Endangered Species Act. https://www.fws.gov/species-publication-action/endangered-and-threatened-wildlife-and-plants-threatened-species-18 However, Project CAPTURE does not include it among its highest priorities for conservation. Perhaps this is because there are significant resistance breeding and restoration projects already under way.
  • tanoak: considered secure by both IUCN and NatureServe, but prioritized by Project CAPTURE for protection.
dead tanoak in Curry County, Oregon; photo by Oregon Department of Forestry

Carrero notes the divergence between IUCN and NatureServe regarding ashes. Four species ranked “apparently secure” (G4) by NatureServe (Carolina, pumpkin, white, and green ash) are all considered vulnerable by IUCN. They are also prioritized by Project CAPTURE. I have described the impact of the emerald ash borer on black ash. Deborah McCullough, noted expert on ash status after invasion by the emerald ash borer, also objects to designating this species as “secure” (pers. comm.).

This same divergence appears for eastern hemlock.

Port-Orford cedar is currently ranked as at risk by IUCN and Project CAPTURE, but not NatureServe. Growing success of the restoration breeding project has prompted IUCN to change the species’ rank from “vulnerable” to “near threatened”. IUCN is expected to reclassify it as of “least concern” in about a decade if breeding efforts continue to be successful (Sniezko presentation to POC restoration webinar February 2022).

While these differing detailed assessments are puzzling, the main points are clear: several hundred of America’s tree species (including many in Hawai`i, which – after all – is our 50th state!) are endangered and current conservation and restoration efforts are inadequate.

Furthermore, a tree species loses its function in the ecosystem long before it becomes extinct. It might still be quite numerous throughout its range – but if each individual has shrunken in size it cannot provide the same ecosystem services. Think of thickets of beech root sprouts – they cannot provide the bounteous nut crops and nesting cavities so important to wildlife. Extinction is the extreme. We should act to conserve species much earlier.

YOU CAN HELP!

Congress is considering the next Farm Bill – which is due to be adopted in 2023. Despite its title, this legislation has often provided authorization and funding for forest conservation (for example, the US Forest Service’ Landscape Scale Restoration Program).

There is already a bill in the House of Representatives aimed at improving the US Department of Agriculture’s prevention and early detection/rapid response programs for invasive pests. Also, it would greatly enhance efforts to restore decimated tree species via resistance breeding, biocontrol, and other strategies. This bill is H.R. 1389.

The bill was introduced by Rep. Peter Welch of Vermont, who has been a solid ally and led on this issue for several years. As of August 2022, the bill has seven cosponsors, most from the Northeast: Rep. Mike Thompson [CA], Rep. Chellie Pingree [ME], Reps. Ann M. Kuster and Chris Pappas [NH], Rep. Elise Stefanik [NY], Rep. Deborah K. Ross [NC], Rep. Brian Fitzpatrick [PA].

Please write your Representative and Senators. Urge them to seek incorporation of H.R. 1389 in the 2023 Farm Bill. Also, ask them to become co-sponsors for the House or Senate bills. (Members of the key House and Senate Committees are listed below, along with supporting organizations and other details.)

Details of the Proposed Legislation

The Invasive Species Prevention and Forest Restoration Act [H.R. 1389]

  • Expands USDA APHIS’ access to emergency funding to combat invasive species when existing federal funds are insufficient and broadens the range of actives that these funds can support.
  • Establishes a grant program to support research on resistance breeding, biocontrol, and other methods to counter tree-killing introduced insects and pathogens.
  • Establishes a second grant program to support application of promising research findings from the first grant program, that is, entities that will grow large numbers of pest-resistant propagules, plant them in forests – and care for them so they survive and thrive.
  • [A successful restoration program requires both early-stage research to identify strategies and other scientists and institutions who can apply that learning; see how the fit together here.]
  • Mandates a study to identify actions needed to overcome the lack of centralization and prioritization of non-native insect and pathogen research and response within the federal government, and develop national strategies for saving tree species.

Incorporating the provisions of H.R. 1389 into the 2023 Farm Bill would boost USDA’s efforts to counter bioinvasion. As Carrera and colleagues and the Morton Arboretum study on which their paper is based demonstrate, our tree species desperately need stronger policies and more generous funding. Federal and state measures to prevent more non-native pathogen and insect pest introductions – and the funding to support this work – have been insufficient for years. New tree-killing pests continue to enter the country and make that deficit larger –see beech leaf disease here. Those here, spread – see emerald ash borer to Oregon.

For example, funding for the USDA Forest Service Forest Health Protection program has been cut by about 50%; funding for USFS Research projects that target 10 high-profile non-native pests has been cut by about 70%.

H.R. 1389 is endorsed by several organizations in the Northeast: Audubon Vermont, the Maine Woodland Owners Association, Massachusetts Forest Alliance, The Nature Conservancy Vermont, the New Hampshire Timberland Owners Association, Vermont Woodlands Association, and the Pennsylvania Forestry Association.

Also, major forest-related national organizations support the bill: The American Chestnut Foundation (TACF), American Forest Foundation, The Association of Consulting Foresters (ACF), Center for Invasive Species Prevention, Ecological Society of America, Entomological Society of America, National Alliance of Forest Owners (NAFO), National Association of State Foresters (NASF), National Woodland Owners Association (NWOA), North American Invasive Species Management Association (NAISMA), Reduce Risk from Invasive Species Coalition, The Society of American Foresters (SAF).

HOUSE AND SENATE AGRICULTURE COMMITTEE MEMBERS – BY STATE

STATEMember, House CommitteeMember, Senate CommitteeKey members * committee leadership # forestry subcommittee leadership @ cosponsor of H.R. 1389
AlabamaBarry Moore  
ArizonaTom O’Halleran  
ArkansasRick CrawfordJohn Boozman* 
CaliforniaJim Costa Salud Carbajal Ro Khanna Lou Correa Josh Harder Jimmie Panetta Doug LaMalfa  
Colorado Michael Bennet # 
ConnecticutJahana Hayes  
FloridaAl Lawson Kat Cammack  
GeorgiaDavid Scott * Sanford Bishop Austin Scott Rick AllenRaphael Warnock Tommy Tuberville 
IllinoisBobby Rush Cheri Bustos Rodney Davis Mary MillerRichard DurbinNote that the report was led by scientists at the Morton Arboretum – in Illinois!
IndianaJim BairdMike Braun 
IowaCindy Axne Randy FeenstraJoni Ernst Charles Grassley 
KansasSharice Davids Tracey MannRoger Marshall# 
Kentucky Mitch McConnell 
MaineChellie Pingree @  
MassachusettsJim McGovern  
Michigan Debbie Stabenow * 
MinnesotaAngie Craig Michelle FischbachAmy Klobuchar Tina Smith 
MississippiTrent KellyCindy Hyde-Smith 
MissouriVicky Hartzler  
NebraskaDon BaconDeb Fischer 
New HampshireAnn McLane Kuster @  
New Jersey Cory Booker 
New Mexico Ben Ray Lujan 
New YorkSean Patrick Maloney Chris JacobsKristen Gillibrand 
North CarolinaAlma Adams David Rouzer  
North Dakota John Hoeven 
OhioShontel Brown Marcy Kaptur Troy BaldersonSherrod Brown 
PennsylvaniaGlenn Thompson  
South DakotaDusty JohnsonJohn Thune 
TennesseeScott DesJarlais  
TexasMichael Cloud Mayra Flores  
Vermont Patrick Leahy 
VirginiaAbigail Spanberger #  
WashingtonKim Schreir  

SOURCES

Christina Carrero, et al. Data sharing for conservation: A standardized checklist of US native tree species and threat assessments to prioritize and coordinate action. Plants People Planet. 2022;1–17. wileyonlinelibrary.com/journal/ppp3

Washington Post: Sarah Kaplan, “As many as one in six U.S. tree species is threatened with extinction” https://www.washingtonpost.com/climate-environment/2022/08/23/extinct-tree-species-sequoias/

Popkin, G. “Up to 135 tree species face extinction—and just eight enjoy federal protection”, Science August 25, 2022. https://www.science.org/content/article/135-u-s-tree-species-face-extinction-and-just-eight-enjoy-federal-protection

Posted by Faith Campbell

We welcome comments that supplement or correct factual information, suggest new approaches, or promote thoughtful consideration. We post comments that disagree with us — but not those we judge to be not civil or inflammatory.

For a detailed discussion of the policies and practices that have allowed these pests to enter and spread – and that do not promote effective restoration strategies – review the Fading Forests report at http://treeimprovement.utk.edu/FadingForests.htm

or

www.fadingforests.org

Invasive Species Costs Point to Inadequate Effort – especially Prevention

EAB-killed ash tree falls before it can be taken down; photo courtesy of former Ann Arbor mayor John Hieftje

Concerned by growing impacts of bioinvasion and inadequate responses by national governments worldwide and by international bodies, a group of experts have attempted to determine how much invasive species are costing. They’ve built the global database – InvaCost. See Daigne et al. 2020 here.

Several studies have been based on these data. In two earlier blogs, I summarized two of these articles, e.g., Cuthbert et al. on bioinvasion costs, generally, and Moodley et al. on invasive species costs in protected areas, specifically. Here, I look at two additional studies. Ahmed et al. focusses on the “worst” 100 invasives affecting conservation — as determined by the International Union of Conservation and Nature (IUCN). The second, by Turbelin et al., examines pathways of introduction. Full citations of all sources appear at the end of this blog.

It is clear from all of these papers that the authors (and I!) are frustrated by the laxity with which virtually all governments respond to bioinvasions. Thus more robust actions are needed. The authors and I also agree that data on economic costs influence political decision-makers more than ecological concerns. However, InvaCost – while the best source in existence — is not yet comprehensive enough to generate the thoroughly-documented economic data about specific aspects of bioinvasion that would be most useful in supporting proposed strategies.

Scientists working with InvaCost recognize that the data are patchy. At the top level, these data demonstrate high losses and management costs imposed by bioinvasion. The global total – including both realized damage and management costs – is estimated at about $1.5 trillion since 1960. In fact, these overall costs are probably substantially underestimates (Cathbert et al.). [For a summary of data gaps, go to the end of the blog.] Furthermore, they recognize that species imposing the highest economic costs might not cause the greatest ecological harm (Moodley et al).

citrus longhorned beetle exit hole in bonsai tree; USDA APHIS photo

Comparing estimated management costs to estimated damage, the authors conclude that countries invest too little in bioinvasion management efforts and — furthermore — that expenditures are squandered on the wrong “end” of bioinvasion – after introduction and even establishment, rather than in preventive efforts or rapid response upon initial detection of an invader. While I think this is true, these findings might be skewed by the fact that fewer than a third of countries reporting invasive species costs included data on specifically preventive actions. Cuthbert et al. notes that failing to try to prevent introductions imposes an avoidable burden on resource management agencies. Ahmed et al. developed a model they hope will overcome the perverse   incentives that lead decision-makers to either do nothing or delay.

  1. Why Decision-Makers Delay

Citing the InvaCost data, the participating experts reiterate the long-standing call for prioritizing investments at the earliest possible invasion stage. Ahmed et al. found that this was the most effective practice even when costs accrue slowly. They ask, then, why decision-makers often delay initiating management. I welcome this attention because we need to find ways to rectify this situation.

They conclude, first, that invasive species threats compete for resources with other threats to agriculture and natural systems. Second, Cuthbert et al. and Ahmed et al. both note that decision-makers find it difficult to justify expenditures before impacts are obvious and/or stakeholders demand action. By that time, of course, management of invasions are extremely difficult and expensive – if possible at all. I appreciate the wording in Ahmed et al.: bioinvasion costs can be deceitfully slow to accrue, so policy makers don’t appreciate the urgency of taking action.

Cuthbert et al. also note that impacts are often imposed on other sectors, or in different regions, than those focused on by the decision-makers. Stakeholders’ perceptions of whether an introduced species is causing a “detrimental” impact also vary. Finally, when efficient proactive management succeeds – prevents any impact – it paradoxically undermines evidence of the value of this action!

Ahmed et al. point out that in many cases, biosecurity measures and other proactive approaches are even more cost effective when several species are managed simultaneously. They cite as examples airport quarantine and interception programs; Check Clean Dry campaigns encouraging boaters to avoid moving mussels and weeds; ballast water treatment systems; and transport legislation e.g., the international standard for wood packaging (ISPM#15) [I have often discussed the weaknesses in ISPM#15 implementation; go to “wood packaging” under “Categories” (below the archive list)].

pallet “graveyard”; photo by Anand Prasad
  • Pathways of Species’ Introduction

Tuberlin et al. focus on pathways of introduction, which they say influence the numbers of invaders, the frequency of their arrival, and the geography of their eventual distribution. This study found sufficient data to analyze arrival pathways of 478 species – just 0.03% of the ~14,000 species in the full database. They found that intentional pathways – especially what they categorized as “Escape” – were responsible for the largest number of invasive species (>40% of total). On the other hand, the two unintentional pathways called “Stowaway” and “Contaminant” introduced the species causing the highest economic costs.

Tuberlin et al. therefore emphasize the importance of managing these unintentional pathways. Also, climate change and emerging shipping technologies will increase potential invaders’ survivability during transit. Management strategies thus must be adapted to countering these additive trends. They suggest specifically:

  • eDNA detection techniques;
  • Stricter enforcement of ISPM#15 and exploring use of recyclable plastic pallets (e.g., IKEA’s OptiLedge); [see my blog re: plastic pallets, here]
  • Application of fouling-resistant paints to ship hulls;
  • Prompt adoption of international agreements addressing pathways (they cite the Ballast Water Management Treaty as entered into force only in 2017 — 13 years after adoption);
  • Ensuring ‘pest free status’ (per ISPM#10) before allowing export of goods—especially goods in the “Agriculture”, “Horticulture”, and “Ornamental” trades; and
  • Increasing training of interception staff at ports.

What InvaCost Data say re: Taxa of greatest concern to me

Two-thirds of reported expenditures are spent on terrestrial species (Cuthbert et al.). Insects as a Class constitute the highest number of species introduced as ‘Contaminants’ (n = 74) and ‘Stowaways’ (n = 43). They also impose the highest costs among species using these pathways. Forest insects and pathogens account for less than 1% of the records in the InvaCost database, but constitute 25% of total annual costs ($43.4 billion) (Williams et al., in prep.). Indeed, one of 10 species for which reported spending on post-invasion management is highest is the infamous Asian longhorned beetle (Tuberlin et al.)

ALB pupa in wood packaging; Pennsylvania Dept. of Natural Resources via Bugwood

Mammals and plants are often introduced deliberately – either as intentional releases or as escapes. Plant invasions are reported as numerous but impose lower costs.

Tuberlin et al. state that intentional releases and escapes should in theory be more straightforward to monitor and control, so less costly. They propose two theories: 1) Eradication campaigns are more likely to succeed for plants introduced for cultivation and subsequently escaped, than for plants introduced through unintentional pathways in semi-natural environments. 2) Species introduced unintentionally may be able to spread undetected for longer; they expect that better measures already exist to control invasions by deliberate introductions. I question both. Their theories ignore that constituencies probably like the introduced plants … and the near absence of attention to the possible need to control their spread. This is odd because elsewhere they recognize conflicts over whether to control or eradicate “charismatic” species.

Geographies of greatest concern to me

  • North America reported spending 54% of the total expenditure in InvaCost. Oceania spent 30%. The remaining regions each spent less than $5 billion. (Cuthbert et al.)
  • North America funded preventative actions most generously than other regions. Cuthbert suggests this was because David Pimentel published an early estimate of invasive species costs. I doubt it. The Lacey Act was adopted in 1905. USDA APHIS was formed in 1972 – based on predecessor agencies — because officials recognized the damage by non-native pests to agriculture. APHIS began addressing natural area pests with discovery of the Asian longhorned beetle in 1996. Of course, most of APHIS’ budget is still allocated to agricultural pests. I conclude that North America’s lead in this area has not resulted in adequate prevention programs.
Oregon ash swamp before attack by EAB (photo by Wyatt Williams, Oregon Dept. of Forestry)

Equity Issues

Tuberlin et al and Moodley et al. address equity issues of who causes introductions vs. who is impacted. This is long overdue.

  • More than 80% of bioinvasion management costs in protected areas fell on governmental services and/or official organizations (e.g. conservation agencies, forest services, or associations). With the partial exception of the agricultural sector, the economic sectors that contribute the most to movement of invasive species are spared from carrying the resulting costs (Moodley et al.)
  • A lack of willingness to invest might represent a moral problem when the invader’s impacts are incurred by regions, sectors, or generations other than those that on whom management action falls (Ahmed et al.)
  • People are perhaps more inclined to spend money to mitigate impacts that cause economic losses than those that damage ecosystems (Tuberlin et al.)

Data deficiencies

  • Only 41% of countries (83 out of 204) reported management costs; of those, only 24 reported costs specifically associated with pre-invasion (prevention) efforts (Cuthbert et al.).
  • Reliable economic cost estimates were available for only 60% of the “worst” invasive species (Cuthbert et al.)
  • Only 55 out of 266,561 protected areas reported losses or management costs (Moodley et al.).
  • Information on pathways of introduction was available for only three species out of 10,000 (Turbelin et al).
  • Taxonomic and geographic biases in reporting skew examples and possibly conclusions (Cuthbert et al.).

SOURCES

Ahmed, D.A., E.J. Hudgins, R.N. Cuthbert, .M. Kourantidou, C. Diagne, P.J. Haubrock, B. Leung, C. Liu, B. Leroy, S. Petrovskii, A. Beidas, F. Courchamp. 2022. Managing biological invasions: the cost of inaction. Biol Invasions (2022) 24:1927–1946 https://doi.org/10.1007/s10530-022-02755-0

Cuthbert, R.N., C. Diagne, E.J. Hudgins, A. Turbelin, D.A. Ahmed, C. Albert, T.W. Bodey, E. Briski, F. Essl, P. J. Haubrock, R.E. Gozlan, N. Kirichenko, M. Kourantidou, A.M. Kramer, F. Courchamp. 2022. Bioinvasion costs reveal insufficient proactive management worldwide. Science of The Total Environment Volume 819, 1 May 2022, 153404

Moodley, D., E. Angulo, R.N. Cuthbert, B. Leung, A. Turbelin, A. Novoa, M. Kourantidou, G. Heringer, P.J. Haubrock, D. Renault, M. Robuchon, J. Fantle-Lepczyk, F. Courchamp, C. Diagne. 2022. Surprisingly high economic costs of bioinvasions in protected areas. Biol Invasions. https://doi.org/10.1007/s10530-022-02732-7

Turbelin, A.J., C. Diagne, E.J. Hudgins, D. Moodley, M. Kourantidou, A. Novoa, P.J. Haubrock, C. Bernery, R.E. Gozlan, R.A. Francis, F. Courchamp. 2022. Introduction pathways of economically costly invasive alien species. Biol Invasions (2022) 24:2061–2079 https://doi.org/10.1007/s10530-022-02796-5

Williams, G.M., M.D. Ginzel, Z. Ma, D.C. Adams, F.T. Campbell, G.M. Lovett, M. Belén Pildain, K.F. Raffa, K.J.K. Gandhi, A. Santini, R.A. Sniezko, M.J. Wingfield, and P. Bonello 2022. The Global Forest Health Crisis: A Public Good Social Dilemma in Need of International Collective Action. Submitted

Posted by Faith Campbell

We welcome comments that supplement or correct factual information, suggest new approaches, or promote thoughtful consideration. We post comments that disagree with us — but not those we judge to be not civil or inflammatory.

For a detailed discussion of the policies and practices that have allowed these pests to enter and spread – and that do not promote effective restoration strategies – review the Fading Forests report at http://treeimprovement.utk.edu/FadingForests.htm

or

www.fadingforests.org

Funding APHIS & USFS in FY23 – Senate Recommendations

The Senate Appropriations Committee has adopted its recommendations for funding APHIS and the US Forest Service in Fiscal Year 2023, which begins on October 1. The full Senate has not yet acted; most people expect that it will not act before October, so the agencies will have to operate under a “continuing resolution” for at least the first several months. Under a “CR”, funding is maintained at the current level.

SOD-infected rhododendron plants detected by state officials in Indiana in 2019

Funding for APHIS in FY23

The Senate Appropriations Committee issued a report [available here] that recognizes APHIS’ objective of protecting the animal and plant resources of the Nation from diseases and pests. These objectives are carried out through, inter alia, Safeguarding and Emergency Preparedness/Response and Safe Trade and International Technical Assistance.

The Committee recommends the following funding for specific APHIS programs (in $millions)

PROGRAMFY22 FUNDINGFY23 ADMIN REQHOUSE $SENATE COMM RECOMMCISP ASK
Border inspections (AQI appropriated)33.84936.725 36.650X
Pest Detection28.21829.13729.82529.07530
Methods Development21.21721.85431.80723.55723
Specialty Crops209.533219.533219.698222.072219
Tree & Wood pests61.21762.85462.56262.71970
Subtotal, Plant health379.144385.560 397.603X
Emerg. Prepare & Response42.02144.242 44.317X

Specific programs mentioned:

  1. Northern (Asian) giant hornet eradication: $1.75 million to continue cooperation with Washington State to eradicate this pest; also to improve monitoring methods and lures, and build a rapid response platforms
  2. sudden oak death (SOD): recognize that the EU1 and NA1 strains of this pathogen threaten Douglas-fir / tanoak forests and lead foreign governments to impose quarantines on U.S. timber exports. So APHIS should spend no less that FY22 funding to better understand threat and treatment methods in wildlands. This earmark disappoints because it focuses on APHIS’ role as certifying timber exports as pest-free rather than the spread of the pathogen within the U.S. via the nursery trade. The same language appears in the report’s discussion of the Agriculture Research Service (see below).

Pertinent action re: Agriculture Research Service

The Senate Committee report sets several priorities, including the following:

  1. Invasive Pests: The Committee is concerned about the threats invasive pests pose to agriculture, the economy, environment, human health, and national security of the Pacific region. The Committee directs ARS to continue working with stakeholders in the region to assess options for combatting invasive species, including biocontrol research facilities, containment facilities, additional laboratory space.
  2. Sudden oak death: the same language as for APHIS. Again, I wish the language referred to the pathogen’s spread via the nursery trade.

These numbers are disappointing; the increase for “specialty crops” demonstrates the lobbying clout of the nursery and berry industries! I appreciate the attention to sudden oak death – with the caveat I mentioned.

SOD-infected tanoaks in southern Oregon; photo by Oregon Department of Forstry

Forest Service

The Senate Appropriations Committee issued a report [available here] . The Senate Appropriations Committee recommends the following funding levels for USFS programs that address non-native forest pests and other invasive species (in $millions):

PROGRAMFY22 FUNDINGFY ADMIN REQUESTHOUSE $S COMM RECOMMCISP ASK
Research296.616317.733$360.4$302.773317.733
State & Private Forest Health Protection TOTAL4859.232$52.2325083
S&P FHP Federal lands16,00022,485?17,00051
S&P FHP non-federal lands32,00036,747?33,00032

R&D

The Senate wants to retain the current structure of five regional stations, International Institute of Tropical Forestry, and Forest Products Laboratory.

The Senate listed several research priorities. Two pertain to forest health: 1) needle pathogens, and 2) Northeastern States Research Cooperative working to sustain the health of northern forest ecosystems and biological diversity management. I am disappointed that no mention is made of the need to respond to 400 introduced tree-killing insects and pathogens.

planting to test ash trees’ resistance to emerald ash borer; photo courtesy of Jennifer Koch, USFS

S&P

The Senate Committee recommends a significant increase in S&P overall ($8 million above FY22 level), but not for Forest Health Management. This is disappointing.

The Committee is concerned about high tree mortality on National Forests due to bark beetle infestations and instructs USFS to work with states and tribes to prioritize insect prevention, suppression & mitigation projects.

The Committee expects the Forest Service and Bureau of Land Management (BLM) to continue efforts to treat sudden oak death in California and Oregon. It provides $3 million for this purpose, including for partnerships with private landowners.

Posted by Faith Campbell

We welcome comments that supplement or correct factual information, suggest new approaches, or promote thoughtful consideration. We post comments that disagree with us — but not those we judge to be not civil or inflammatory.

For a detailed discussion of the policies and practices that have allowed these pests to enter and spread – and that do not promote effective restoration strategies – review the Fading Forests report at http://treeimprovement.utk.edu/FadingForests.htm

or

www.fadingforests.org

Urgent Update on Beech Leaf Disease

banding symptoms of beech leaf disease; photo by Dr. Chagas de Freitas, Ohio State

Experts on beech leaf disease (BLD) hold conference calls every two months. I reported on the May meeting earlier in July. The July conference call of the experts emphasized not only the alarming spread of the disease but also the dilemmas frustrating efforts to slow its spread and protect beech.

Jerry Carlson, chief of forest health protection for the New York Department of Environmental Conservation called beech leaf disease “the next chestnut blight.

Yet forestry, plant health, and conservation entities have been slow to support research needed to develop protective measures.

As was noted by participants, 10 years after scientists from Lake MetroParks (in Cleveland) first detected disease symptoms, scientists still are unsure about all aspects of BLD and how it spreads. Experts agree that the nematode (Litylenchus crenatae ssp mccannii) must be present to initiate the disease. Other possible factors, especially fungi in the genus Colletotrichum, appear to play important roles in causing the symptoms.

The lack of clarity about the causal agent means that USDA APHIS has not recognized the disease as a priority species for tracking. APHIS has provided some funds. However, scientists seeking to obtain funding through the Plant Pest and Disease Management and Disaster Prevention Program [laid out in the Plant Protection Act’s Section 7721] can’t get traction. Other funding sources also don’t quite fit. For example, the National Science Foundation funds basic, hypothesis-driven, research – not the more applied science needed to address BLD. Some participants wondered whether funding might be sought from wildlife-oriented sources, since beech are so important in providing hard mast, den and nest sites, etc., for a variety of wildlife.

Participants discussed ways to raise awareness – and alarm – in order to build a broader coalition. This effort should include Europe. Although the disease has not yet been detected in Europe, the native beech is vulnerable.

European beech in Rhode Island infected by BLD; photo by Dr. Nathaniel A. Mitkowski, University of Rhode Island

Data indicate that the disease is now significantly more widespread than was known last year. That is, BLD is more widespread from New York to Maine, with New Hampshire reporting its first detection. To the west, BLD has been detected in Michigan and in a forest fragment in western Ohio (near Toledo). Disease severity has also intensified. Of course, the disease is present at least a year before it is detected because leaf symptoms appear in the spring following infection. Therefore its presence is probably wider.

map of BLD presence as of early July 2022 (some states have not yet reported); note the many counties in fuschia – 2022 detections

While mortality of mature beech is still rarely documented, this might be related to difficulties determining the cause of mortality during standard forest health surveys. Participants discussed how to rectify this situation.

Meanwhile, concern is rising – as reflected in Dr. Carlson’s statement.

You can help by asking your state and national officials and conservation organizations to support applied research aimed at clarifying how the disease spreads, what ecological conditions are conducive to disease, improved detection and prediction tools, and possible containment strategies. Let’s overcome the roadblocks impeding protection of this magnificent and ecologically vital tree species.

Is this not worth protecting?

Posted by Faith Campbell

We welcome comments that supplement or correct factual information, suggest new approaches, or promote thoughtful consideration. We post comments that disagree with us — but not those we judge to be not civil or inflammatory.

For a detailed discussion of the policies and practices that have allowed these pests to enter and spread – and that do not promote effective restoration strategies – review the Fading Forests report at http://treeimprovement.utk.edu/FadingForests.htm

or

www.fadingforests.org

Funding APHIS & USFS – speak up!

To forest pest mavens:

The House Appropriations Committee has acted on funding for APHIS & USFS in Fiscal Year (FY) 23 – which begins on October 1. While several programs have been funded at an adequate level, funding for others – e.g., APHIS’ “Tree & Wood Pests) still falls short. Please contact your senators and ask them to urge members of the Senate Appropriations Committee to increase funding for this program. Members of the Senate Agriculture and Interior Appropriations subcommittees (those with jurisdiction) are listed at the end of this blog. My rationale for the “asks” are in my earlier blog.

APHIS funding in $ millions

ProgramFY 2021 (millions)FY 2022  enactedFY 2023 Pres’ requestOur askHouse bill
Tree & Wood Pests$60.456$61.217$62.854$70$62.562
Specialty Crops$196.553$209.553$219.533$219$219.698
Pest Detection$27.733$28.218$29.854$30$29.825
Methods Development$20.844$21.217$21.854$23$31.807

The House bill provides significant funding for many traditional agricultural concerns – livestock health, cotton pests, citrus diseases and pests. Programs we lobbied for received less than the Administration requested with the exceptions of Methods Development and Specialty Crops. I found no explanation for the $10 million increase for methods development.

The Committee Report specifies increases for several pests under Specialty Crops, e.g., citrus and grapes. The report also specifies that $18.3 million should be spent to control spotted lanternfly, which is a pest of both agriculture (especially grapes) and forests. The Committee asks APHIS to keep it informed about progress tackling this pest. (Rep. Andy Harris, ranking Republican on the Agriculture Appropriations subcommittee, has an active SLF infestation in his district.)

The report also instructs APHIS to maintain funding for Asian longhorned beetle at previous levels – within the Tree & Wood Pest account. This means that any savings arising from APHIS’ declaration that parts of the Ohio infestation have eradicated must still be spent on this pest. There are several outbreaks where such funds might be spent, including in New York, Massachusetts, remaining areas in Ohio, and South Carolina.

As in past years, the House Report reiterates members’ expectation that the USDA Secretary will use the authority provided in this bill to transfer funds from the USDA Commodity Credit Corporation to obtain funds to address animal and plant pest emergencies that threaten American agriculture. The Committee has appropriated additional money which is intended to enhance, not replace, use of CCC funds. [The Office of Management and Budget has severely curtailed APHIS access to emergency funds.]

=======================

The House Committee has asked that USFS develop a research program that reflects priorities on, inter alia, invasive species. This falls short of my request for earmarking a specific (small) percentage of research funding for invasive species, but it does show Congressional interest in this problem.

one of the diseases needing USFS research: beech leaf disease (photo by Dr. Chagas de Freitas)

In the part of the budget that funds actual management work, Forest Health Management, apparently the $52 million appropriation reflects only a modest increase of funding for managing invasive species everywhere – on federal lands, i.e. National forests and non-federal lands, i.e., “coop” lands. I appreciate the attention to invasive species, especially emerald ash borer; but worry about allocating most funding to managing the impacts rather than pro-actively addressing introduction and spread to new areas.

USFS funding in $ millions

ProgramFY 2021FY 2022  enactedFY 2023 Pres’ requestMy askHouse bill
R&D $296.6$317.8$317.8$360.4
[FIA]    $37.7 ($15 M increase)
S&P FHM$46,232same?$59.232$82$52.232
      

Research & Development – The Committee Report noted members’ interest in funding specific laboratories, programs, & projects, including several listed areas. The Committee expects USFS to develop a research program that reflects members’ priorities & other priorities critical to forest health, particularly with respect to climate change adaptation, preventing spread of insects and diseases, and watershed improvement

The report states several times that the USFS should assist in control of the emerald ash borer and other invasive pests, especially in areas where ash tree mortality has been high. Such statements are under State and Private Forestry, under both the Forest Health Management and Urban and Community Forests programs. The Committee earmarks $4 million under UCF for management & reforestation – including tree planting & removals — in communities most severely impacted by EAB and other pests. The efforts should prioritize regional, multi-organization collaborations in urban communities most severely impacted by invasive pests like EAB. The committee asks for a report from USFS on major invasive species and progress of remediation and replanting programs.

===========================

Key Members of the Senate Appropriations Committee

STATEMEMBERAPHIS APPROPUSFS APPROP
AKLisa Murkowski X
CalifDiane FeinsteinXX
FLMarco Rubio X
HIBrian SchatzX 
INMike BraunX 
KSJerry MoranX 
KYMitch McConnellXX
MDChris Van Hollen X
MESusan CollinsX 
MSCindy Hyde-SmithXX
MORoy BluntXX
MTJon TesterXX
NDJohn HoevenX 
NMMartin HeinrichXX
ORJeff MerkleyXX
RIJack Reed X
TNBill Hagerty X
VTPatrick LeahyXX
WVShelly Moore Capito X
WITammy BaldwinX 

Posted by Faith Campbell

We welcome comments that supplement or correct factual information, suggest new approaches, or promote thoughtful consideration. We post comments that disagree with us — but not those we judge to be not civil or inflammatory.

For a detailed discussion of the policies and practices that have allowed these pests to enter and spread – and that do not promote effective restoration strategies – review the Fading Forests report at http://treeimprovement.utk.edu/FadingForests.htm

or

www.fadingforests.org

Updates on 1) hemlocks 2) shot hole borers/Fusarium & 3) beech leaf disease

symptoms of beech leaf disease; photo by Dr. Chagas de Freitas

Three webinars during April and May provided updates on efforts to address three non-native, tree-killing pests: hemlock woolly adelgid (HWA), link invasive shot hole borers (ISHB), link and beech leaf disease (BLD) link. I attended each and summarize here.  

  1. Hemlock conservation in North Carolina  – the NC Hemlock Restoration Initiative (HRI) see SaveHemlocksNC.org  

The webinar was recorded at Hope for the Hemlocks: HWA Management Approaches on Public and Private Lands in North Carolina.  You probably need to be a member of the Natural Areas Association to watch the archived version.

I was pleased to learn about the major effort under way in North Carolina, where eastern and Carolina hemlocks are extremely important components of multiple ecosystems. In 2013, the Commissioner of Agriculture decided to make protecting hemlocks a signature project. He wanted to ensure that three state agencies – the Forest Service, Wildlife Department, and State Parks – worked together to improve the efficacy of treating trees. (Treatments available at the time were expensive and time-consuming.)

HRI treatment at Conestee Falls; HRI photo

Thom Green described the result: North Carolina’s Hemlock Restoration Initiative (HRI). The initiative is administered by the Western North Carolina Communities – a non-governmental organization with strong connections to rural communities and a history of successful collaborative projects that support agriculture and forestry. It engages state agencies, local and county governments, local NGOs, and federal agencies and works on both public and private lands with the goal of ensuring that hemlocks can survive to maturity.

HRI staff work with local partners to identify priority hemlock conservation areas (HCAs). It then sends a “strike team” to guide the partners in treating as many trees as possible. (North Carolina allows non-licensed volunteers to apply pesticides under supervision; also, landowners can treat trees on their own property.) These collaborative projects can treat up to 1,000 trees per day.

The chemicals used are imidacloprid and, where poor tree health justifies emergency treatment, dinotefuran. These are usually applied as a soil drench because it is easier for people to transport the equipment into the woods. Bark spray is used in sensitive areas. They have found that imidacloprid provides five to seven years of protection. A new product, CoreTech, is even easier to transport and works much faster than imidacloprid, however, it costs more.

The HRI believes it is minimizing non-target impacts of the neonictenoid imidacloprid because:

  • hemlocks are pollinated by wind, not insects
    • hemlocks don’t exude resins that attract insects
    • pesticide applications are tightly targetted at the base of trunk, with 10-foot setbacks from water
    • long intervals between treatments (5 – 7 years) allow soil invertebrates to recover

The program has treated 100,000 trees between 2016 and 2021 on state and private lands. Now they are starting the second round of treatments for trees treated at the beginning of the program.

Treatment priorities are based primarily on the extent to which the trees are able to take up the chemical, evaluated by the percentage of the crown that is alive and the density of foliage. Since imidacloprid can take a year to reach the canopy of a mature tree, it is used only on trees with greater than half the crown rated as healthy. When trees have a lower status, dinotefuran is added (because it can reach the canopy within weeks).  Trees with less than 30% live crown are not treated.

The Initiative also supports biocontrol programs. It has assisted releases of Laricobius nigrinis (a beetle in the family Derodontidae) and helps volunteers monitor releases and survival. Dr. Green reports that L. nigrinis has spread almost throughout western North Carolina but that questions remain regarding its impact on tree health. He thinks biocontrol is not yet reliable as stand-alone tool; success will require a suite of predatory insects.

Forest Restoration Alliance potting hemlock seedlings; HRI photo

The HRI measures the success of various treatments (Hurray!). “Impact plots” are established at the start of treatment. Staff or volunteers return every three years to monitor all aspects of the health of a few designated trees – including untreated ones. So far, they have seen encouraging responses in crown density and new growth.

  • Invasive Shot Hole Borers (ISHB) in California

See www.ishb.org and video recordings of the meeting at:  

https://youtu.be/RyqJYyLkshk (Day 1); and https://youtu.be/kWmtcbjTczw (Day 2)

A host of scientists from California spent two full days describing research and management projects funded by specific state legislation – Assembly Bill (AB)-2470 on two invasive shot hole borers.

Adoption of this legislation resulted largely from lobbying by John Kabashima. Additional funding was provided by CalFire (the state’s forestry agency). The agency responsible for managing invasive species – California Department of Food and Agriculture (CDFA) had designated these organisms as not a threat to agriculture. So it did not fund many necessary activities.

The Problem and Where It Is

“Fusarium dieback” is the disease caused by this insect-pathogen complex. The insects involved are two ambrosia beetles in the Euwallacea genus – the polyphagous (E. whitfordiodendrus) and Kuroshio (E. Kuroshio) shot hole borers. link to DMFAccording to Dr. Bea Nabua-Behermann, Urban Forestry and Natural Resources Advisor with University of California Cooperative Extension (UCCE), other fungi are present on both beetle species but its matching Fusarium sp. is the principal associated fungus and is required for the beetle’s reproduction. These are Fusarium euwallaceae and F. kuroshium.

As of spring 2022, the beetle/fungus complex has spread as far north as Santa Barbara /Santa Clarita; and inland to San Bernardino and Riverside (see the map here). They are very widespread in Orange and San Diego counties. At least 65 tree species in southern California are reproductive hosts (globally, it is 77 species; see full list here). The preferred and most succeptible hosts are several species in the Acer, Parkinsonia, Platanus, Quercus, and Salix genera. Box elder (A. negundo) is so susceptible that it is considered a sentinel tree.

Because the beetles spend most of their life inside trees, their life cycle leaves few opportunities to combat them. Females (only) fly but tend to bore galleries on their natal tree. Several speakers on the webinar said management should focus on heavily infested “amplifier trees”. Much spread is human assisted since the beetles can survive in dead wood for months if it is damp enough for the fungus.  Possible vectors are green waste, firewood, and even large wood chips or mulch.

Management – from Trapping to Rapid Response to Restoration

Akiv Eskalen of University of California Davis discussed trapping and monitoring techniques to confirm presence of the insect and pathogen. Also, he talked about setting priorities for treating trees based on the presence of reproductive hosts, host value, infestation level, and whether the trees pose a safety hazard. The disease causes too little damage to some hosts to warrant management. He emphasized the importance of preventing spread. This requires close monitoring of infested trees to see whether beetles move to neighbors. Dr. Eskalen described a major and intensive monitoring and treatment program at Disneyland. The 600 acres of parks, hotels, and parking lots have ~16,000 trees belonging to 681 species.

Several speakers described on-going efforts in Orange County. Danny Hirchag (IPM manager for Orange County Parks) described how his agency is managing 60,000 acres of variable woodlands containing 42,000 trees, of which 55% are hosts of ISHB and their associated fungi. Of greatest concern are California sycamore and coast live oak in areas of heavy public use. The highest priority is protecting public safety; next is protecting historic trees (which can’t be replaced); third is minimizing impacts to ecosystem services. Orange County Parks is currently removing fewer than 50 trees each year. Hirchag noted the importance of collaborating in the research trials conducted by the University of California Cooperative Extension.

infested California sycamore; photo by Bea Nabua-Behermann

Maximiliano Regis and Rachel Burnap, of County of Los Angeles Department of Agricultural Commissioner/Weights and Measures, described Los Angeles County’s efforts more broadly. The challenge is clear: LA County has more than 160 parks. In 2021, they placed nearly 2,500 traps, mapped infected trees, carried out on-ground surveys to find amplifier trees, removed both amplifier and hazard trees (using funds provided by CalFire), and educated the public. Their efforts were guided by an early detection-rapid response (ED/RR) Plan (2019) developed by Rosi Dagit (see below). While London plane trees (Platanus hispanica) and California sycamores (Platanus racemose) were initially most affected, now black locusts (Robinia pseudoacacia) and box elders (Acer negundo) are succumbing. [Note: both are widespread across North America.] The researchers are trying to determine why some areas are largely untouched, despite the presence of the same tree species. Regis and Burnap noted the increasing difficulty getting confirmation of the pathogen’s presence because laboratories are overwhelmed. They continue looking for funding sources.

Rosi Dagit, Senior Conservation Biologist, Resource Conservation District of the Santa Monica Mountains, described the creation of that ED/RR system for Los Angeles County as a whole, without regard for property lines. Participants established random study plots across the entire Santa Monica Mountains Natural Recreation Area (NRA), based on proximity to areas of particularly sensitive ecological concerns. The fact that the NRA’s forests are aging and that the risk of infestations is especially high in riparian forests helped persuade policy-makers to fund the effort. The accompanying rapid response plan informs everyone about what to do, who should do it, and who pays. This information incorporates agencies’ rules about what and where to plant. It also provides measures to evaluate whether the action was effective. It did take more than two years for the county to set staffing needs etc.

John Kabashima link discussed his criteria for replanting and ecosystem restoration following tree removal in the southern California region. He recommends prompt removal of amplifier trees – especially box elder and California sycamore. He relies on replanting guidance developed by UC-Irvine (which is on the website) – especially avoiding monocultures. Kabashima reiterated the importance of close monitoring to track beetle populations and responding quickly if they build up.

Economics of Urban Forests and Cities Most at Risk

Karen Jetter (an economist at the UC Agriculture Issues Center) has developed a model to compare the costs of an early detection program to the environmental and monetary costs of infestation by Fusarium disease.  She noted that early detection and monitoring programs are often hard to justify because — when they are successful — nothing changes! She found that averted or delayed costs (including tree removals, lost ecosystem services, lost landscape asset value [replanting value] and the cost to replant) always far exceeded the cost of monitoring programs. Unfortunately, a written report about this effort (Jetter, K., A. Hollander, B.E. Nobua-Behrmann, N. Love, S. Lynch, E. Teach, N. Van Dorne, J. Kabashima, and J. Thorne. 2022. Bioeconomic Modeling of Invasive Species Management in Urban Forests; Final Report)   appears to be available only through the University of California “collaborative tools” website dedicated to practitioners and stakeholders engaged on ISHB issues. If you are not a member of the list, contact me using the comment button and ask that I send it to you. Include your email address (the comment process makes determining emails difficult if not impossible.)

Shannon Lynch (UC Davis) developed a model to estimate vulnerability of urban areas based on phylogenetic structure (relationship between tree species), host abundance, and number of beetle generations/year (linked to temperature). She found that areas with less favorable host communities can become vulnerable if the climate becomes favorable. Where the host community is already favorable, climate not important.

She evaluated 170 California cities based on their tree inventories. The cities at highest risk were San Diego, Los Angeles, the San Francisco Bay area, and the Central Valley – e.g., Sacramento. For areas lacking tree inventories, she based her risk determination on the estimated number of generations of beetles per year – based on climate. This analysis posited a very high risk in the eastern half of southern California and the Central Valley. Participants all recognized the need to apply this model to cities in Arizona and Nevada.

Possible Management Strategies

Shannon Lynch (UC Davis) studied whether endophytes might be used to kill the Fusarium fungi. She reported finding 771 fungal strains and 657 bacterial strains in tree microbiomes. Some of the fungal isolates impeded growth of the Fusarium fungi in a petri dish. She began testing whether these fungi can be used to inoculate cuttings that are to be used for restoration. She also planned to test more endophytes, and more native plant species to explore creation of a multi-fungus cocktail.

Richard Stouthamer of UC Riverside is exploring possible biocontrol agents. Of three he has evaluated, the most promising is Phasmastichus sp., which is new to science. He is still trying to establish laboratory cultures so he can test its host specificity.

See bldresearch@lists.osu.edu

symptoms of beech leaf disease; photo by Dr. Chagas de Freitas

At this meeting, scientists described research aimed at improving basic understanding of beech leaf disease’s causal agents, its mechanisms of spread, etc.  Their findings are mostly preliminary.

These findings are of greatest importance now:

  • presence of the nematodes varies considerably across leaf surface – if one collects samples from the wrong site on leaf, one won’t detect nematode (Paulo Vieria, Agriculture Research Service)
    • developing predictive risk maps that combines temperature, humidity, elevation, soils (Ersan Selvi, Ohio State). So far, he has found that BLD is greater in humid areas – including under closed forest canopies. The USFS is funding studies aimed at incorporating disease severity in detection apps.
    • determining extent of nematode presence. Sharon Reed of Ontario has found nematode DNA in trap fluids throughout the Province. It is much more common at known disease sites. Reed is also studying the presence of arthropods on beech leaves and buds.

Longer term findings and questions

  • possible vectors:
    • nematode DNA has been detected from birds – although it is not clear whether the DNA came from bird  feces, feathers, or dust (DK Martin)
    • a few live nematodes have been extracted from the excrement of caterpillars that fed on infected leaves (Mihail Kantor, ARS)
    • nematode damage to leaves:
      • presence of the nematode in leaf buds before they open (Vieria and Joe Mowery, both ARS). The nematode can create considerable damage in leaf buds before they open. Nematodes are present as early as October of the preceding year.
      • damage to leaves by nematode (Mowery, ARS) Leaf epidermal cells are distorted, stomata blocked, chlorobasts are larger than normal, irregular shape
    • possible management tools
      • are there parasites that might attack the nematode? (Paulo Vieria, ARS)
      • experimental treatment of infested trees using phosphite (Kandor, ARS)
    • ecology: how do root microbiomes compare on infested and healthy trees? (Caleb Kime, Ohio State; and David Burke, Vice President for Science at Holden Arboretum)
infested European beech in Rhode Island; photo by Dr. Nathanial A. Mitkowski

Posted by Faith Campbell

We welcome comments that supplement or correct factual information, suggest new approaches, or promote thoughtful consideration. We post comments that disagree with us — but not those we judge to be not civil or inflammatory.

For a detailed discussion of the policies and practices that have allowed these pests to enter and spread – and that do not promote effective restoration strategies – review the Fading Forests report at http://treeimprovement.utk.edu/FadingForests.htm

or

www.fadingforests.org

Invasions cost protected areas more than $22 billion in 35 years

Burmese python in Everglades National Park; photo by Bob Reed, US FWS

Scientists continue to apply data collected in an international database (InvaCost; see “methods” section of Cuthbert et al.; full citation at end of this blog) to estimate the economic costs associated with invasive alien species (IAS). These sources reported $22.24 billion in economic costs of bioinvasion in protected areas over the 35-year period 1975 – 2020. Because the data has significant gaps, no doubt invasions really cost much more.

Moodley et al. 2022 (full citation at end of this blog) attempt to apply these data to analyze economic costs in protected areas. As they note, protected areas are a pillar of global biodiversity conservation. So it is important to understand the extent to which bioinvasion threatens this purpose. 

Unfortunately, the data are still too scant to support any conclusions. Such distortions are acknowledged by Moodley et al. I will discuss the data gaps below a summary of the study’s findings.

The Details

Of the estimated $22.24 billion, only 4% were observed costs; 96% were “potential” costs (= extrapolated or predicted based on models). Both had generally increased in more recent years, especially “potential” costs after 1995. As is true in other analyses of InvaCost data, the great majority (73%) of observed costs covered management efforts rather than losses due to impacts. The 24% of total costs ascribed to losses, or damage, exceeded the authors’ expectation. They had thought that the minimal presence of human infrastructure inside protected areas would result in low records of “economic” damages.

The great majority (83%) of reported management costs were reactive, that is, undertaken after the invasion had occurred. In terrestrial environments, there were significantly higher bioinvasion costs inside protected areas than outside (although this varied by continent). However, when considering predicted or modelled costs, the importance was reversed: expected management costs represented only 5% while these “potential” damages were 94%.

Higher expenditures were reported in more developed countries – which have more resources to allocate and are better able to carry out research documenting both damage and effort. 

More than 80% of management costs were shouldered by governmental services and/or official organizations (e.g. conservation agencies, forest services, or associations). The “agriculture” and “public and social welfare” sectors sustained 60% of observed “damage” and 89% of “mixed damage and management” costs respectively. The “environmental” and “public and social welfare” sectors together accounted for 94% of all the “potential” costs (predicted based on models) generated by invasive species in protected areas; 99% of damage costs. With the partial exception of the agricultural sector, the economic sectors that contribute the most to movement to invasive species are spared from carrying the resulting costs.

Lord Howe Island, Australia; threatened by myrtle rust; photo by Robert Whyte, via Flickr

Invasive plants dominated by numbers of published reports – 64% of reports of observed costs, 79% of reports of “potential”. However, both actual and “potential” costs allotted to plant invasions were much lower than for vertebrates and invertebrates. Mammals and insects dominated observed animal costs.

It is often asserted that protected areas are less vulnerable to bioinvasion because of the relative absence of human activity. Moodley et al. suggest the contrary: that protected areas might be more vulnerable to bioinvasion because they often host a larger proportion of native, endemic and threatened species less adapted to anthropogenic disturbances. Of course, no place on Earth is free of anthropogenic influences; this was true even before climate change became an overriding threat. Plenty of U.S. National parks and wilderness areas have suffered invasion by species that are causing significant change (see, for example, here, here, and here).

Despite Best Efforts, Data are Scant and Skewed

Economic data on invasive species in protected areas were available for only a tiny proportion of these sites — 55 out of 266,561 protected areas.

As Moodley et al. state, their study was hampered by several data gaps:

  1. Taxonomic bias – plants are both more frequently studied and managed in protected areas, but their reported observed costs are substantially lower than those of either mammals or insects.
  2. The data relate to economic rather than ecological effects. The costliest species economically might not cause the greatest ecological harm.
  3. Geographical bias – studies are more plentiful in the Americas and Pacific Islands. However, studies from Europe, Africa and South America more often report observed costs. The South African attention to invasive species (see blogs here, here, and here), and economic importance of tourism to the Galápagos Islands exacerbate these data biases.
  4. Methodological bias – although reporting bioinvasion costs has steadily increased, it is still erratic and dominated by “potential” costs = predictions, models or simulations.

I note that, in addition, individual examples of high-cost invasive species are not representative. The highest costs reported pertained to one agricultural pest (mango beetle) and one human health threat (mosquitoes).

Great Smokey Mountains National Park; threatened by mammals (pigs), forest pests, worms, invasive plants … Photo by Domenico Convertini via Flickr

As these weaknesses demonstrate, a significant need remains for increased attention to the economic aspects of bioinvasion – especially since political leaders pay so much greater attention to economics than to other metrics. However, the reported costs – $22.24 billion over 35 years, and growing! – are sufficient in the view of Moodley et al. to support advocating investment of more resources in invasive species management in protected areas, including – or especially – it is not quite clear — preventative measures.

SOURCES

Cuthbert, R.N., C Diagne, E.J. Hudgins, A. Turbelin, D.A. Ahmed, C. Albert, T.W. Bodey, E. Briski, F. Essl, P.J. Haubrock, R.E. Gozlan, N. Kirichenko, M. Kourantidou, A.M. Kramer, F. Courchamp. 2022. Bioinvasion cost reveals insufficient proactive management worldwide. Science of The Total Environment Volume 819, 1 May, 2022, 153404

Moodley, D., E. Angulo, R.N. Cuthbert, B. Leung, A. Turbelin, A. Novoa, M. Kourantidou, G. Heringer, P.J. Haubrock, D. Renault, M. Robuchon, J. Fantle-Lepczyk, F. Courchamp, C. Diagne. 2022.  Surprisingly high economic costs of bioinvasions in protected areas. Biol Invasions. https://doi.org/10.1007/s10530-022-02732-7

Posted by Faith Campbell

We welcome comments that supplement or correct factual information, suggest new approaches, or promote thoughtful consideration. We post comments that disagree with us — but not those we judge to be not civil or inflammatory.

For a detailed discussion of the policies and practices that have allowed these pests to enter and spread – and that do not promote effective restoration strategies – review the Fading Forests report at http://treeimprovement.utk.edu/FadingForests.htm

or www.fadingforests.org