Sudden Oak Death – two informative articles

I am alerting you to two publications about our “favorite” tree-killing pathogen, Phytopthora ramorum (sudden oak death).

SOD-infected rhododendron in a nursery in Indiana; photo by Indiana Department of Natural Resources

The Role of Nurseries in Spreading SOD

The first article informs the general public and raises important questions: “The Diseased Rhododendrons That Triggered a Federal Plant Hunt” by Ellie Shechet in The New Republic.

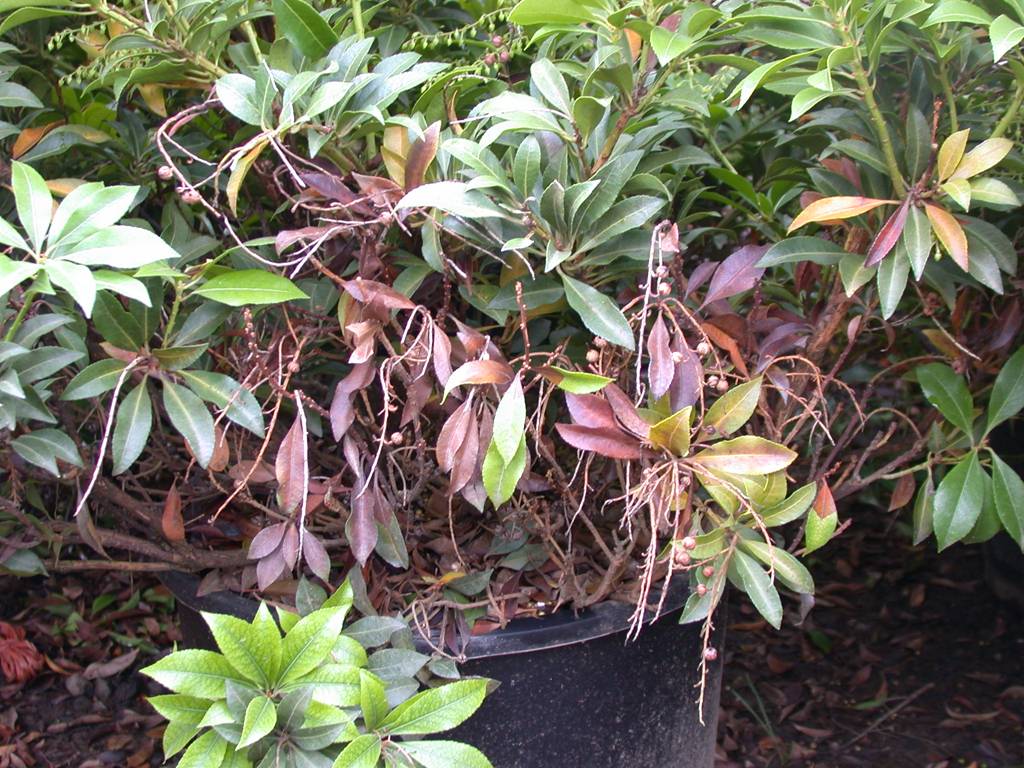
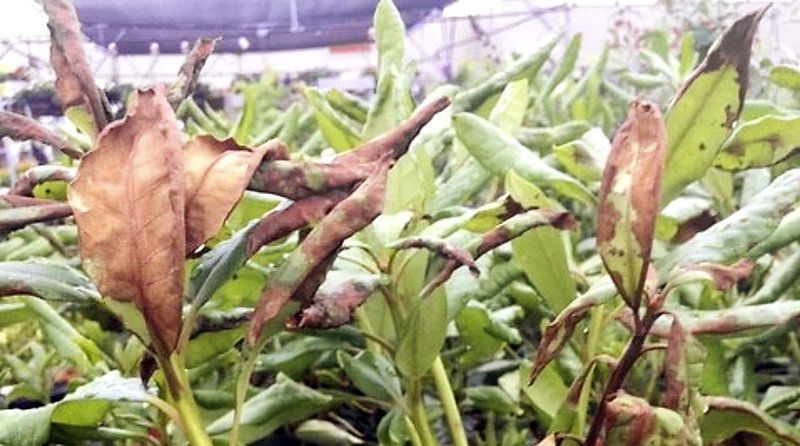
Ellie reviews the 2019 episode in which P. ramorum-infected rhododendron plants were shipped to retailers in the East and Midwest. Her article is based on interviews with state plant health and APHIS officials, several scientists and advocates (including me), and the executive director of the Oregon Association of Nurseries (OAN). Ellie notes that infected plants were found at more than 100 locations across 16 states.

Ellie notes that despite the risk to native plants in the eastern deciduous forest and the financial cost of implementing control actions (14 million plants were inspected in Washington State alone), plants have a “green” reputation; they are not recognized as potentially causing environmental harm.

The politics of the situation also are reviewed. She writes that the OAN representative has testified that he helped write the more relaxed regulatory approach that APHIS adopted by “federal order” in 2014 and formalized in changes to the regulations in 2019. APHIS denies this. [The article does not include the information that during this period, state regulatory officials detected P. ramorum-infected plants in between four and ten Oregon nurseries each year.] Ellie notes that individual consumers buying plants have few tools to try to ensure that plants they buy are not infected by SOD or other pathogens.

The fact is that the climate in the coastal areas of California, Oregon, Washington, and British Columbia is conducive to SOD, so the risk of diseased plants being produced there and sold is constant. The current APHIS regulations do not adequately address this, in my view!

Science: High Risk of Phytophthora Introductions from Southeast Asia

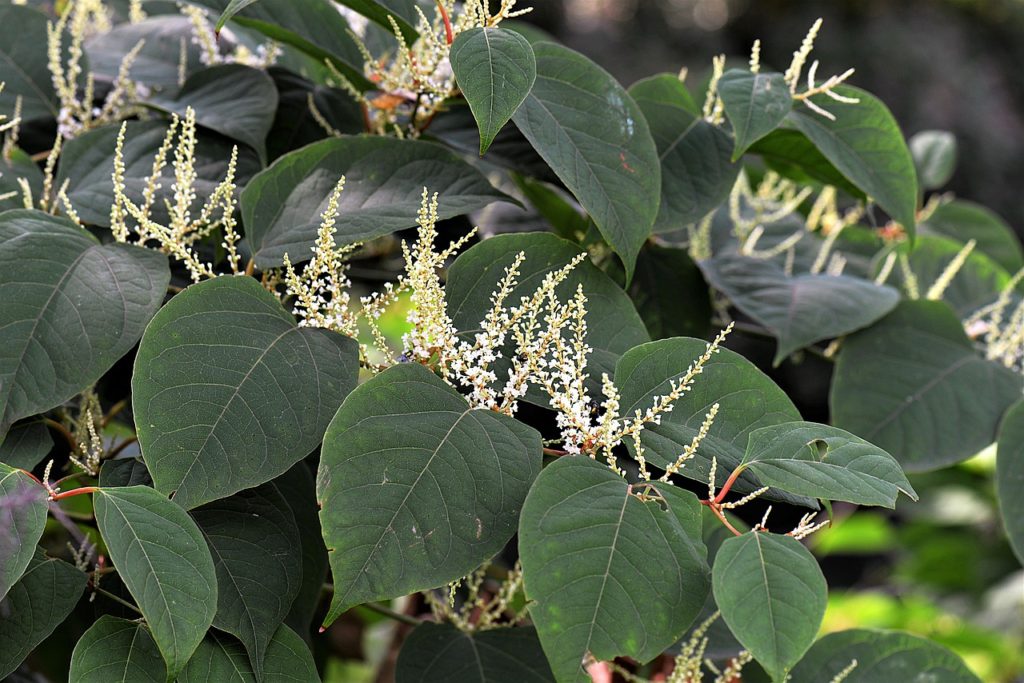
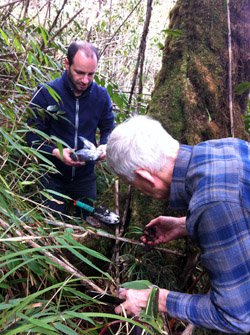
The second article reports results of intense scientific effort: Thomas Jung, Joan Webber, Clive Brasier, and other European plant pathologists report more completely on searches for P. ramorum and other Phytophthora species in East Asia. See the full citation at the end of this blog. [I blogged about their preliminary report a little over a year ago.] Jung et al. conclude that P. ramorum probably originates from the laurosilva forests growing in an arc from eastern Myanmar, across northern Laos, Vietnam, and southwestern China (Yunnan) to Shikoku & Kyushu islands in southwest Japan.  The article notes that two other Phytophtoras – P. lateralis (cause of fatal disease on Port-Orford cedar) and P. foliorum – appear to be from the same area.  Field science by this team has found 38 previously unknown Phytophthora species in these same forests – and expect that more are present.

Clive Brasier in Vietnam; UK Forestry Research

They warn that the lack of information about potential pathogens in many developing countries presents a high risk of introduction to naïve environments through burgeoning horticultural trade – especially since the World Trade Organization requires that a species be named and identified as posing a specific threat before phytosanitary regulations can be applied. [I addressed the issue of international phytosanitary rules in Fading Forests II; see the link at the end of the blog.]

Other Pathogen Risks from the Region

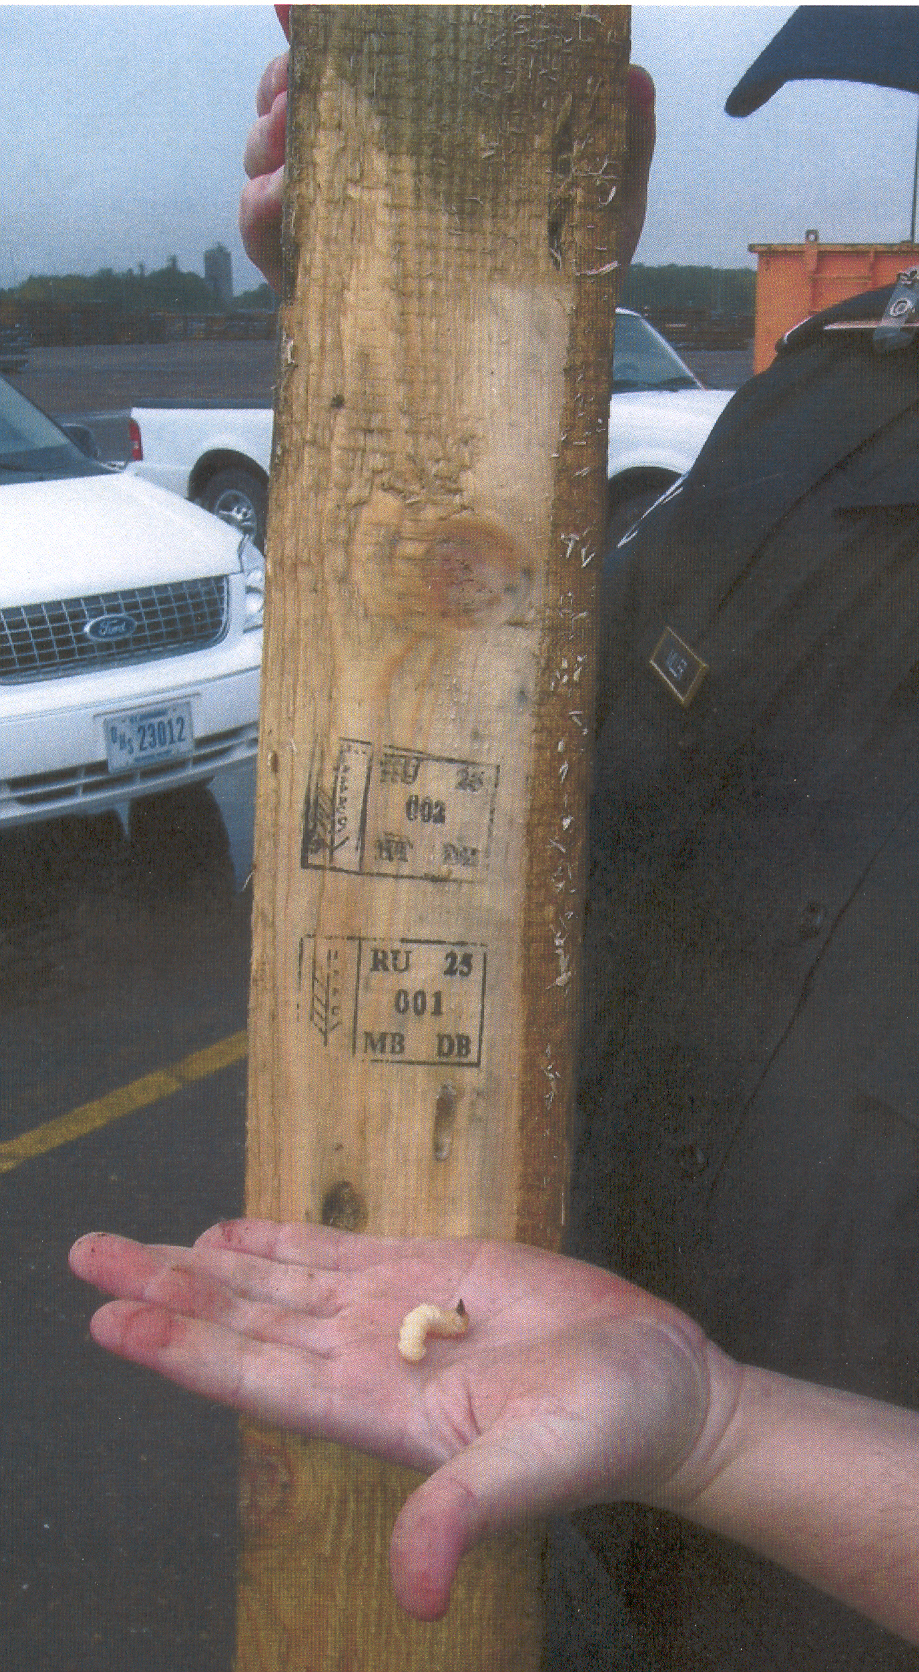
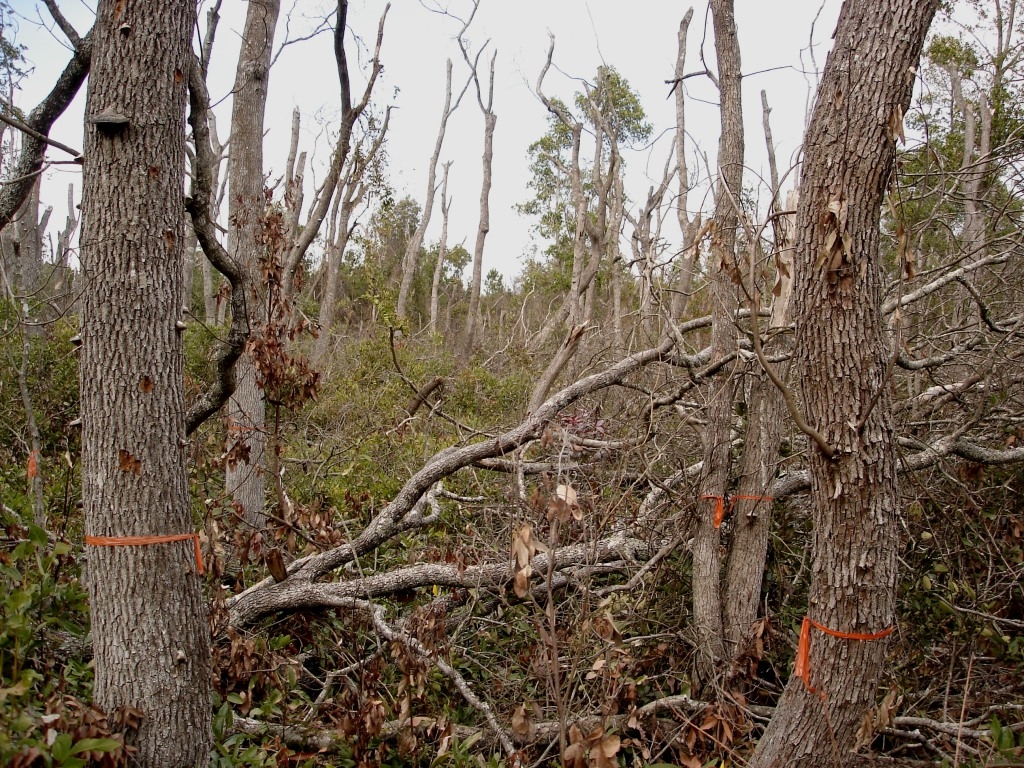
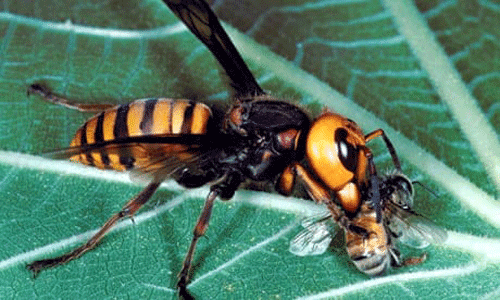
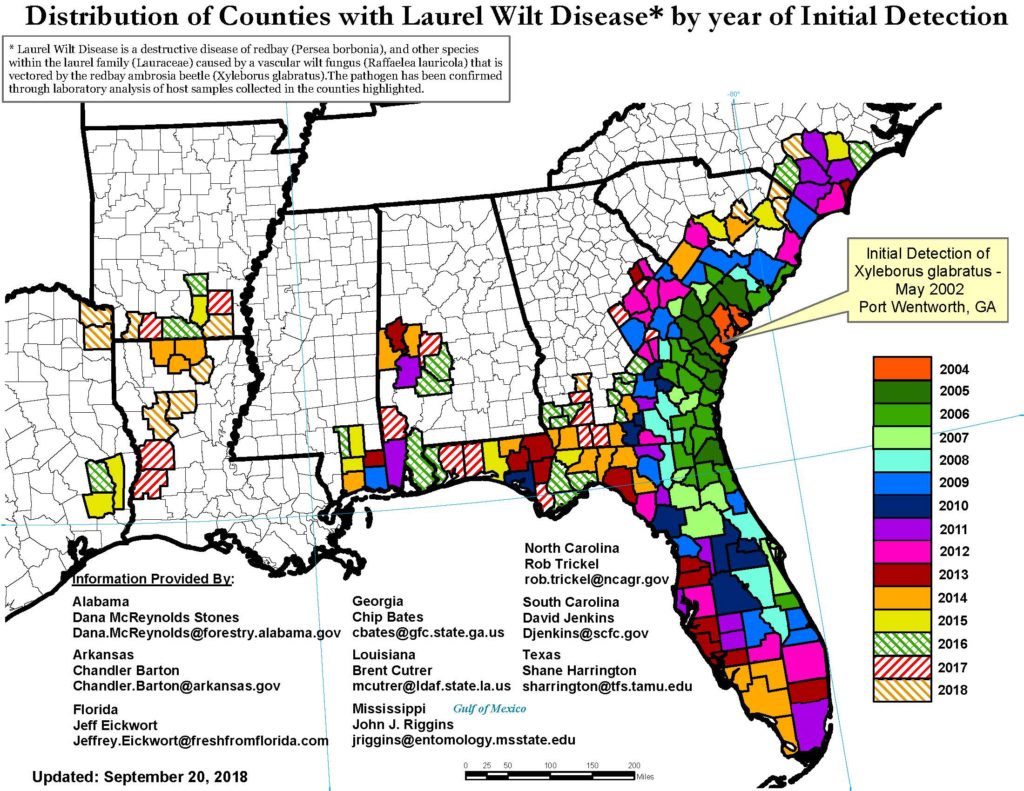
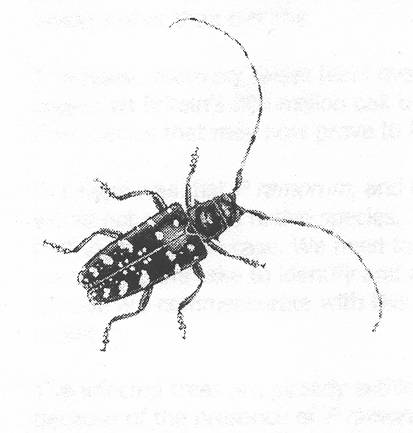
Phytophthoras transported on imported plants are not the only pathogens that could come from Asia. The vectors and associated pathogens causing laurel wilt disease across the Southeast and Fusarium disease in California are believed also to originate in the same region of Asia. Unlike the Phytophthoras, which are transported primarily through the trade in plants for planting, these fungi travel with the vector beetles in wood packaging material. U.S. imports of goods from Asia – often packaged in wooden crates or pallets – have skyrocketed since July 2020. The ports of Los Angeles-Long Beach, which receive 50% of U.S. imports from Asia, handled 6.3 million TEU (twenty-foot equivalent containers) from Asia during the period July 2020 through February 2021. The average of close to 800,000 TEU per month for eight consecutive months is unprecedented. Other ports also saw increased import volumes from Asia during this period. [I discussed these shifts in my blog in January.] Imports from Asia in 2020 accounted for 67.4% of total US imports from the world. Imports from China specifically accounted for 42.1% of total US imports. [Data on import volumes is from several reports posted by the Journal of Commerce at its website: https://www.joc.com/maritime-news/]

SOURCE

Jung, T.; Horta Jung, M.; Webber, J.F.; Kageyama, K.; Hieno, A.; Masuya, H.; Uematsu, S.; Pérez-Sierra, A.; Harris, A.R.; Forster, J.; et al.. The Destructive Tree Pathogen Phytophthora ramorum Originates from the Laurosilva Forests of East Asia. J. Fungi 2021, 7, 226. https://doi.org/10.3390/ open access!

Posted by Faith Campbell

We welcome comments that supplement or correct factual information, suggest new approaches, or promote thoughtful consideration. We post comments that disagree with us — but not those we judge to be not civil or inflammatory.

For a detailed discussion of the policies and practices that have allowed these pests to enter and spread – and that do not promote effective restoration strategies – review the Fading Forests report at http://treeimprovement.utk.edu/FadingForests.htm

Interior’s Invasive Species Plan: Let’s Implement It!

Posted by Scott J. Cameron, former Acting Assistant Secretary for Policy Management and Budget , US Department of the Interior

locations in Hawaii Volcanoes National Park where ohia trees were infected by rapid ohia death pathogen in 2017

In 2019 Congress passed the John D. Dingell, Jr. Conservation, Management, and Recreation Act. Among other things, it directed the Department of the Interior to “develop a strategic plan that will achieve, to the maximum extent practicable, a substantive annual net reduction of invasive species population or infested acreage on land or water managed by the Secretary.”  This provision triggered a year-long process of public involvement and inter-bureau coordination. The result was a plan published in January 2021.  It represents the first attempt by Interior at a Department-wide multi-taxa, multi-year approach to invasive species.  It has the potential to spur integration of invasive species work across the Department’s many bureaus and to focus each bureau’s efforts on a set of common goals, strategies, and performance metrics.

While Congress’ language is open-ended, any planning exercise is constrained by the most recent President’s budget and existing law.  It is up to those of us who are not, or at least no longer, executive branch employees to advocate for plans unbound by those constraints. 

In that spirit, I offer eight recommendations to improve invasive species management. Four are within existing authorities; four more are outside the current budgetary and statutory framework.  Many more ideas are without a doubt worth pursuing.

Opuntia (prickly pear) cactus – common plant in western National parks and on Bureau of Land Management lands; under threat by cactus moth

First, within existing funding and legal authorities, the Department has unfinished business that it can act on now.

  1. Secure approval of the package of categorical exclusions under the National Environmental Policy Act (NEPA) — now awaiting approval by the President’s Council on Environmental Quality (CEQ). Over many years agencies have documented how invasive species control improves, rather than harms, the environment.  Absent an applicable NEPA categorical exclusion approved by CEQ, though, each such action needs to run the time- and money-consuming gauntlet of NEPA compliance. In the meantime, the invasive plants germinate, the invasive animals reproduce, and what might have been a localized and inexpensive problem has expanded geographically and in terms of cost and complexity.  In the Fall of 2020 Interior submitted hundreds of pages of documentation on numerous practices proven to control invasive species without harming the environment.  Due to time and staffing constraints at CEQ, these categorical exclusions still await action.  Interior and CEQ should take prompt steps to finish them.
  • Allocate to the US Geological Survey at least $10 million of the roughly $90 million remaining available to the Secretary in CARES Act appropriations for research on invasive zoonotic diseases. These are diseases like COVID-19 and West Nile virus that can move from one species to another.  Many zoonotic diseases fit the definition of invasive species, since they are not native to the United States and endanger human health.  In the case of COVID-19 funding is available to the Secretary of the Interior, without need for further Congressional action, from funds appropriated by the CARES Act. The availability of these funds will expire at the end of September 2021, so Interior should provide this research funding to USGS as soon as possible. 
  • Join the existing Memorandum of Understanding between the Western Governors Association (WGA) and the US Department of Agriculture’s Forest Service. These groups have established “a framework to allow the U.S. Forest Service (USFS) and WGA to work collaboratively to accomplish mutual goals, further common interests, and effectively respond to the increasing suite of challenges facing western landscapes.”  This provides a forum to improve coordination between the States and the federal government on the management of invasive species, and Interior needs to be part of that team.
  • Interior should work with USDA to accelerate and intensify efforts to systematically improve coordination between the interagency Wildland Fire Leadership Council and the interagency National Invasive Species Council.  Both Councils have member agencies that practice vegetation management using similar tools and techniques, although for different purposes. The two Councils should identify a select number of initiatives in FY21 where their efforts would benefit both wildland fire management and invasive plant management .
swamp bay trees in Everglades National Park killed by laurel wilt; photo by Tony Pernas

Four steps to implement the strategic plan outside the scope of current law and the President’s Fiscal Year 2021 budget. I offer the following:

  1. Improve implementation of the Lacey Act program to list injurious species.  There are both legislative and administrative elements to this proposal.  

In a federal District Court decision on May 19, 2015, on a lawsuit filed by the Association of Reptile Keepers, the Court undid the longstanding Fish and Wildlife Service policy that the Lacey Act allowed FWS to ban interstate transport of injurious species. On April 7, 2017, the D.C. Circuit Court of Appeals upheld the District Court’s view. These rulings mean that FWS authority only applies to international commerce.  Unfortunately, the court’s interpretation of the law and legislative history are reasonable, so Congress needs to amend the law to make it clear that FWS is explicitly authorized to regulate interstate commerce in injurious species. The Department of the Interior should work with the Department of Justice and the Office of Management and Budget to develop the necessary bill language and submit it to Congress.

At the same time, the FWS injurious species listing process is notoriously slow, even causing Congress to occasionally list species legislatively.  The fact that these legislative initiatives have sometimes been promoted by Members of Congress who normally  are opposed to more federal regulation signals just how awkward the current FWS process is. Thus there might well be strong bipartisan support to amend the Lacey Act on the interstate commerce matter. Acting on its own authority, FWS should procure an independent third party review of the injurious species listing process and ask the contractor to make suggestions for “business process reengineering” to improve and streamline current practices, along with evaluating whether higher funding or new technology is needed.

  • The Bureau of Reclamation, Department of the Interior, and the Office of Management and Budget should develop legislative language to submit to Congress for the 2022 Water Resources Development Act, that explicitly authorizes an aquatic nuisance species program in the Bureau of Reclamation.  It could parallel the relatively new authority enjoyed by the Army Corps of Engineers and mandate increased coordination between the two water agencies.
  • Any climate change legislation pursued by Congress and the Administration should include provisions for addressing invasive species.  Climate change will make some North American habitats more suitable for foreign organisms, as cold-intolerant species might be able to survive in more northern latitudes in the U.S. than previously was the case. Second, the disruptive effect of climate change on North American ecosystem structure and trophic relationships at any latitude will make those ecosystems more vulnerable to invasion. Finally, the spread of invasive species may in and of itself exacerbate climate change, such as through the increased carbon dioxide emissions from rangeland wildfires aggravated by the dominance of invasive cheatgrass.
  • The Senate Committee on Environment and Public Works and the House Natural Resources Committee should each hold oversight hearings on how best to help state and local governments detect and respond to new invasive species that are not within the statutory purview of USDA/APHIS.  This is a complex topic, important for both ecological and financial reasons. Over the years several attempts to address it have failed.  A thoughtful review by Congress and the Administration, which perhaps would lead to passage of new statutory authority and funding, is worth exploring.

The Author:

Scott Cameron recently left the federal government, where he had served as Acting Assistant Secretary for Policy, Management and Budget at the U.S. Department of the Interior. In that capacity he oversaw Department-wide budget, invasive species, natural resource damage assessment and restoration, environmental compliance and numerous administrative functions of this $14 billion agency with 65,000 employees. Previously, Scott held other civil service job (e.g., at the White House Office of Management and Budget) & political appointments in the federal government, on the staff of the Governor of California, and on Congressional staffs. While not in government, Scott led formation of the Reduce Risk from Invasive Species Coalition.

CISP welcomes comments that supplement or correct factual information, suggest new approaches, or promote thoughtful consideration. We post comments that disagree with us — but not those we judge to be not civil or inflammatory.

Further information on the plant pests mentioned in the photo captions can be obtained at www.dontmovefirewood.org; click the “invasive species” button.

Bureau of Customs Strengthens Programs Aimed at Preventing Insect Introductions in Wood Packaging

This February marks 15 years since USDA began full implementation of ISPM#15. It is 22 years since the U.S. and Canada began requiring China to treat wood packaging (in response to introductions of the Asian longhorned beetle). Nevertheless, numerous shipments containing wood packaging that does not comply with the international regulations continue to arrive at our borders – and to bring pests. During Fiscal Years 2010 through 2019, CBP detected 7,900 shipments of wood packaging that harbored a pest significant enough to be in a regulated taxonomic group. In 2020, 16.6 million TEU from Asia entered the U.S. (Mongelluzzo Jan 21). If pest approach rates are the same now as 10 years ago, perhaps 6,000 or more of these containers bore wood packaging infested by tree-killing insects.

The Bureau of Customs and Border Protection (CBP), in the Department of Homeland Security, has taken steps to strengthen its programs aimed at getting insects out of the wood packaging pathway (described here).

I wish USDA APHIS took a similarly active stance. You can help by contacting your Congressperson and senators to urge their support effective actions, such as those I suggested in my blog in January.

CPB’s 2017 Improvement

Until November 1, 2017, CBD allowed importers to escape punishment until they had been caught using wood packaging that did not comply with ISPM#15 five times in one year.  On that date, CBD began issuing a penalty under Title 19 United States Code (USC) § 1595a(b) or under 19 USC § 1592 to any party responsible for a shipment with a documented wood packaging violation. At the time, I praised CBP’s action.  I have tried to find out how many times over the past three years CBP has used that new provision to issue penalties, but CBP staff have not replied to my question.   

CPB’s 2020 Improvement

CBD took another step forward in 2020. The agency incorporated measures to clean up solid wood packing material (SWPM) into its Customs-Trade Partnership Against Terrorism (CTPAT) program.  I had been urging this since 2016. It took a while – but CBP used that time to ensure that its action would be integrated into the program and so stay in effect.

CTPAT is a voluntary public-private sector partnership engaging the principle participants in international supply chains — importers, carriers, consolidators, licensed customs brokers, and manufacturers.

By signing on, they agree to help CBP ensure the highest level of cargo security. Specifically, when an entity joins CTPAT, it agrees to work with CBP to protect the supply chain, identify security gaps, and implement specific security measures and best practices.

CTPAT member companies receive several benefits in return. Because they are considered to be of low risk, their shipments are less likely to be examined and delayed at a U.S. port of entry. When they are subjected to inspection, they go to the front of the line – again, reducing costly delays. The CTPAT web-based Portal system provides a library of training materials. (Information from the CBP website; full citation at end of the blog.)

At present, more than 11,400 certified partners have joined the program. These include U.S./Canada highway and rail carriers and Canadian manufacturers – who are not subject to the U.S.’ wood packaging regulation per se. Thus, CBD’s action seems to extend pest-prevention protection to a group of suppliers previously exempted from this phytosanitary program. Inclusion of many Mexican carriers and manufacturers is also welcome, since Mexican suppliers have always ranked high in numbers of shipments that violate the ISPM#15 requirements.

Specific Minimum Security Criteria

CBP’s action took the form of adding a long list of critical new agricultural components to the Minimum Security Criteria (MSC) it already used. These include:

  • Having written procedures for both security and agricultural inspections.
  • Carrying out CTPAT approved security and agricultural inspections of all conveyances and empty Instruments of International Traffic (e.g., shipping tanks, lift vans) prior to loading. The inspection must ensure that they are not contaminated with visible agricultural pests. 
  • If visible pest contamination is found during the inspection, the partner business must wash or vacuum the conveyance to remove such contamination. The company must retain documentation demonstrating compliance for one year.
  • Vessels that visited Asian Gypsy Moth (AGM) high-risk areas during periods when the moths are flying must present a pre-departure AGM inspection certificate from an approved entity stating that the vessel is free of AGM life stages. The AGM inspections must be performed at the regulated port as close to vessel departure time as possible. CTPAT sea carriers must provide CPB with two-year port-of-call data at least 96 hours before arrival at a U.S. port.
  • Cargo staging areas, and the immediate surrounding areas, must be inspected on a regular basis to ensure these areas remain free of visible pest contamination. 
  • CTPAT Members must have written procedures designed to prevent visible pest contamination to include compliance with ISPM#15 regulations. Visible pest prevention measures must be adhered to throughout the supply chain.
  • Members must establish and maintain a security training and awareness program to recognize and foster awareness of the security vulnerabilities to facilities, conveyances, and cargo at each point in the supply chain. The training program must be comprehensive and cover all of CTPAT’s security requirements. Personnel in sensitive positions must receive additional specialized training geared toward the responsibilities that the position holds.
  • Drivers and other personnel that conduct security and agricultural inspections of empty conveyances and Instruments of International Traffic (IIT) must be trained to inspect their conveyances/IIT for both security and agricultural purposes. 
  • Training must be provided to applicable personnel on preventing visible pest contamination. Training must encompass pest prevention measures, regulatory requirements applicable to wood packaging materials, and identification of infested wood.

The actual Minimum Security Criteria can be found here.

Training Powerpoints are here.

(The summary of these criteria was provided by Stephen Brady, Senior Agriculture Operations Manager, Agriculture Programs and Trade Liaison, U.S. Customs and Border Protection.)

Inclusion of wood packaging in the CTPAT program should result in more efficient efforts to detect infested wood packaging before shipment — before the insect can reach North America. I believe it is fair to importers in that it requires action based on visible pest presence or damage. I applaud Customs and Border Protection for making the effort – internally and with the shipping industry — to add this protection.

I think fairness would be further served by CBP and APHIS adopting a program to inform importers which foreign suppliers of wood packaging have a record of providing “clean” vs. “infested” wood packaging. The U.S. importers would then be better able to avoid both contributing to the pest risk and being exposed to violation-associated delays.

 SOURCES:

CBP website  

Mongelluzzo, B. US imports from Asia hit record December level. Jan 19, 2021

Posted by Faith Campbell

We welcome comments that supplement or correct factual information, suggest new approaches, or promote thoughtful consideration. We post comments that disagree with us — but not those we judge to be not civil or inflammatory.

For a detailed discussion of the policies and practices that have allowed these pests to enter and spread – and that do not promote effective restoration strategies – review the Fading Forests report at http://treeimprovement.utk.edu/FadingForests.htm

Rising Pest Danger to New Regions Parallels Rise in Imports

container ship in Savannah harbor- capacity 6,188 containers; photo by F.T. Campbell

As I have blogged recently U.S. imports have soared since the summer. US imports from Asia during the first 11 months of 2020 were 2% higher than the figure from the first 11 months of 2019, despite the crash in imports in the spring.

The increased volume is not distributed evenly. Asian imports moving through the twin ports of Long Beach and Los Angeles (LA/LB) were 26.5% higher in November 2020 compared to November 2019. As a result, the ports’ marine terminals, longshore labor force, drayage truckers, and import distribution centers cannot keep up. As of early January, 62 container ships were at LA/LB – 29 being offloaded and 33 ships at anchor awaiting berths. Nineteen additional arrivals were scheduled within a few days. This is the largest backup in Southern California since the disruptions associated with the 2014-15 West Coast longshore labor dispute (Mongelluzzo, B. January 4, 2021).

As a result of the long delays at LA/LB, plus port expansion under way at other ports, the volume of imports entering elsewhere is rising – with a commensurate increase in the pest risk associated with wood packaging material there.

Imports from Asia through the Northwest Seaport Alliance (NWSA) of Seattle and Tacoma increased 9.9% in November 2020 compared to November 2019.  Imports through Oakland were up 2.2% year over year (Mongelluzzo, B. January 4, 2021). These ports’ proportion of imports from Asia should rise even higher in the future. One company has begun a premium service from China directly to Oakland and Seattle. Shippers are expected to welcome this as an opportunity to avoid the congestion at LA/LB. Oakland also offers access to the large and affluent San Francisco Bay area, as well as rail transport to inland hubs such as Chicago, Memphis, Dallas, and Kansas City.

The principal disadvantage is that these ports can handle only ships carrying 3,500 to 6,500 TEU capacity [twenty-foot equivalent units; a standard measurement that counts incoming volume as though contained in twenty-foot-long containers] (Mongelluzzo, B. January 04, 2021). Other ports, e.g., LA/LB and Savannah, routinely handle ships carrying 10,000 or more TEUs.

As I have noted in earlier blogs, US Gulf Coast ports are expanding capacity significantly to handle vessels larger their current10,000 TEU limit. The Port of Houston is adding a new deepwater container berth and expanding its ship channel. At New Orleans, the U.S. Army Corps of Engineers is dredging the lower reaches of the Mississippi River. The Port of Mobile also has a dredging project under way. Tampa Bay plans to double its capacity over the next five years (Angell, January 4, 2021).

The Port of Savannah currently has 9 berths served by 36 cranes. The Port plans to increase capacity by 45% over the next decade – from 5.5 million TEUs to 8 million TEUs per year (https://gaports.com/facilities/port-of-savannah/). 

 Government Agencies’ Involvement

These port expansions are partially funded by U.S. government agencies. The Department of Transportation funds development of onshore facilities, while the U.S. Army Corps of Engineers carries out dredging of the waterways. We should insist that the environmental impact statements evaluating these projects include consideration of the invasive species risks associated with increased ship traffic. Potential harm comes from a wide range of organisms, which put an equally wide range of ecosystems at risk. For example, ship traffic has brought our country ruinous aquatic invertebrates in ballast water and sessile organisms on hulls; as well as costly Asian gypsy moths on ships’ superstructures and a series of tree-pest larvae in wooden dunnage and other packaging material (e.g., Asian longhorned beetle, emerald ash borer, redbay ambrosia beetle, possibly the invasive shot hole borers  …).

The surge in imports from Asia has continued through the first half of 2021. Over this period, imports from Asia to the California ports of Los Angeles and Long Beach totaled 9,523,959 TEU, up 24.5% from the 7,649,095 TEU in the same period of 2019 (Mongelluzzo, B. July 12, 2021).

SOURCES

Angell, M. Outlook 2021: US Gulf Coast ports moving forward with major capacity expansions. Journal of Commerce January 04, 2021 https://www.joc.com/port-news/us-ports/outlook-2021-us-gulf-coast-ports-moving-forward-major-capacity-expansions_20210104.html?utm_campaign=CL_JOC%20Port%20Newsletter%201%2F6%2F21__e-production_E-85987_TF_0106_0900&utm_medium=email&utm_source=Eloqua

Mongelluzzo, B. CMA CGM’s new Asia service to give Oakland long-sought first call.  Journal of Commerce January 04, 2021 https://www.joc.com/maritime-news/container-lines/cma-cgm%E2%80%99s-new-asia-service-give-oakland-long-sought-first-call_20210104.html?utm_source=Eloqua&utm_medium=email&utm_campaign=CL_JOC%20Daily%201%2F5%2F21%20_JOC%20Daily%20Newswire_e-production_E-85981_TF_0105_0617

Mongelluzzo, B. Strong US imports from Asia in June point to a larger summer surge. July 12, 2021.

https://www.joc.com/maritime-news/container-lines/strong-us-imports-asia-june-point-larger-summer-surge_20210712.html?utm_source=Eloqua&utm_medium=email&utm_campaign=CL_JOC%20Daily%207%2F13%2F21_PC00000_e-production_E-106057_KB_0713_0617

Posted by Faith Campbell

We welcome comments that supplement or correct factual information, suggest new approaches, or promote thoughtful consideration. We post comments that disagree with us — but not those we judge to be not civil or inflammatory.

For a detailed discussion of the policies and practices that have allowed these pests to enter and spread – and that do not promote effective restoration strategies – review the Fading Forests report at http://treeimprovement.utk.edu/FadingForests.htm

Let’s shape the Biden Administration’s & New Congress’ Policies on Non-Native Forest Pests!

We have a great opportunity to shape future efforts to counter non-native forest pests and diseases. Administration officials are most open to new ideas when they first take office. The same is true of new Congressional leadership.

So now is the time to suggest needed changes!

The USDA Secretary-designate is Tom Vilsack. Of course, he was USDA Secretary during the Obama Administration … so he is not entirely “new” to the issues. However, perspectives and priorities have changed, so now is a good time to urge him to consider new approaches.  Furthermore, the Senate Agriculture Committee will hold confirmation hearings for him; we can ask the Senators to advocate for our views during this proceeding.

The House Agriculture Committee has a new Chair, David Scott – from the suburbs of Atlanta, Georgia. Again, this provides an opportunity to suggest new approaches and topics for hearings. 

I assume you all are knowledgeable about the numbers and impacts of non-native forest insects and pathogens in the United States, and of the pathways by which they are introduced and spread. If you are not, peruse my blogs about wood packaging or plants as vectors (click on the appropriate “categories” listed at the bottom of the archive of blogs). Or read Fading Forests III (see the link at the end of this blog) and the article I coauthored early this year on improving forest pest management programs.

On the basis of my long experience, I suggest that you encourage USDA Secretary-designate Vilsack, Senators on the Agriculture Committee, and House Agriculture Committee Chair David Scott to consider the following recommendations:

Actions Congress could take

  1. Congress could amend the Plant Protection Act [7 U.S.C. §7701, et seq. (2000)] to prioritize the protection of natural and agricultural resources over the facilitation of trade.  This might be done by amending the “findings” section of the statute to give higher priority to pest prevention.
  2. The Agriculture Committees of both the House and Senate could hold hearings on the importation of forest pests. They could determine if the USDA is doing an adequate job protecting the country from insect pests and diseases, and how our defenses could be strengthened. One component of the hearings could focus on whether current funding levels and mechanisms are adequate to support vigorous responses to new pest incursions.
  3. Congress could commission a study of the feasibility, costs and benefits of establishing a “Center for Forest Pest Control and Prevention” to coordinate research and policy on this issue.
  4. Congress could increase funding for the appropriate USDA APHIS and Forest Service programs and activities to enable vigorous containment and eradication responses targeting introduced forest pests and diseases.    
  5. Congress could increase funding for USDA research on detection of insects and pathogens in shipping; insect and disease monitoring/surveillance; biological control; alternatives to packaging made from wooden boards; management of established pests; and resistance breeding to enable restoration of impacted tree species.

Actions Secretary-designate Vilsack could initiate without legislative action (once he is confirmed)

Introductions of pests in the wooden crates, pallets, etc., goods come in

  1. APHIS could take emergency action to prohibit use of wood packaging by importers of goods from countries with a record of poor compliance with ISPM#15. This action is allowed under authority of the Plant Protection Act [7 U.S.C. §7701, et seq. (2000)] and Article 5.7 of the World Trade Organization’s Agreement on the Application of Sanitary and Phytosanitary Measures.
  2. APHIS could strengthen enforcement of current regulations by aggressively prosecuting repeat offenders.  For instance, APHIS could begin imposing administrative financial penalties on importers each time their wood packaging is non-compliant with ISPM#15.
  3. APHIS could work with Department of Homeland Security Bureau of Customs and Border Protection (CBP) to improve information available to U.S. importers about which foreign suppliers of SWPM and shippers have good vs. bad records of compliance with ISPM#15.
  4. DHS CBP could release information on country of origin and treatment facility for ISPM#15-stamped SWPM that is found to be infested with pests.
  5. USDA APHIS could begin a phased transition from solid wood packaging to alternative materials that cannot carry wood-boring pests. APHIS could initiate a pest risk assessment to justify making such an action permanent. Imports could be packaged in alternative materials, e.g., manufactured wood products (e.g. plywood), metal, or plastic.

Nursery Plant (“Plants for Planting”) Pathway

  1. APHIS could apply authorities under NAPPRA and other existing authorities to curtail imports of plants that pose a high risk of introducing insects and pathogens that would threaten tree species that are important in natural and urban forests in the U.S. At a minimum, APHIS should restrict imports of live plants that are in the same genus as native woody plants of the U.S.
  2. APHIS could work with the Agriculture Research Service and National Institute of Food and Agriculture to determine which taxa of woody vegetation native to the U.S. are vulnerable to pathogens present in natural systems of trade partners. Particularly important would be the many Phytophthora species found by Jung and colleagues in Vietnam, Taiwan, Chile, and other countries. Once the studies are sufficiently complete, APHIS could utilize authority under NAPPRA to prohibit importation of plants from those source countries until effective phytosanitary measures can be identified and adopted.

Other Actions

  1. APHIS could develop procedures to ensure the periodic evaluation of pest approach rates associated with wood packaging and imports of “plants for planting” and highlight areas of program strengths and weaknesses. A good place to start would be to update the study by Haack et al. (2014), which estimated the approach rate in wood packaging a decade ago.
  2. The USDA could expand early detection systems for forest pests, such as the APHIS CAPS program and the Forest Service EDRR program. These programs should be better coordinated with each other and should make better use of citizen observations collected through smartphone apps, professional tree workers such as arborists and utility crews, and university expertise in pest identification and public outreach.  An effective program would survey for a broad range of pests as well as for suspicious tree damage, and would be focused on high-risk areas such as forests around seaports, airports, plant nurseries, and facilities such as warehouses that engage in international trade.
  3. The USDA could initiate a “Sentinel Plantings“ network of US tree species planted in gardens abroad and monitored for potential pests and diseases. 

Posted by Faith Campbell

We welcome comments that supplement or correct factual information, suggest new approaches, or promote thoughtful consideration. We post comments that disagree with us — but not those we judge to be not civil or inflammatory.

For a detailed discussion of the policies and practices that have allowed these pests to enter and spread – and that do not promote effective restoration strategies – review the Fading Forests report at http://treeimprovement.utk.edu/FadingForests.htm

Imports Surge – Will Pests be Far Behind?

shipping containers at Long Beach

In August I blogged that import volumes had crashed … US imports from Asia declined each month from January through June (Mongelluzzo Dec 14; full citations at end of blog). However, the economic rebound over the summer brought a surge in imports that continues. Given our concern about introductions of tree-killing pests, it is not good news that imports from Asia are driving the growth in imports.

US imports from Asia during the first 11 months of 2020 were 2% higher than the figure from the first 11 months of 2019. In November alone, the U.S imported 1.6 million TEUs [twenty-foot equivalent units; a standard measurement that counts incoming volume as though contained in twenty-foot-long containers] worth of goods from Asia. Imports in December are projected to remain high (Mongelluzzo Dec 14; full citation at end of blog).

Imports from Asia were 1.626 million TEU in December – up 29.9% from December 2019 (although still lower than October and August). December imports were pushed by record e-commerce sales and shipments of personal protective equipment (PPE) and medical supplies. For all of 2020, imports from Asia totaled 16.6 million TEU, up 4.1% from 2019 (Mongelluzzo Jan. 19) 

This surge in imports – which began in late June — is certain to continue at least for the next two months as retailers ship more merchandise before some factories in Asia close for the Lunar New Year (Mongelluzzo Jan 19).

Because of the history of tree-killing pests introduced from Asia, I have blogged most often about the situation at West Coast ports. However, in 2020 there has been a noticeable shift to East and Gulf Coast ports because of the congestion and delays at West Coast ports. Thus, in November 2020, West Coast ports handled 60.2% of imports from Asia; East Coast ports handled 33.7%; Gulf Coast ports handled 5.7%. The East Coast figure is 30% higher than over the same period in 2019. At New York-New Jersey specifically, the increase was 35.1% (Mongelluzo Dec 16). Imports to Gulf Coast ports continue to rise; Gulf Coast ports handled only 4.8% of total US imports from Asia during the first nine months in 2019 and less than 3% before the widening of the Panama Canal (in 2016) (Angell October 28). Link to blog #203 midNov  (In future, goods shipped from Asia across the Arctic Ocean to the U.S. east coast could add to the pest risk confronting our already hard-hit Eastern Deciduous Forest.)

Pacific Coast Ports

According to Mongelluzzo (December 9), the Los Angeles-Long Beach port complex (LA-LB) set records for US imports from Asia in August and again in October. The port complex handled 2.5 million TEU of imports from Asia in the three-month period of August through October. Despite shippers’ concern about delays, LA-LB is expected to continue to handle the bulk of Asian goods entering the country in coming months.

The ports of Los Angeles-Long Beach handle 50% of US imports from Asia. From July 2020 through February 2021, these ports received an average of 791,838 TEU each month – a 23% increase over the 2019 average of 642,000 TEU per month (Mongeluzzo April 2021). 

Ports in the Southeast

As reported by Ashe (December 10), several ports in the southeast US are seeing record import volumes caused by retailers’ restocking, e-commerce, and Christmas shopping. November import volumes hit all-time highs in Savannah and Port of Virginia, while they were up year over year in Charleston. The three port authorities say the surge is the result of demand for furniture, bedding, refrigerators, freezers, and air conditioners – reflecting Americans’ current focus on improving their homes. Imports also include artificial Christmas trees (which have been a vector of pests in the past – as has furniture). 

offloading cargo at Savannah; photo by F.T. Campbell

The volume of imports into Savannah from all sources surged 34% over the November 2019 volume. Imports from Asia rose 36%. Imports of furniture rose 42% in August and September. “Hardware, home goods, machinery, and appliances from Asia were up double digits,” according to Georgia Port Authority CEO Griff Lynch. Import volumes from Asia rose 36% in Virginia and 32% in Charleston.

Vessels Carry More Containers

Another threat of increased pest introductions arises from the increasing size of container ships. Increasing proportions of vessels with the capacity to carry more than 10,000 containers are arriving. Since 2010, the proportion of such ships arriving at West Coast ports has risen from 1.1% to 75.5%.  The proportion arriving at East Coast ports has grown since the opening of the widened Panama Canal in 2017. The proportion of high-capacity ships visiting East Coast ports has risen from 3% in 2017 to   15% during the first 10 months of 2020. Gulf Coast ports receive few such vessels because the serve a smaller share of the U.S. market. The largest ships serve the trade from Asia primarily (Mongelluzzo Dec. 21, 2020). Of course, arrival of ten to fifteen thousand containers at once surely strains Custom’s inspection staff.

container ship in Savannah; Photo by F.T. Campbell

Imports from Geographic Regions Other Than Asia

Imports (from all sources) through New York and New Jersey ports were 22% percent higher in October 2020 than in October 2019 (Angell November 10). As noted above, most of the  higher volume of imports originated in Asia.

According to Journal of Commerce staff (November 30), containerized imports from the Caribbean and Central America grew a negligible 0.1% over the same period last year. Principal ports for this trade are in Florida and along the Gulf Coast, but include Wilmington, DE, and Philadelphia.

According to JOC staff (November 2), containerized cargo import volumes from all regions flowing through the busiest US Gulf Coast ports declined 2.3% in the first seven months of 2020 compared to the same period in 2019.

Non-containerized cargoes — i.e., dry bulk, liquid bulk, roll-on/roll-off (ro-ro), and oversized/heavy-lift freight — are not included in these data. Dry bulk cargo through Houston has been reported to suffer problems in infested dunnage (wood used to brace non-containerized cargo, such as steel beams). Link to blog  173 February 2020

SOURCES

Angell, M. US Gulf pulls more Asian imports amid West Coast congestion Oct 28, 2020 https://www.joc.com/port-news/us-ports/us-gulf-pulls-more-asian-imports-amid-west-coast-congestion_20201028.html

Angell, M. Railroads send railcars to NY-NJ as import pressure mounts Nov 10, 2020 https://www.joc.com/port-news/us-ports/railroads-send-railcars-ny-nj-import-pressure-mounts_20201110.html?utm_campaign=CL_JOC%20Port%20Newsletter%2011%2F18%2F20%20-%20With%20R__e-production_E-81883_AK_1118_1200&utm_medium=email&utm_source=Eloqua

Ashe, A. Import surge at Southeast ports tightens chassis availability Dec 10, 2020 https://www.joc.com/port-news/us-ports/southeast-closing-out-2020-surging-volumes_20201210.html?utm_source=Eloqua&utm_medium=email&utm_campaign=CL_JOC%20Daily%20Newswire%2012%2F11%2F2020__e-production_E-84440_KB_1211_0617

JOC Staff  JOC Rankings: Resins buoy US Gulf Coast ports during COVID-19 Nov 02, 2020 https://www.joc.com/port-news/us-ports/joc-rankings-resins-buoy-us-gulf-coast-ports-during-covid-19_20201102.html?utm_source=Eloqua&utm_medium=email&utm_campaign=CL_JOC%20Daily%20Newswire%2011%2F3%2F2020%20__e-production_E-80030_TF_1103_0617

JOC Staff.  JOC Rankings: US–Carib/Central America trade tumbles in 2020 Nov 30, 2020 https://www.joc.com/maritime-news/joc-rankings-slowing-us%E2%80%93caribcentral-america-trade-tumbles-2020_20201130.html?utm_campaign=CL_JOC%20Port%20Newsletter%2012%2F2%2F20%20__e-production_E-83092_TF_1202_0900&utm_medium=email&utm_source=Eloqua

Mongelluzzo, B.  Import deluge fills LA-LB terminals to capacity Dec 09, 2020 https://www.joc.com/port-news/us-ports/import-deluge-fills-la-lb-terminals-capacity_20201209.html?utm_source=Eloqua&utm_medium=email&utm_campaign=CL_JOC%20Daily%20Newswire%2012%2F10%2F2020__e-production_E-84332_KB_1210_0617

Mongelluzzo, B. Asia-US import surge slowing slightly, but spreading to East, Gulf coasts Dec 14, 2020 https://www.joc.com/maritime-news/container-lines/asia-us-import-surge-slowing-slightly-spreading-east-gulf-coasts_20201214.html?utm_source=Eloqua&utm_medium=email&utm_campaign=CL_JOC%20Daily%20Newswire%2012%2F15%2F2020__e-production_E-84893_KB_1215_0617

Mongelluzzo, B. US East Coast ports avoid gridlock despite rising volumes. Dec 16, 2020. https://www.joc.com/port-news/us-ports/us-east-coast-ports-avoid-gridlock-despite-rising-volumes_20201216.html?utm_source=Eloqua&utm_medium=email&utm_campaign=CL_JOC%20Daily%20Newswire%2012%2F17%2F2020__e-production_E-85162_KB_1216_2139

Mongelluzzo, B.  Increasing vessel sizes a red flag for US ports. Dec 21, 2020 https://www.joc.com/maritime-news/container-lines/increasing-vessel-sizes-red-flag-us-ports_20201221.html?utm_source=Eloqua&utm_medium=email&utm_campaign=CL_JOC%20Daily%2012%2F22%2F20_JOC%20Daily%20Newswire_e-production_E-85422_KB_1222_0617

Mongelluzzo, B. US imports from Asia hit record December level. Jan 19, 2021 https://www.joc.com/maritime-news/container-lines/us-imports-asia-hit-record-december-level_20210119.html?utm_source=Eloqua&utm_medium=email&utm_campaign=CL_JOC%20Daily%201%2F20%2F21_PC00000_e-production_E-87262_KB_0120_0617

Mongeluzzo, B. Additional port capacity alone can’t solve congestion issues: LA-LB. Journal of Commerce. April 2021 https://www.joc.com/port-news/us-ports/additional-port-capacity-alone-can%E2%80%99t-solve-congestion-issues-la-lb_20210407.html?utm_source=Eloqua&utm_medium=email&utm_campaign=CL_JOC%20Daily%204%2F8%2F21_PC00000_e-production_E-95420_KB_0408_0837

Posted by Faith Campbell

We welcome comments that supplement or correct factual information, suggest new approaches, or promote thoughtful consideration. We post comments that disagree with us — but not those we judge to be not civil or inflammatory.

For a detailed discussion of the policies and practices that have allowed these pests to enter and spread – and that do not promote effective restoration strategies – review the Fading Forests report at http://treeimprovement.utk.edu/FadingForests.htm


Pests Associated with Imports: Rising Risk for Gulf States

Port of Mobile, Alabama Photo by Port of Mobile Authority

In August and September I blogged about the rapid increase in volumes of imports from Asia, especially China, in 2020. At the time, the information available to me focused on the Pacific coast ports, especially Long Beach and Los Angeles.

In the earlier blogs, I mentioned three concerns:

1.  Had the collapse in trade and travel during spring 2020 so reduced user fees that Department of Homeland Security Bureau of Customs and Border Protection (CBP) had to furlough Agriculture Quarantine Inspectors?  AQI inspections provide important incentives for importers to follow U.S. and international rules to reduce the risk that pests will be present in imports, for example, in wood packaging. 

2. The list of imports from China in the first half of 2020 includes $1 billion worth of nursery stock. This is down about 7% from 2019. However, from the perspective of preventing plant diseases and pests, these imports continue to be high risk and are still not adequately addressed by U.S. policy.

3. Other Asian regions are gaining in import share. Thus we can expect to see more pests arriving from countries other than China, like Vietnam.  

Cutbacks in Numbers of Inspectors?

CBP staff have told me that they are shifting AQI inspectors from covering incoming passengers – which are still far fewer than before the Pandemic – to inspecting cargo. By doing so, CBP has avoided cutting back on the total number of inspections of imported goods and associated wood packaging.

This is fortunate since Congress has not passed a new Covid-19 financing bill that might have included an increase in the appropriation for DHS CBP. The Continuing Resolution currently in effect funds the government only until December 11. So we have another chance to ask for an increase in appropriated funds for CBP (and APHIS!) for the remainder of Fiscal Year 2021 (which ends on October 1, 2021).

Volumes of Imports from Asia – Especially China  

As I reported in the earlier blog, while U.S. imports from China declined significantly in 2019  and early 2020 compared to earlier years, by the summer imports had rebounded — more than doubled (by value) between March and July.

Shifts in U.S. Ports

According to the Journal of Commerce, there is a gradual shift away from the twin ports of Los Angeles and Long Beach in the proportion of imported goods entering the country.  LA-LB handled 37.7% of the loaded twenty-foot equivalent containers (TEUs) entering the United States in 2018. This fell to 33.5% in July 2020. The initial reason was a decrease in imports from East Asia (including China, Hong Kong, Japan, South Korea, and Taiwan) compared to Southeast Asia, Europe, then South America and, finally, South Asia (primarily India).

Other source regions – e.g., the Caribbean, Middle East, Pacific, Africa, and Atlantic – were all below 2% of total numbers of TEU in all three years, and changed minimally over this period.

Another reason for the shift in ports utilized by importers is congestion and delays at North American Pacific coast ports, especially Los Angeles-Long Beach. U.S. imports from Asia moving through LA-LB increased 22% in both September and August from the same months last year – 828,880 TEU in September after 832,210 TEU in August.

Congestion is also a problem at the Canadian ports of Vancouver and Prince Rupert – which have actually seen small decreases in numbers of incoming containers.

One result is a small but significant shift to Gulf Coast ports, which have become more accessible through the widening of the Panama Canal in 2016. Before the Canal was widened, these ports handled less than 3% of total US imports from Asia. In the first nine months of 2020, US Gulf ports handled 608,387 TEU from Asia – or 5.2% of total US imports from Asia. This was a 5% increase from the same period last year.

These ports, stretching from Houston to Tampa, benefit from easy and relatively cheap rail transport to inland U.S. and even Canadian cities. Another factor is the heavy presence of Walmart – which has major distribution centers in Mobile and Houston.

The Gulf coast ports are expected to expand their importance as gateways for Asian imports as ocean carriers add more capacity between the two regions and ports upgrade and expand. New Orleans and Houston plan major expansions. Port Tampa Bay notes its proximity to markets around the Southeast. Already, import volumes into Tampa during the first nine months of 2020 were nearly double the prior year’s level. Tampa hopes to double its capacity over the next five years.

U.S. imports from Asia in October were 22.6% higher than a year ago. Imports through the East and Gulf coast ports jumped 14.6% and 48.4% from September 2020. Houston and Baltimore saw the greatest increases since September. There were also shifts in Pacific ports. Still, the Los Angeles-Long Beach port complex handled 49% of total US imports from Asia in October 2020.

Pest Risks to the Gulf Coast from Southeast Asia

Rising volumes of imports into the Gulf Coast present new opportunities for non-native insects and pathogens. The warm, wet climate of the region might be far more suitable to some insects and pathogens from tropical and subtropical Asia than the dry climate of southern California (except for areas that are irrigated artificially, such as golf courses, parks, and plant nurseries!).

redbay grove killed by laurel wilt; Photo by Scott Cameron

Already, the redbay ambrosia beetle and its associated pathogenic fungus has decimated native redbay and swamp bay trees and now threatens sassafras (see write-up under the “invasive species” tab here.)

Another Southeast Asian ambrosia beetle – the polyphagous shot hole borer with its associated pathogenic fungus – might also find the Gulf Coast states more inviting than southern California. In California, it is causing the greatest damage to trees that are artificially irrigated. Numerous tree species native to or grown in the Gulf states are known hosts, e.g., box elder, sweetgum, and southern magnolia. (PSHB is described under the “invasive species” tab here.) Both ambrosia beetles apparently were introduced via wood packaging material.

Southeast Asia is also the place of origin of other pathogens which – in this case – would more probably be introduced on imported plants rather than wood. These include the numerous species of Phytophthora recently detected in Vietnam.

As this region receives more goods from Asia, and as those goods arrive more rapidly so more likely to arrive alive, it is imperative that all stakeholders increase their vigilance to detect new invaders. And that they join others pressing for improved policies aimed at preventing introductions.

Posted by Faith Campbell

We welcome comments that supplement or correct factual information, suggest new approaches, or promote thoughtful consideration. We post comments that disagree with us — but not those we judge to be not civil or inflammatory.

For a detailed discussion of the policies and practices that have allowed these pests to enter and spread – and that do not promote effective restoration strategies – review the Fading Forests report here.

Projection: Alien Species Introductions Will Keep Going Up! Especially Arthropods!

Japanese knotweed

In 2017 I blogged about a study by Hanno Seebens and 44 coauthors that showed that the rate of new introductions of alien species has risen rapidly since about 1800 – and showed no sign of slowing down (a reference to the full article is at the end of this blog). Here’s a brief recap, followed by a 2020 update by Seebens and colleagues.

In 2017, Seebens et al. analyzed a database covering 45,813 first records of 16,926 alien species established in 282 distinct geographic regions. The year with the highest number of reported new detections was 1996 – 585, or an average of more than 1.5 sightings per day.

The authors found that the adoption of national and international biosecurity measures during the 20th Century had slowed introductions – but not sufficiently. Numbers of reported new introductions of fish and mammals had decreased since the early 1950s. However, first recorded introductions of vascular plant species remained high, and introductions of birds and reptiles also continued to rise, largely as pets in countries with strengthening economies.

For taxa introduced primarily accidentally on transport vectors or as contaminants of commodities (e.g., algae, insects, crustaceans, molluscs and other invertebrates), they found a strong correlation between their spread and the market value of goods imported into the region of interest – existing biosecurity regimes had not slowed down the accumulation of these alien taxa.

As a consequence, the authors expected that the numbers of new alien species would continue to increase.

As you are aware, since 2015 I have posted 15 blogs about the continued detections of tree pests in wood packaging, which remains one of the major pathways despite the international regulation ISPM#15. I have found it harder to track insect and pathogen introductions on imported plants, but it surely continues apace.

2020 Study Projects Continuing Rise in Introductions, Especially Arthropods 

Hanno Seebens and a smaller set of coauthors (see full reference at the end of this blog) have now produced an estimate of probable introduction rates in the future.  They looked at taxon–continent combinations for seven major taxonomic groups and eight continents (excluding Antarctica).

They found an overall increase in established alien species between 2005 and 2050 of 36%.

The study predicted that by the mid-21st Century, there will be distinct increases in alien species numbers, particularly for Europe, but also for Temperate Asia and North America, and for invertebrates in all regions. Europe ranked highest in absolute numbers of new alien species (~2,543; a 64% increase). Temperate Asia was projected to receive about 1,597 species (a 50% increase); North America about 1,484 (a 23% increase); South America about 1,391 (a 49% increase); and the Pacific Islands about 132. Only Australasia could expect a slower rise in introductions. The predicted trajectories of alien species numbers were surprisingly similar for mainland and island regions across taxonomic groups.

Invertebrates showed the highest relative increases. Rates of new detections of alien species were projected to accelerate for arthropods other than crustaceans worldwide, especially for North America (!). The study also projected higher relative increases for aquatic vascular plants and terrestrial insects

All drivers of introduction and invasion are predicted to intensify in the future. This is despite adoption of increasing numbers of countermeasures in recent decades. Most countries’ capacity to proactively counter the rising tide of invasive species is still poor. Furthermore, the principal drivers – intensification of trade and transport, land-use change, and access to new source pools – is expected to continue operating as now – “business as usual”.

spotted lanternfly Holly Ragusa, Pennsylvania Department of Agriculture

Current Status of “New” Detections

Seebens et al. (2020) relied on the Alien Species First Records Database for first detection records up to 2005. More than half (54%) of the first-detection records in the database are vascular plants. Arthropods other than crustaceans made up 28% of the total, birds 6%, fishes 4%, mammals 3%, molluscs 2%, and crustaceans 2%. The 2020 study confirmed the earlier finding that the observed first-record rates of mammals changed at around 1950 from an increasing to a decreasing trend. Finally, the total numbers of non-native species in the Database is much lower in aquatic habitats. (The authors do not discuss whether this reflects actual introductions or gaps in reporting.)

In the database, Europe recorded 38% of all first records, North America 16%, Australasia 15%, South America 9%, Temperate Asia 9%, Africa 6%, Pacific Islands 5% and Tropical Asia 2%.

A comparison to the immediate past (1960-2005) showed that the rates of emerging non-native species were projected to accelerate during 2005-2050, especially for arthropods. As I noted above, North America is predicted to have high increases in absolute numbers. Increases are also predicted for birds. Declines are predicted for mammals and fishes.  

Asian giant hornet; photo from University of Florida Department of Entomology

Projected increases for Australasia were consistently lower than in the past.          

Caveats:

1) The authors assumed that past patterns of alien species accumulation will continue in the future. They did not attempt to predict efforts to strengthen biosecurity regulations and mitigation strategies.  

2) Projections were calculated in the absence of data on many underlying drivers for the historic periods and some taxonomic groups. However, observed trends of newly-detected alien species numbers during the 20th century were surprisingly stable despite distinct political and socio-economic changes.

Seebens and colleagues conclude that implementation of targeted biosecurity efforts can reduce the numbers of new alien species becoming established. However, a significant decrease in rates of alien species numbers on a large scale can only be achieved by a coordinated effort that crosses political borders.

SOURCES

Seebens et al.  2017. No saturation in the accumulation of alien species worldwide available (free access!) at https://www.nature.com/articles/ncomms14435

Seebens, H., S. Bacher, T.M. Blackburn, C. Capinha, W. Dawson, S. Dullinger, P. Genovesi, P.E. Hulme, M. van Kleunen, I. Kühn, J.M. Jeschke, B. Lenzner, A.M. Liebhold, Z. Pattison, J. Perg, P. Pyšek, M. Winter, F. Essl. 2020. Projecting the continental accumulation of alien species through to 2050. Global Change Biology. 2020;00:1 -13 https://onlinelibrary.wiley.com/doi/10.1111/gcb.15333


Posted by Faith Campbell

We welcome comments that supplement or correct factual information, suggest new approaches, or promote thoughtful consideration. We post comments that disagree with us — but not those we judge to be not civil or inflammatory.

For a detailed discussion of the policies and practices that have allowed these pests to enter and spread – and that do not promote effective restoration strategies – review the Fading Forests report at http://treeimprovement.utk.edu/FadingForests.htm

Trade, Pests, Inspections … & China

containers at the port of Long Beach

Recent information raises several troubling/worrisome issues:

1.  The overall collapse in trade and travel has severely cut into the collection of user fees. These fees pay for Agriculture Quarantine Inspectors, putting jobs at risk. Their inspections provide important incentives for importers to follow U.S. and international rules to limit pests. 

2. The list of imports from China in 2020 includes $1 billion worth of nursery stock. This is down about 7% from 2019. However, from the perspective of preventing plant diseases and pests, these imports continue to be high risk and still not adequately addressed by U.S. policy.

3. Other Asian regions are gaining in import share. Thus we can expect to see more pests arriving from countries other than China, like Vietnam.  

Loss of User Fees Could Mean Loss of Inspectors

The collapse of trade and travel has a more troubling result: severe reductions in user fees collected from travelers and importers to fund DHS/Customs and Border Protection Agriculture Quarantine Inspectors. In a recent opinion piece, several former administrators of APHIS warn that current user fee collections are insufficient to sustain inspectors’ employment. A reserve fund will also be depleted this month. APHIS estimates that it will require an appropriation of $630 million to fund these agricultural inspections through the next fiscal year (October 2020 – September 2021).  

Agricultural inspectors focus on plant and animal imports – including horticultural stock, seeds, fruits, and vegetables – both in commercial shipments and in passengers’ baggage. They are also called in when CBP inspectors suspect pests are present in wood packaging.

I do not consider inspection to be the most effective strategy to prevent introductions. That is, I think inspections are less effective than regulations requiring treatments and pre-shipment pest-mitigation measures. However, losing inspectors – even temporarily – will undermine detection and enforcement as an incentive for importers to comply with U.S. and international rules. This funding crisis is therefore a serious concern. Please ask your senators and member of Congress to support increasing the appropriation for DHS CBP by $650 million to keep these inspectors on the job.

Imports from Asia Skyrocket

New data show that containerized US import volumes from Asia rocketed 91% between March and August. During the same five-month period a year ago, import volumes rose only 36% — so the 2020 increase is more than double the earlier pace. Numbers of incoming containers from Asia nearly doubled at the ports New York/New Jersey; Los Angeles/Long Beach, California; and Savannah, Georgia. The California ports are reported to be working nearly at capacity. This has resulted in higher handling costs and delays in trucking imports out of the port to their destinations.

Import volumes from Vietnam and India continue outpace the market generally.

Update: Imports from China Continue to Decline Relative to Other Source Regions

In August I posted a blog reporting a significant reduction in imports from China recently – first as a result of new tariffs in 2019, and second, as a result of the global economic crash associated with the Covid-19 virus.

Imports from China decreased by 16% in 2019 compared to 2018, then rose slightly in the first months of 2020. My focus then – and now – is on declining imports of heavy goods — the types of imports most likely to be packaged in wooden crates or on wooden pallets that can transport pests.

Import volumes from China rose later in the year, as the U.S. economy began to rebound. Official data from the U.S. Bureau of the Census shows US imports from China had more than doubled (by value) since March — from $19.8 billion in March to $40.7 billion in July. Still, imports of heavy items and most consumer items – other than computers – have decreased in 2020 compared to 2019.

Included in this list of imports is $1 billion worth of nursery stock – down about 7% from 2019. Nursery stock imports are rarely included in Census reports, so I value this information. Of course, these imports – even ‘though declining – still represent a series plant pest risks. One study showed that imported plants carry a pest risk 12 times higher than wood packaging material (Liebhold et al. 2012; see full reference at end of blog).

rhododendron infected by sudden oak death – photo courtesy of Jennifer Parke

Important Shifts in Sources of U.S. Imports

Data show a broad and years-long decline in the share of U.S. imports that come from China. This decline is best seen in declining volumes of imports arriving at the ports of Los Angeles, Long Beach, Northwest Sea Alliance and another port in the region. Imports arriving at these ports declined 5.3% in May 2019 compared to May 2018. At that time, this decline was blamed on importers having stocked up in advance of threatened US tariffs on goods from China. Bureau of the Census data show a 2% reduction in loaded twenty-foot-long containers (TEUs) entering Long Beach in calendar year to date 2019 compared to calendar year to date 2020 (through August).

Commercial data sources indicate even larger declines. According to the Journal of Commerce, the twin ports of Los Angeles and Long Beach handled 37.7% of the loaded TEUs entering the United States in 2018. This fell to 33.5% in July 2020 — a drop of 4.2 percentage points in just 18 months. The author of this article said the reason was a fall in imports from East Asia (including China, Hong Kong, Japan, South Korea, and Taiwan) compared to Southeast Asia, Europe, then South America and, finally, South Asia (primarily India). The article provides a table quantifying shifting sources of U.S. imports:

Total US Market Share Imports by Source Region

SOURCE                                 2018                2019                2020YTD        2018-2020 change

East Asia                                  61.6%              58%                 54.5%                          -7.1%

Europe                                     14.9%              15.8%              16.9%                          +1.9%

Southeast Asia                         8.3%                10.5%              11.9%                          +3.6%

South America                         8.2%                10.5%              11.9%                          +3.6%

South Asia                               2.7%                3.1%                3.1%                            +0.5%

Other source regions – e.g., the Caribbean, Middle East, Pacific, Africa, and Atlantic – were all below 2% of total numbers of TEU in all three years, and changed not at all or minimally over this period.

As I noted in the earlier blog, the pest risk persists. First, imports from China continue, and the most recent data (for the period 2011-2016) indicate significant numbers of shipments continue to be in violation of requirements for wood packaging (APHIS database / pers. comm). Remember, USDA passed up an opportunity to raise the issue of non-compliant wood packaging with Chinese phytosanitary officials.

Plus other regions also are the source of pests. I wrote about the risk from Mexico in the previous blog.  The region of Southeast Asia has already been the source of highly damaging pests, e.g., redbay ambrosia beetle and polyphagous shot hole borer.

distribution of laurel wilt, carried by redbay ambrosia beetle

Scientists have also detected numerous known and previously unknown species of the brown alga genus Phytophthora in Vietnam and Taiwan. Of course, this is the genus that includes the pathogens that cause sudden oak death, black ink disease, potato blight, and numerous other plant diseases. APHIS has not accepted my urging to undertake rapid assessments of the vulnerability of North American trees to these newly discovered microbes.

SOURCE

Liebhold, A.M., E.G. Brockerhoff, L.J. Garrett, J.L. Parke, and K.O. Britton. 2012. Live Plant Imports: the Major Pathway for Forest Insect and Pathogen Invasions of the US. www.frontiersinecology.org

Posted by Faith Campbell

We welcome comments that supplement or correct factual information, suggest new approaches, or promote thoughtful consideration. We post comments that disagree with us — but not those we judge to be not civil or inflammatory.

For a detailed discussion of the policies and practices that have allowed these pests to enter and spread – and that do not promote effective restoration strategies – review the Fading Forests report at http://treeimprovement.utk.edu/FadingForests.htm

Reminder: comment on ALB EA

Reminder: Friday is the deadline for commenting on APHIS’ draft environmental assessment for the Asian longhorned beetle eradication program in South Carolina. Comments should be submitted at https://beta.regulations.gov/commenton/APHIS-2020-0086-0001

The draft EA can be downloaded from https://www.aphis.usda.gov/aphis/newsroom/federal-register-posts/sa_by_date/sa-2020/alb-draft-ea

The Center for Invasive Species Prevention submitted comments that supported the eradication effort because of the well-documented threat that the ALB poses to the forests of North America. We also supported the preferred alternative in the EA.

However, we found the environmental assessment (EA) to be deficient in several ways:

  • the EA does not identify the host species present in the program area – not even of the 5,800 trees inspected by the program as of mid-August.
  • the EA provides no estimate of the proportion of deciduous trees and shrubs in the area that are host species. Conifers dominate the area. This means that any fauna dependent on deciduous trees and shrubs for food and shelter already contend with limited resources. Consequently, while we concur with the EA that any impacts will be localized, they might be exacerbated by the relative rarity of hardwood species in the local area. It is particularly important that the EA address this question since the Programmatic EIS was written under the assumption that forests at risk to the ALB are like those in the Northeast and Midwest, where hardwoods dominate.

Without knowing the proportion of deciduous flora comprised of host species, no one can evaluate the amount of wildlife food that could be removed or treated by pesticides. Some wildlife species are potentially vulnerable, including those that feed on pollen and nectar (i.e., bees and other pollinators) and those that feed on insects and other invertebrates. The latter include two species listed federally as threatened species: the frosted flatwood salamander (Ambystoma cingulatum) and northern long-eared bat (Myotis septentrionalis). Also vulnerable are birds, 96% of which feed their young on insects and other invertebrates. I worry about sublethal effects and possible bioaccumulation. Aquatic organisms, especially invertebrates, might also be affected.

The information gaps in the EA highlight weaknesses in the Programmatic EIS, on which it relies. The most important gap is the dearth of pesticide dose/mortality data for terrestrial amphibians. Apparently, EPA has not required such studies before approving pesticides. 

Posted by Faith Campbell

We welcome comments that supplement or correct factual information, suggest new approaches, or promote thoughtful consideration. We post comments that disagree with us — but not those we judge to be not civil or inflammatory.

For a detailed discussion of the policies and practices that have allowed these pests to enter and spread – and that do not promote effective restoration strategies – review the Fading Forests report at http://treeimprovement.utk.edu/FadingForests.htm