APHIS funding of programs targetting tree pests (& some others)

spotted lanternfly; photograph by Holly Ragusa, Pennsylvania Department of Agriculture

Since Fiscal Year (FY)2009, APHIS has had access to a program that has permanent funding, not subject to the vagaries of annual budgeting and appropriations. The Plant Pest and Disease Management and Disaster Prevention Program established by 7 U.S.C. Section 7721. The program was initially funded at $12 million for FY2009; $45 million in FY2010; $62.5 million in 2014-2017; and $75 million since FY2018.

Funds are provided under a competitive grants program to universities, states, Federal agencies, nongovernmental organizations, non-profits, and Tribal organizations “to conduct critical projects that keep U.S. crops, nurseries, and forests healthy, boost the marketability of agricultural products within the country and abroad, and help us do right and feed everyone.” [USDA press release “USDA Provides $66 Million in Fiscal Year 2019 to Protect Agriculture and Natural Resources from Plant Pests and Diseases” February 15, 2019]

By my calculation, total funding of tree pests projects during the period Fiscal Year (FY09) through FY20 was about $94 million. This represented 15.6% of nearly $600 million in total funding under the program during this period.

In the initial years, forest pest projects received about 10-12% of total funds. In later years, the proportion has been higher – e.g., 30% in FY19, 13.8% in FY20. The early years were dominated by management of the sudden oak death pathogen (SOD), Phytophthora ramorum. In FY09, SOD projects receive $7.5 million, or 8% of all tree pest funding. This funding helped set up the National Ornamental Nursery study center (NORS-DUC); later years paid for research projects on SOD management issues and nursery surveys. 

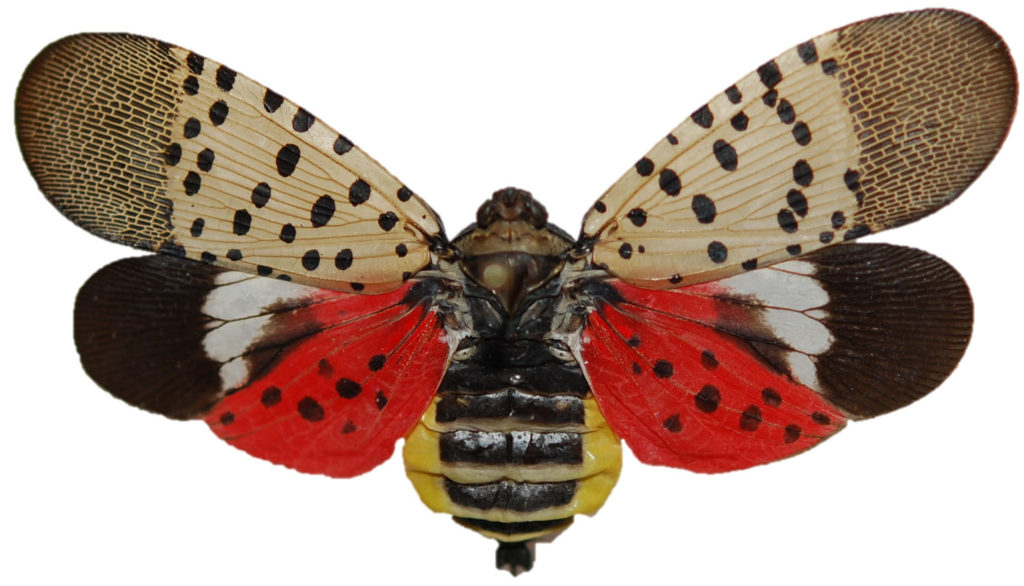
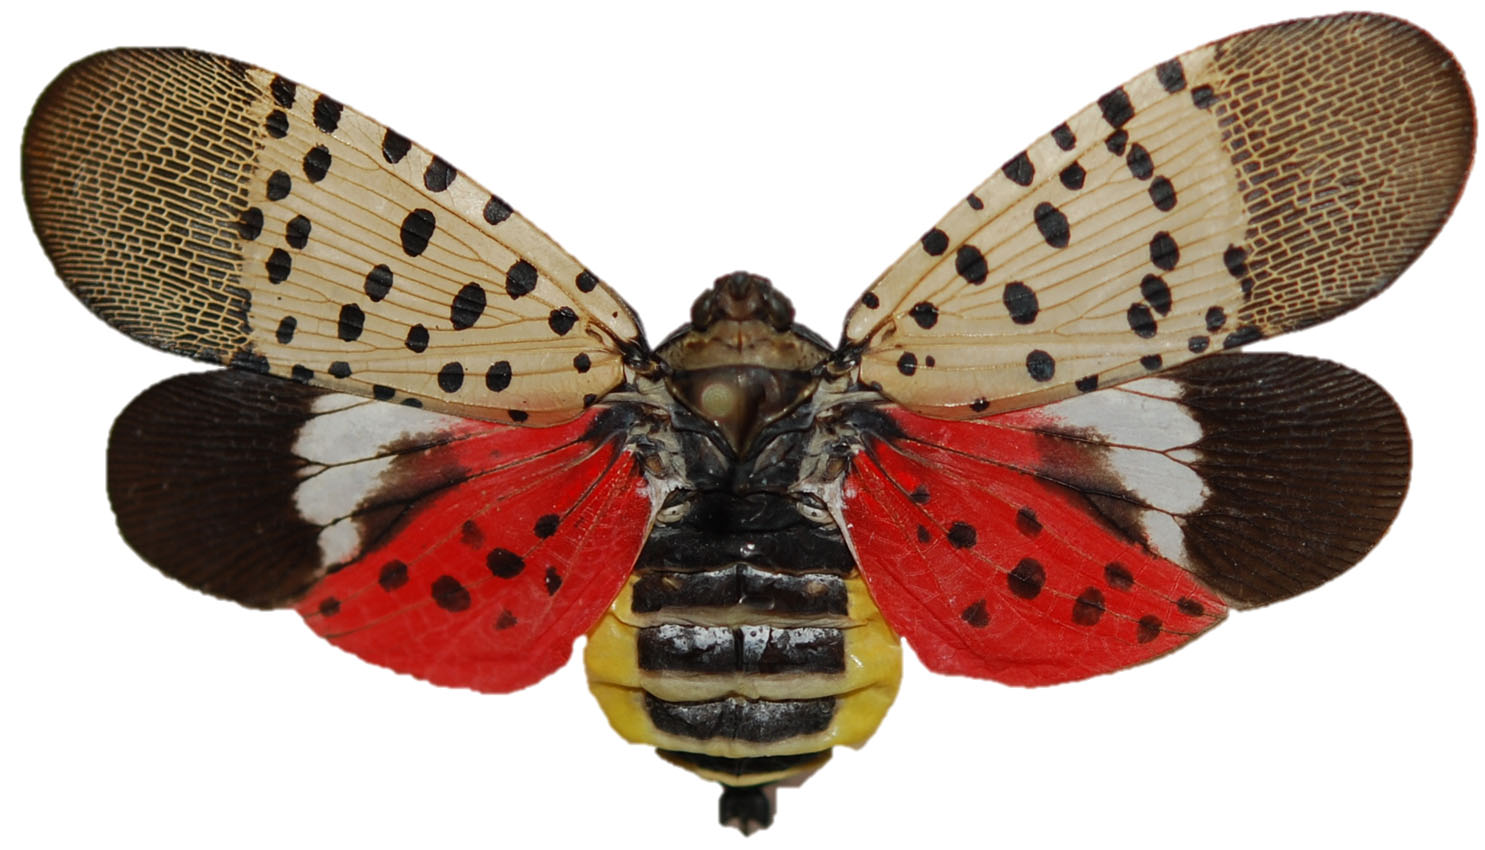
In the most recent years, funding has been dominated by detection, management, and research on spotted lanternfly – which is not primarily a forest pest. Thus, in FY 19, 56.8% ($10,339,126) of $18,195,000 allocated to tree pests; in FY20, 30% ($2,606,094) of the $8,705,920 allocated to all tree pests.  

The FY2019 program also provided $1,107,965 in 14 states and nationally for P. ramorum survey, diagnostics, mitigation, probability modeling, genetic analysis, and outreach (USDA press release 2019). This was appropriate considering the shipment of SOD-infected plants to nurseries in 18 states in spring 2019.

Current Year Funding

APHIS has released the list of projects funded under the Plant Protection Act Section 7721 in FY2021. Link to website APHIS funded 354 projects in 49 states, Guam, Puerto Rico and the District of Columbia, at a total cost of $63.225 million. APHIS is retaining ~ $14 million to allow responses to pest and plant health emergencies. Total funding for forest pests – by my calculation – was $8,715,046 (13.7% of the total).

My analysis finds that in FY21, 13 states had no funded projects that applied to tree pests: Arizona, Colorado, District of Columbia, Guam, Hawaii, Idaho, Nebraska, New Jersey, New Mexico, North Dakota, Rhode Island, South Dakota, and Utah.

Most commonly funded projects:

  • Surveys and other efforts addressing wood borers: 37 projects, including
    • Thousand cankers disease: 4 (all surveys)
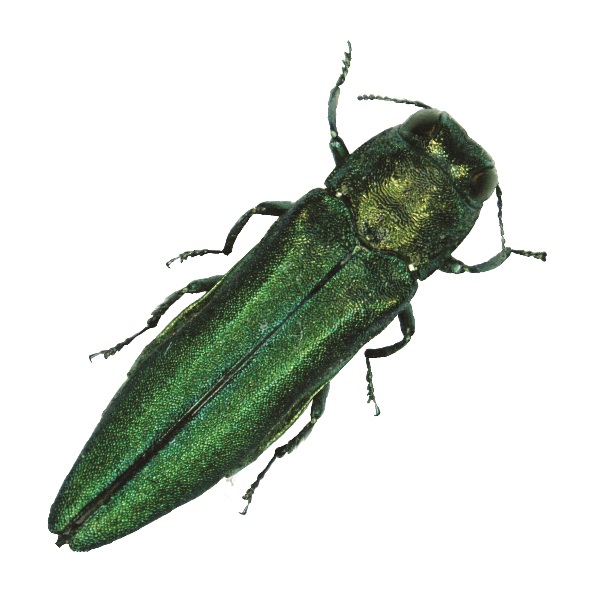
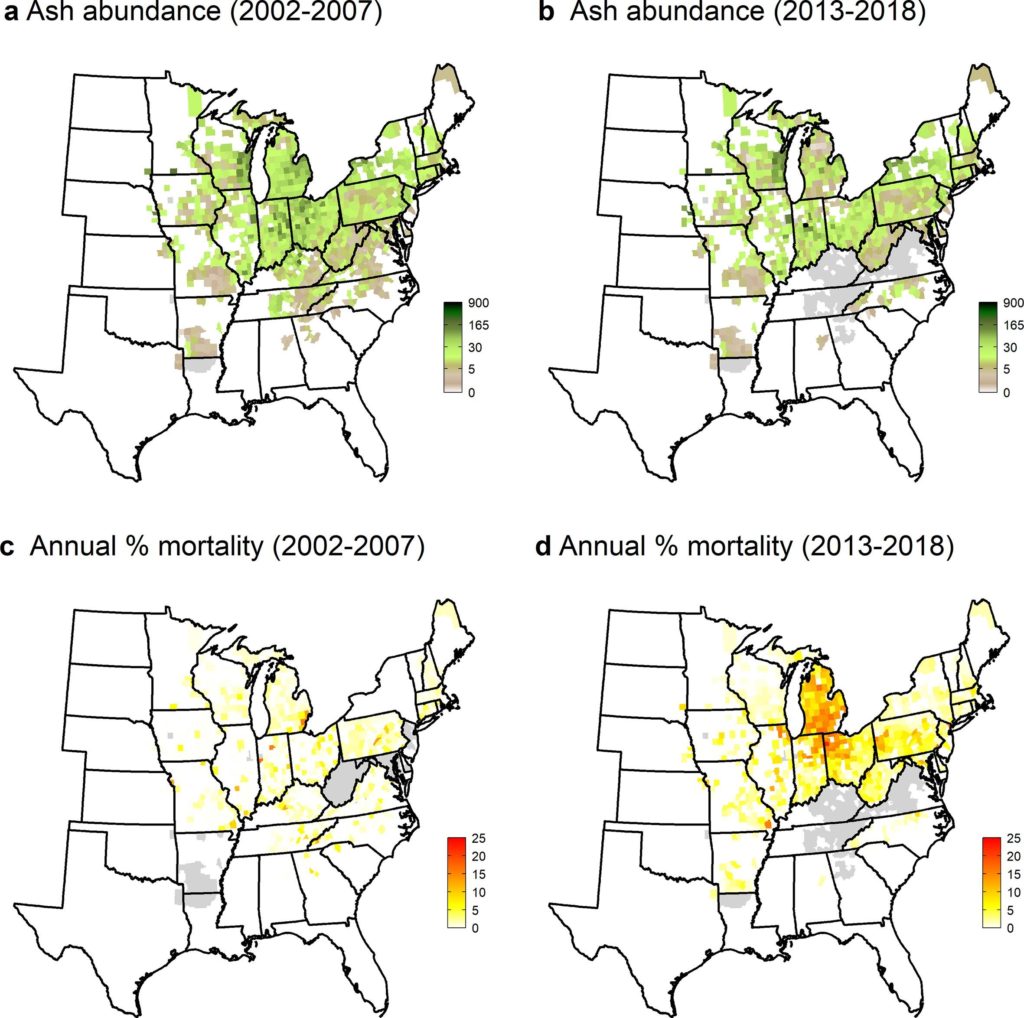
    • Emerald ash borer: 6 projects (surveys and management, including biocontrol)
    • Asian longhorned beetle: 3, of which 2 are outreach
    • Laurel wilt disease: 1 project
    • Detection tools for wood-borers, including citrus longhorned beetle, Sirex noctilio, Agrilus biguttatus, and Australian Cerambycids
  • Phytophthora ramorum: 20 projects, primarily nursery surveys but including a few management projects. The projects were in 18 states.
  • Surveys for Asian defoliating moths in the Lymantra genus: 15 projects
  • Surveys and control efforts targetting spotted lanternfly: 13 projects in 6 states. These included research conducted by the APHIS Otis laboratory in Massachusetts. The grants totaled $2,788,010, or 32% of total forest pest funding.

APHIS funded 16 outreach projects (there is some overlap with above), including three specifically mentioning firewood. The latter included principal funding for the “Don’t Move firewood” national campaign.

Other projects that I find interesting:

  • 2 projects targetting hemlock woolly adelgid
  • 1 targetting red palm weevil
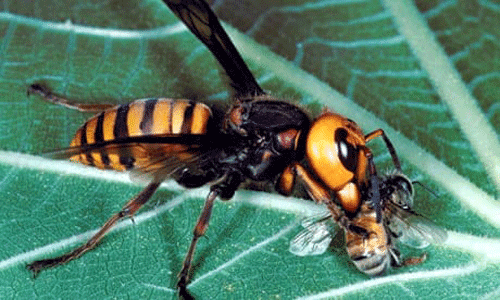
  • 4 projects targetting Asian giant hornet in Washington and Oregon and the APHIS Otis laboratory. California has a project relating to a wider range of hornets that was also funded in FY20.
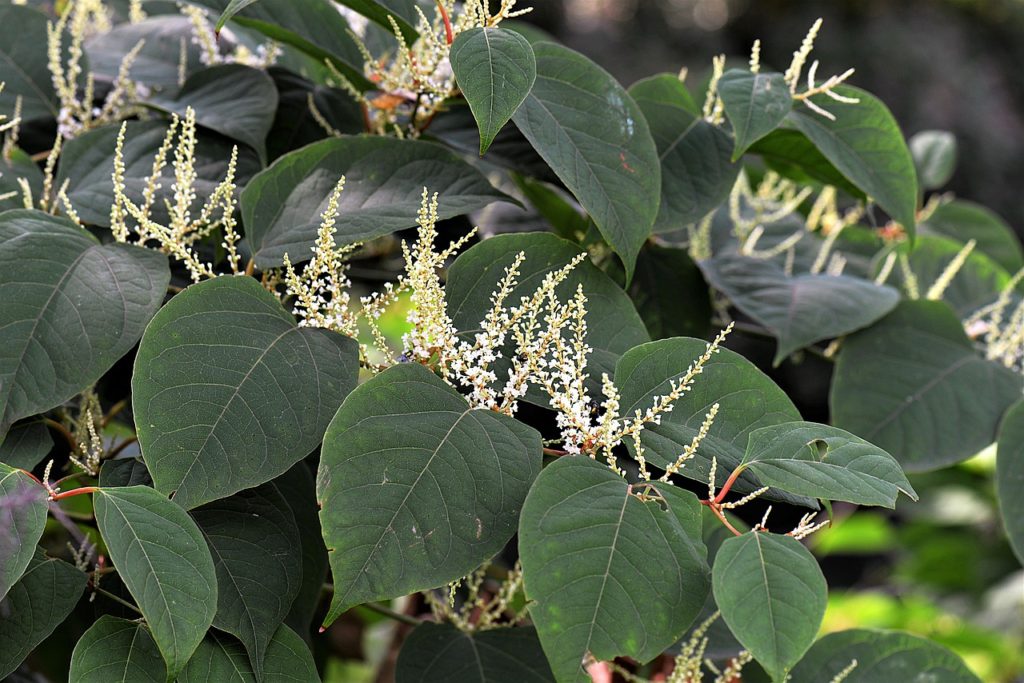
  • Biocontrol of several invasive plant species in Florida – Australian pine/Casuarina, Brazilian pepper, and Ailanthus
Harrisia cactus attacked by the mealybug; photo by Yorelyz Rodríguez-Reyes

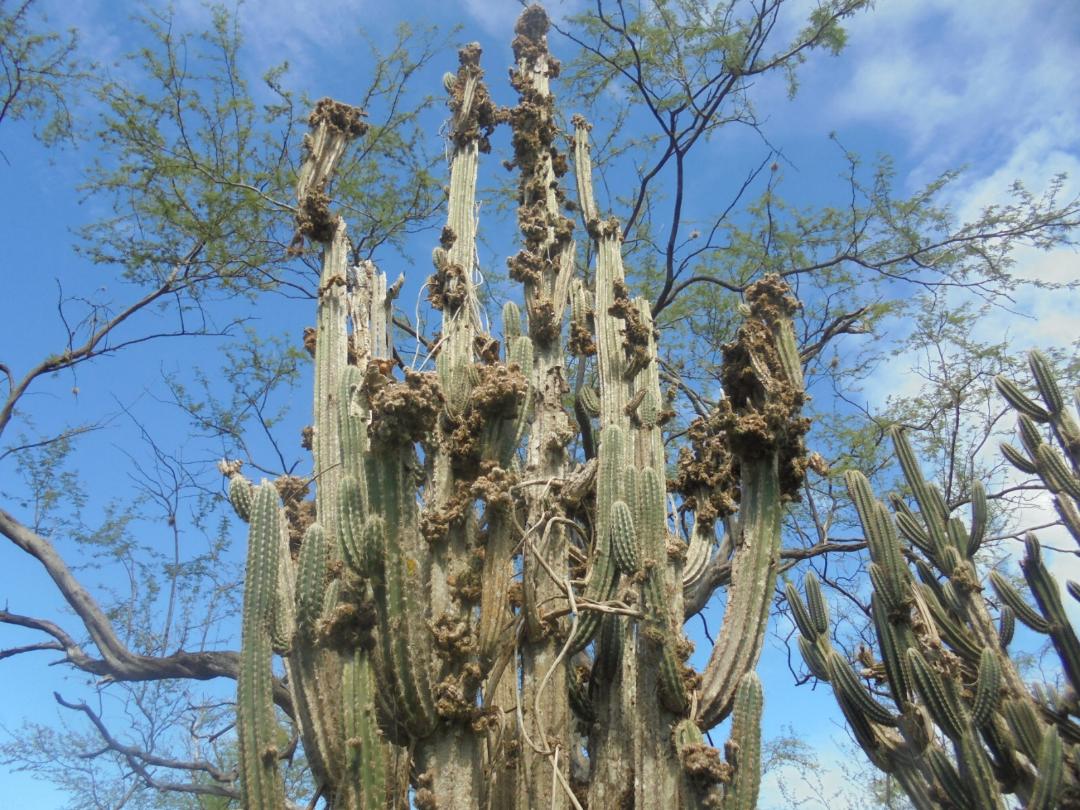
As readers of this blog know, I also care deeply about threats to our native cacti – especially flat-padded Opuntia and tubular cacti endemic to Puerto Rico. Over the 13 years of program, funded following projects for cacti:

  • FY11  $244,368 for efforts to develop sterile insect methodology to control cactus moth
  • FY17   develop biocontrol for Harissia cactus mealybug $210,000
  • FY19   Harissia cactus mealybug – $355,774; cactus moth $216,243
  • FY20   Harrisia cactus mealybug $301,930
  • FY 21 cactus moth biocontrol $175,659 and $352,236 for Harrisia cactus mealybug biocontrol

Clearly, having access to $75 million that is not subject to the limits imposed by Administration budget priorities or Congressional appropriations has allowed considerable freedom. The fund has allowed APHIS to support work on pests that have not been designated “quarantine pests,” e.g., walnut canker disease of walnut, the polyphagous and Kuroshio shot hole borers, hemlock woolly adelgid, and the cactus pests. The program also funded many projects targetting the spotted lanternfly (SLF) – both before and after the lanternfly became a formal APHIS program (which occurred after it was detected outside Pennsylvania). Now that SLF has been found in several states, funding has partially shifted to appropriated funds. The FY21 appropriation included an additional $4 million for management of SLF; this was incorporated in the “specialty crops” line item.

So far, there has been no funding for beech leaf disease through this program; I don’t know whether any of the people working on this disease had applied.

Posted by Faith Campbell

We welcome comments that supplement or correct factual information, suggest new approaches, or promote thoughtful consideration. We post comments that disagree with us — but not those we judge to be not civil or inflammatory.

For a detailed discussion of the policies and practices that have allowed these pests to enter and spread – and that do not promote effective restoration strategies – review the Fading Forests report at http://treeimprovement.utk.edu/FadingForests.htm

Rising Pest Danger to New Regions Parallels Rise in Imports

container ship in Savannah harbor- capacity 6,188 containers; photo by F.T. Campbell

As I have blogged recently U.S. imports have soared since the summer. US imports from Asia during the first 11 months of 2020 were 2% higher than the figure from the first 11 months of 2019, despite the crash in imports in the spring.

The increased volume is not distributed evenly. Asian imports moving through the twin ports of Long Beach and Los Angeles (LA/LB) were 26.5% higher in November 2020 compared to November 2019. As a result, the ports’ marine terminals, longshore labor force, drayage truckers, and import distribution centers cannot keep up. As of early January, 62 container ships were at LA/LB – 29 being offloaded and 33 ships at anchor awaiting berths. Nineteen additional arrivals were scheduled within a few days. This is the largest backup in Southern California since the disruptions associated with the 2014-15 West Coast longshore labor dispute (Mongelluzzo, B. January 4, 2021).

As a result of the long delays at LA/LB, plus port expansion under way at other ports, the volume of imports entering elsewhere is rising – with a commensurate increase in the pest risk associated with wood packaging material there.

Imports from Asia through the Northwest Seaport Alliance (NWSA) of Seattle and Tacoma increased 9.9% in November 2020 compared to November 2019.  Imports through Oakland were up 2.2% year over year (Mongelluzzo, B. January 4, 2021). These ports’ proportion of imports from Asia should rise even higher in the future. One company has begun a premium service from China directly to Oakland and Seattle. Shippers are expected to welcome this as an opportunity to avoid the congestion at LA/LB. Oakland also offers access to the large and affluent San Francisco Bay area, as well as rail transport to inland hubs such as Chicago, Memphis, Dallas, and Kansas City.

The principal disadvantage is that these ports can handle only ships carrying 3,500 to 6,500 TEU capacity [twenty-foot equivalent units; a standard measurement that counts incoming volume as though contained in twenty-foot-long containers] (Mongelluzzo, B. January 04, 2021). Other ports, e.g., LA/LB and Savannah, routinely handle ships carrying 10,000 or more TEUs.

As I have noted in earlier blogs, US Gulf Coast ports are expanding capacity significantly to handle vessels larger their current10,000 TEU limit. The Port of Houston is adding a new deepwater container berth and expanding its ship channel. At New Orleans, the U.S. Army Corps of Engineers is dredging the lower reaches of the Mississippi River. The Port of Mobile also has a dredging project under way. Tampa Bay plans to double its capacity over the next five years (Angell, January 4, 2021).

The Port of Savannah currently has 9 berths served by 36 cranes. The Port plans to increase capacity by 45% over the next decade – from 5.5 million TEUs to 8 million TEUs per year (https://gaports.com/facilities/port-of-savannah/). 

 Government Agencies’ Involvement

These port expansions are partially funded by U.S. government agencies. The Department of Transportation funds development of onshore facilities, while the U.S. Army Corps of Engineers carries out dredging of the waterways. We should insist that the environmental impact statements evaluating these projects include consideration of the invasive species risks associated with increased ship traffic. Potential harm comes from a wide range of organisms, which put an equally wide range of ecosystems at risk. For example, ship traffic has brought our country ruinous aquatic invertebrates in ballast water and sessile organisms on hulls; as well as costly Asian gypsy moths on ships’ superstructures and a series of tree-pest larvae in wooden dunnage and other packaging material (e.g., Asian longhorned beetle, emerald ash borer, redbay ambrosia beetle, possibly the invasive shot hole borers  …).

The surge in imports from Asia has continued through the first half of 2021. Over this period, imports from Asia to the California ports of Los Angeles and Long Beach totaled 9,523,959 TEU, up 24.5% from the 7,649,095 TEU in the same period of 2019 (Mongelluzzo, B. July 12, 2021).

SOURCES

Angell, M. Outlook 2021: US Gulf Coast ports moving forward with major capacity expansions. Journal of Commerce January 04, 2021 https://www.joc.com/port-news/us-ports/outlook-2021-us-gulf-coast-ports-moving-forward-major-capacity-expansions_20210104.html?utm_campaign=CL_JOC%20Port%20Newsletter%201%2F6%2F21__e-production_E-85987_TF_0106_0900&utm_medium=email&utm_source=Eloqua

Mongelluzzo, B. CMA CGM’s new Asia service to give Oakland long-sought first call.  Journal of Commerce January 04, 2021 https://www.joc.com/maritime-news/container-lines/cma-cgm%E2%80%99s-new-asia-service-give-oakland-long-sought-first-call_20210104.html?utm_source=Eloqua&utm_medium=email&utm_campaign=CL_JOC%20Daily%201%2F5%2F21%20_JOC%20Daily%20Newswire_e-production_E-85981_TF_0105_0617

Mongelluzzo, B. Strong US imports from Asia in June point to a larger summer surge. July 12, 2021.

https://www.joc.com/maritime-news/container-lines/strong-us-imports-asia-june-point-larger-summer-surge_20210712.html?utm_source=Eloqua&utm_medium=email&utm_campaign=CL_JOC%20Daily%207%2F13%2F21_PC00000_e-production_E-106057_KB_0713_0617

Posted by Faith Campbell

We welcome comments that supplement or correct factual information, suggest new approaches, or promote thoughtful consideration. We post comments that disagree with us — but not those we judge to be not civil or inflammatory.

For a detailed discussion of the policies and practices that have allowed these pests to enter and spread – and that do not promote effective restoration strategies – review the Fading Forests report at http://treeimprovement.utk.edu/FadingForests.htm

Decision!! California Department of Food & Agriculture Upgrades Ranking of Phytophthora occultans

Ceanothus ferrisiae; photo by John Rusk

In January 2021, the California Department of Food and Agriculture announced the pest rating for Phytophthora occultans, one of two species of Phytophthora it was reviewing. (Once at the website, click on “comment” – next to name Heather Sheck.)

I blogged about this action in December.

Five people or organizations submitted comments. The most comprehensive comments were submitted by Elizabeth Bernhardt, Ph. D. and Tedmund Swiecki Ph.D. of Phytosphere Research. Another scientist was Tyler Bourret, who had been the first to detect P. occultans in California when working as a student in 2015-16. The third scientist was Jennifer Parke, a plant pathologist at Oregon State University who has worked with Phytophthora species in agriculture and wildland settings for 36 years. Additional comments were submitted by the Phytophthoras in Native Habitats Work Group and me.

All commenters raised some issues. First was the lack of information on the true distribution of P. occultans in California. CDFA restated that it that relies on official records and survey information, and that those records support a “low” rating.

Several issues relate to the definitions that CDFA applies in assigning ranks. They are so restrictive that – in my view – they result in underestimates of pathogens’ potential impacts.

One example is how CDFA recognizes first detections of a pathogen. As Bernhardt and Swiecki point out, CDFA’s consideration of only “official” samples prevents timely action to protect California’s agriculture and native vegetation. In the case of P. occultans, CDFA took no action for two years after the pathogen was first reported in the state. This detection had been confirmed by a CDFA laboratory.

A second example is host range. CDFA says it assigns a host range rating of “wide” (rating of “3”) only to pathogens that have host ranges of hundreds of species. This means that pathogens with dozens of known hosts across several plant families are given a ranking of “moderate” (2). Furthermore, the agency considers only “official” samples in defining hosts. This approach precludes consideration of the high probability that additional hosts would be found in future, including federally listed species in the genera Ceanothus and Arctostaphylos. Bernhardt and Swiecki named two additional hosts based on field work. CDFA responded to the second point by adding a reference to the likely expansion of the host range in the “Uncertainty” section of the document.

Similarly, CDFA gives a reproductive potential rating of “3” only to pathogens spread by a vector or that infect seeds.

CDFA staffers who manage specific pests lack authority to change these too stringent ranking criteria. The agency leadership need to adopt more realistic criteria.

CDFA responded by accepting many of the additional factors raised primarily by Bernhardt and Swiecki. This resulted in raising the overall score from 11 to 14, and changing the ranking from “C” to “B”.


Posted by Faith Campbell

We welcome comments that supplement or correct factual information, suggest new approaches, or promote thoughtful consideration. We post comments that disagree with us — but not those we judge to be not civil or inflammatory.

For a detailed discussion of the policies and practices that have allowed these pests to enter and spread – and that do not promote effective restoration strategies – review the Fading Forests report at http://treeimprovement.utk.edu/FadingForests.htm

APHIS Deregulates Emerald Ash Borer – Now it is up to the States

APHIS formally proposed to stop regulating movement of firewood, nursery stock, and other articles that can transport the emerald ash borer (EAB) in 2018; I blogged in opposition to this proposal at the time.  Now APHIS has evaluated the 2018 comments on its proposal and has decided to proceed with its plans.

I recently blogged about the current and probable future status of ash. A study confirmed that robust regeneration of ash seedlings and saplings seen in various invaded areas will not result in recovery of mature ashes that can perform their ecological role. 

APHIS received 146 comments on the proposal. Twenty-five supported the proposal as written; 121 raised concerns. Many of the latter were a few sentences without supporting information. These comments and the final rulemaking can be read here.

How has APHIS responded to the serious questions raised? Dismissively.

I certainly concede that EAB has been difficult to manage and has spread rapidly. However, I continue tobelieve that maintaining the quarantine serves important purposes and the analysis APHIS provides does not justify terminating of the regulatory program. I remain concerned.

Neither the proposal nor the final regulation tells us how much money and staff resources have been dedicated to detection or enforcement of the regulations in recent years. Therefore we don’t know how many resources are now available for supporting other activities that the agency thinks are more effective. APHIS also refuses to provide specific information on how it will allocate the freed-up resources among its (minimal) continuing efforts. For example, APHIS has supported resistance-breeding programs. Will it help them expand to additional species, e.g., black and Oregon ash?

How Does APHIS Propose to Curtail EAB Spread?

APHIS states in the final rule that it is ending the domestic quarantine regulation so that it can allocate resources to more effective strategies for managing and containing EAB. The agency wants to reallocate funds “to activities of greater long-term benefit to slowing the spread of EAB … These activities include further development and deployment of EAB biocontrol organisms; further research into integrated pest management of EAB that can be used at the local level to protect an ash population of significant importance to a community; and further research, in tandem with other Federal agencies, into the phenomenon of “lingering ash … ”

However, APHIS has not funded detection efforts since 2019. (Detection methods were only partially effective, but they gave us some information on where EAB had established.) APHIS is now ending regulation of the movement of vectors. APHIS concedes that biocontrol agents cannot be effective in preventing pest spread. So – what efforts – other than continued support for the “Don’t Move Firewood” campaign – will APHIS make to slow the spread of EAB?

Environmental and Economic Impacts: Not Adequately Assessed

Second, APHIS still has not analyzed the economic or environmental impact of the more rapid spread of EAB to the large areas of the country that are not yet infested – especially the West Coast – that are likely to result from deregulation. As even APHIS concedes, the EAB is currently known to occupy only 27% of the range of native Fraxinus species within conterminous US. There are additional large ash populations in Canada and Mexico – although neither country commented on the proposal — unfortunately!

Instead, APHIS largely restates its position from the proposal that it is too difficult to calculate such impacts. Furthermore, that it is APHIS’ “experience that widely prevalent plant pests tend, over time, to spread throughout the geographical range of their hosts …” In other words, APHIS denies the value of delaying invasions – yet that has always been a premise underlying any quarantine program.

The final regulation refers to an updated economic analysis, but no such document is posted on the official website. The rule does not mention costs to homeowners, property owners, municipal governments, etc. I believe it would not be so difficult to estimate costs to these entities by applying costs of tree removal in the Midwest to tree census data from major West Coast cities. Also, it might have been possible to provide some estimate of the ecological values in riparian forests by analogy to data from the Midwest developed by Deborah McCullough and others.

Biological Control: Effective – or Not

In the final regulation, APHIS concedes that the biocontrol agents currently being released have geographic and other limitations. However, APHIS does not address concerns raised by me and others about their efficacy. APHIS does say explicitly that it has not [yet?] begun efforts to find biocontrol agents that might be more effective in warmer parts of the ash range, especially the Pacific Northwest and  riparian areas of the desert Southwest. However, APHIS has conceded that these areas are almost certain to be invaded – so should it not take precautionary action?  

APHIS states several times that it cannot promise specific funding allocations among program components or strategies – such as resistance breeding – that might be pursued in the future. The agency stresses the value of flexibility.

U.S. Forest Service biologists have higher expectations; see their podcast here.

I wish to clarify that I do not oppose use of biocontrol; I strongly supported then APHIS Deputy Administrator Ric Dunkle’s decision to initiate biocontrol efforts for EAB early in the infestation. My objections are to overly optimistic descriptions of the program’s efficacy.

Firewood: Outreach Only, No National Regulation

As noted, APHIS has promised to continue support for public outreach activities, especially the “Don ‘t Move Firewood” campaign. The program’s message will continue to encourage the public to buy firewood where they burn it and to refrain from moving firewood from areas that are under Federal quarantine for other pests of firewood (e.g., Asian longhorned beetle). This campaign and the new National Plant Board guidelines link stress that firewood is a high-risk pathway for many pests of national or regional concern; they do not focus on any particular species. Leigh Greenwood, director of Don’t Move Firewood, thinks this is a good approach.

In 2010, the National Firewood Task Force recommended that APHIS regulate firewood at the national level. APHIS does explain why the agency did not do so. The agency says national regulations would be overly restrictive for some states and that requiring heat treatment would not be feasible in the winter for producers in Northern states. Finally, a Federal regulation would not address a significant non-commercial pathway – campers. [I have serious questions about APHIS’ assertion that it can regulate only commercial movement of vectors across state lines. Contact me directly for details on this.]

Perhaps APHIS is not required to analyze the probable overarching efficacy of the several efforts of 50 states. Given the states’ many perspectives and obvious difficulty in coordinating their actions on phytosanitary and other policies, I fear a scattered approach that will result in faster spread of EAB. I hope the National Plant Board guidelines on firewood regulation and outreach can overcome the history.

Most federally-managed recreation areas adopted an education campaign on firewood in autumn 2016; I blogged about it then.

Imported Wood Will be Minimally Regulated

APHIS clarifies that it will take enforcement actions against imports of ash wood only if inspectors detect larvae but can identify them just to family level and not below. APHIS will allow the importation if the larvae can be identified as EAB specifically. This policy reflects international standards, which do not allow a country to erect restrictions targetting a pest from abroad if that pest is also present inside the country and is not under an official control program. (See my discussion of the WTO Agreement on Sanitary and Phytosanitary Standards in Chapter 3 and Appendix 3 of Fading Forests II, available here.) 

APHIS does not discuss how it will react to pests identified to the genus – several other Agrilus also pose pest risks. (See here and here.)

APHIS recommends that states leery of accepting yet more EAB-infested wood from abroad petition the agency under the Federally Recognized State Managed Phytosanitary Program (FRSMP) program, under which APHIS would take action to prevent movement of infested material to that particular state.

Lessons Learned

Finally, one commenter asked whether APHIS would analyze the program to learn what could have improved results. APHIS replies that the agency “tend[s] to reserve such evaluations for particular procedures or policies in order to limit their scope …” I hope APHIS is serious about “considering” doing a “lessons learned” evaluation. It is important to understand what could have been done better to protect America’s plant resources.

My take: the EAB experience proves, once again, that quarantine zones must extent to probable locations – beyond the known locations. The pest is almost always more widely distributed than documented. This has been true for EAB, sudden oak death, ALB, citrus canker … Failure to regulate “ahead” of the pest guarantees failure. I recognize that adopting this stance probably requires a change in the law (or at least understanding of it) and of current international standards adopted by the International Plant Protection Convention (IPPC). However, absent a more aggressive approach, programs are doomed to be constantly chasing the pest’s posterior.

Finally, let us mourn the loss of ash so far, the future losses … and opportunities missed.

Posted by Faith Campbell

We welcome comments that supplement or correct factual information, suggest new approaches, or promote thoughtful consideration. We post comments that disagree with us — but not those we judge to be not civil or inflammatory.

For a detailed discussion of the policies and practices that have allowed these pests to enter and spread – and that do not promote effective restoration strategies – review the Fading Forests report at http://treeimprovement.utk.edu/FadingForests.htm

Let’s shape the Biden Administration’s & New Congress’ Policies on Non-Native Forest Pests!

We have a great opportunity to shape future efforts to counter non-native forest pests and diseases. Administration officials are most open to new ideas when they first take office. The same is true of new Congressional leadership.

So now is the time to suggest needed changes!

The USDA Secretary-designate is Tom Vilsack. Of course, he was USDA Secretary during the Obama Administration … so he is not entirely “new” to the issues. However, perspectives and priorities have changed, so now is a good time to urge him to consider new approaches.  Furthermore, the Senate Agriculture Committee will hold confirmation hearings for him; we can ask the Senators to advocate for our views during this proceeding.

The House Agriculture Committee has a new Chair, David Scott – from the suburbs of Atlanta, Georgia. Again, this provides an opportunity to suggest new approaches and topics for hearings. 

I assume you all are knowledgeable about the numbers and impacts of non-native forest insects and pathogens in the United States, and of the pathways by which they are introduced and spread. If you are not, peruse my blogs about wood packaging or plants as vectors (click on the appropriate “categories” listed at the bottom of the archive of blogs). Or read Fading Forests III (see the link at the end of this blog) and the article I coauthored early this year on improving forest pest management programs.

On the basis of my long experience, I suggest that you encourage USDA Secretary-designate Vilsack, Senators on the Agriculture Committee, and House Agriculture Committee Chair David Scott to consider the following recommendations:

Actions Congress could take

  1. Congress could amend the Plant Protection Act [7 U.S.C. §7701, et seq. (2000)] to prioritize the protection of natural and agricultural resources over the facilitation of trade.  This might be done by amending the “findings” section of the statute to give higher priority to pest prevention.
  2. The Agriculture Committees of both the House and Senate could hold hearings on the importation of forest pests. They could determine if the USDA is doing an adequate job protecting the country from insect pests and diseases, and how our defenses could be strengthened. One component of the hearings could focus on whether current funding levels and mechanisms are adequate to support vigorous responses to new pest incursions.
  3. Congress could commission a study of the feasibility, costs and benefits of establishing a “Center for Forest Pest Control and Prevention” to coordinate research and policy on this issue.
  4. Congress could increase funding for the appropriate USDA APHIS and Forest Service programs and activities to enable vigorous containment and eradication responses targeting introduced forest pests and diseases.    
  5. Congress could increase funding for USDA research on detection of insects and pathogens in shipping; insect and disease monitoring/surveillance; biological control; alternatives to packaging made from wooden boards; management of established pests; and resistance breeding to enable restoration of impacted tree species.

Actions Secretary-designate Vilsack could initiate without legislative action (once he is confirmed)

Introductions of pests in the wooden crates, pallets, etc., goods come in

  1. APHIS could take emergency action to prohibit use of wood packaging by importers of goods from countries with a record of poor compliance with ISPM#15. This action is allowed under authority of the Plant Protection Act [7 U.S.C. §7701, et seq. (2000)] and Article 5.7 of the World Trade Organization’s Agreement on the Application of Sanitary and Phytosanitary Measures.
  2. APHIS could strengthen enforcement of current regulations by aggressively prosecuting repeat offenders.  For instance, APHIS could begin imposing administrative financial penalties on importers each time their wood packaging is non-compliant with ISPM#15.
  3. APHIS could work with Department of Homeland Security Bureau of Customs and Border Protection (CBP) to improve information available to U.S. importers about which foreign suppliers of SWPM and shippers have good vs. bad records of compliance with ISPM#15.
  4. DHS CBP could release information on country of origin and treatment facility for ISPM#15-stamped SWPM that is found to be infested with pests.
  5. USDA APHIS could begin a phased transition from solid wood packaging to alternative materials that cannot carry wood-boring pests. APHIS could initiate a pest risk assessment to justify making such an action permanent. Imports could be packaged in alternative materials, e.g., manufactured wood products (e.g. plywood), metal, or plastic.

Nursery Plant (“Plants for Planting”) Pathway

  1. APHIS could apply authorities under NAPPRA and other existing authorities to curtail imports of plants that pose a high risk of introducing insects and pathogens that would threaten tree species that are important in natural and urban forests in the U.S. At a minimum, APHIS should restrict imports of live plants that are in the same genus as native woody plants of the U.S.
  2. APHIS could work with the Agriculture Research Service and National Institute of Food and Agriculture to determine which taxa of woody vegetation native to the U.S. are vulnerable to pathogens present in natural systems of trade partners. Particularly important would be the many Phytophthora species found by Jung and colleagues in Vietnam, Taiwan, Chile, and other countries. Once the studies are sufficiently complete, APHIS could utilize authority under NAPPRA to prohibit importation of plants from those source countries until effective phytosanitary measures can be identified and adopted.

Other Actions

  1. APHIS could develop procedures to ensure the periodic evaluation of pest approach rates associated with wood packaging and imports of “plants for planting” and highlight areas of program strengths and weaknesses. A good place to start would be to update the study by Haack et al. (2014), which estimated the approach rate in wood packaging a decade ago.
  2. The USDA could expand early detection systems for forest pests, such as the APHIS CAPS program and the Forest Service EDRR program. These programs should be better coordinated with each other and should make better use of citizen observations collected through smartphone apps, professional tree workers such as arborists and utility crews, and university expertise in pest identification and public outreach.  An effective program would survey for a broad range of pests as well as for suspicious tree damage, and would be focused on high-risk areas such as forests around seaports, airports, plant nurseries, and facilities such as warehouses that engage in international trade.
  3. The USDA could initiate a “Sentinel Plantings“ network of US tree species planted in gardens abroad and monitored for potential pests and diseases. 

Posted by Faith Campbell

We welcome comments that supplement or correct factual information, suggest new approaches, or promote thoughtful consideration. We post comments that disagree with us — but not those we judge to be not civil or inflammatory.

For a detailed discussion of the policies and practices that have allowed these pests to enter and spread – and that do not promote effective restoration strategies – review the Fading Forests report at http://treeimprovement.utk.edu/FadingForests.htm

Imports Surge – Will Pests be Far Behind?

shipping containers at Long Beach

In August I blogged that import volumes had crashed … US imports from Asia declined each month from January through June (Mongelluzzo Dec 14; full citations at end of blog). However, the economic rebound over the summer brought a surge in imports that continues. Given our concern about introductions of tree-killing pests, it is not good news that imports from Asia are driving the growth in imports.

US imports from Asia during the first 11 months of 2020 were 2% higher than the figure from the first 11 months of 2019. In November alone, the U.S imported 1.6 million TEUs [twenty-foot equivalent units; a standard measurement that counts incoming volume as though contained in twenty-foot-long containers] worth of goods from Asia. Imports in December are projected to remain high (Mongelluzzo Dec 14; full citation at end of blog).

Imports from Asia were 1.626 million TEU in December – up 29.9% from December 2019 (although still lower than October and August). December imports were pushed by record e-commerce sales and shipments of personal protective equipment (PPE) and medical supplies. For all of 2020, imports from Asia totaled 16.6 million TEU, up 4.1% from 2019 (Mongelluzzo Jan. 19) 

This surge in imports – which began in late June — is certain to continue at least for the next two months as retailers ship more merchandise before some factories in Asia close for the Lunar New Year (Mongelluzzo Jan 19).

Because of the history of tree-killing pests introduced from Asia, I have blogged most often about the situation at West Coast ports. However, in 2020 there has been a noticeable shift to East and Gulf Coast ports because of the congestion and delays at West Coast ports. Thus, in November 2020, West Coast ports handled 60.2% of imports from Asia; East Coast ports handled 33.7%; Gulf Coast ports handled 5.7%. The East Coast figure is 30% higher than over the same period in 2019. At New York-New Jersey specifically, the increase was 35.1% (Mongelluzo Dec 16). Imports to Gulf Coast ports continue to rise; Gulf Coast ports handled only 4.8% of total US imports from Asia during the first nine months in 2019 and less than 3% before the widening of the Panama Canal (in 2016) (Angell October 28). Link to blog #203 midNov  (In future, goods shipped from Asia across the Arctic Ocean to the U.S. east coast could add to the pest risk confronting our already hard-hit Eastern Deciduous Forest.)

Pacific Coast Ports

According to Mongelluzzo (December 9), the Los Angeles-Long Beach port complex (LA-LB) set records for US imports from Asia in August and again in October. The port complex handled 2.5 million TEU of imports from Asia in the three-month period of August through October. Despite shippers’ concern about delays, LA-LB is expected to continue to handle the bulk of Asian goods entering the country in coming months.

The ports of Los Angeles-Long Beach handle 50% of US imports from Asia. From July 2020 through February 2021, these ports received an average of 791,838 TEU each month – a 23% increase over the 2019 average of 642,000 TEU per month (Mongeluzzo April 2021). 

Ports in the Southeast

As reported by Ashe (December 10), several ports in the southeast US are seeing record import volumes caused by retailers’ restocking, e-commerce, and Christmas shopping. November import volumes hit all-time highs in Savannah and Port of Virginia, while they were up year over year in Charleston. The three port authorities say the surge is the result of demand for furniture, bedding, refrigerators, freezers, and air conditioners – reflecting Americans’ current focus on improving their homes. Imports also include artificial Christmas trees (which have been a vector of pests in the past – as has furniture). 

offloading cargo at Savannah; photo by F.T. Campbell

The volume of imports into Savannah from all sources surged 34% over the November 2019 volume. Imports from Asia rose 36%. Imports of furniture rose 42% in August and September. “Hardware, home goods, machinery, and appliances from Asia were up double digits,” according to Georgia Port Authority CEO Griff Lynch. Import volumes from Asia rose 36% in Virginia and 32% in Charleston.

Vessels Carry More Containers

Another threat of increased pest introductions arises from the increasing size of container ships. Increasing proportions of vessels with the capacity to carry more than 10,000 containers are arriving. Since 2010, the proportion of such ships arriving at West Coast ports has risen from 1.1% to 75.5%.  The proportion arriving at East Coast ports has grown since the opening of the widened Panama Canal in 2017. The proportion of high-capacity ships visiting East Coast ports has risen from 3% in 2017 to   15% during the first 10 months of 2020. Gulf Coast ports receive few such vessels because the serve a smaller share of the U.S. market. The largest ships serve the trade from Asia primarily (Mongelluzzo Dec. 21, 2020). Of course, arrival of ten to fifteen thousand containers at once surely strains Custom’s inspection staff.

container ship in Savannah; Photo by F.T. Campbell

Imports from Geographic Regions Other Than Asia

Imports (from all sources) through New York and New Jersey ports were 22% percent higher in October 2020 than in October 2019 (Angell November 10). As noted above, most of the  higher volume of imports originated in Asia.

According to Journal of Commerce staff (November 30), containerized imports from the Caribbean and Central America grew a negligible 0.1% over the same period last year. Principal ports for this trade are in Florida and along the Gulf Coast, but include Wilmington, DE, and Philadelphia.

According to JOC staff (November 2), containerized cargo import volumes from all regions flowing through the busiest US Gulf Coast ports declined 2.3% in the first seven months of 2020 compared to the same period in 2019.

Non-containerized cargoes — i.e., dry bulk, liquid bulk, roll-on/roll-off (ro-ro), and oversized/heavy-lift freight — are not included in these data. Dry bulk cargo through Houston has been reported to suffer problems in infested dunnage (wood used to brace non-containerized cargo, such as steel beams). Link to blog  173 February 2020

SOURCES

Angell, M. US Gulf pulls more Asian imports amid West Coast congestion Oct 28, 2020 https://www.joc.com/port-news/us-ports/us-gulf-pulls-more-asian-imports-amid-west-coast-congestion_20201028.html

Angell, M. Railroads send railcars to NY-NJ as import pressure mounts Nov 10, 2020 https://www.joc.com/port-news/us-ports/railroads-send-railcars-ny-nj-import-pressure-mounts_20201110.html?utm_campaign=CL_JOC%20Port%20Newsletter%2011%2F18%2F20%20-%20With%20R__e-production_E-81883_AK_1118_1200&utm_medium=email&utm_source=Eloqua

Ashe, A. Import surge at Southeast ports tightens chassis availability Dec 10, 2020 https://www.joc.com/port-news/us-ports/southeast-closing-out-2020-surging-volumes_20201210.html?utm_source=Eloqua&utm_medium=email&utm_campaign=CL_JOC%20Daily%20Newswire%2012%2F11%2F2020__e-production_E-84440_KB_1211_0617

JOC Staff  JOC Rankings: Resins buoy US Gulf Coast ports during COVID-19 Nov 02, 2020 https://www.joc.com/port-news/us-ports/joc-rankings-resins-buoy-us-gulf-coast-ports-during-covid-19_20201102.html?utm_source=Eloqua&utm_medium=email&utm_campaign=CL_JOC%20Daily%20Newswire%2011%2F3%2F2020%20__e-production_E-80030_TF_1103_0617

JOC Staff.  JOC Rankings: US–Carib/Central America trade tumbles in 2020 Nov 30, 2020 https://www.joc.com/maritime-news/joc-rankings-slowing-us%E2%80%93caribcentral-america-trade-tumbles-2020_20201130.html?utm_campaign=CL_JOC%20Port%20Newsletter%2012%2F2%2F20%20__e-production_E-83092_TF_1202_0900&utm_medium=email&utm_source=Eloqua

Mongelluzzo, B.  Import deluge fills LA-LB terminals to capacity Dec 09, 2020 https://www.joc.com/port-news/us-ports/import-deluge-fills-la-lb-terminals-capacity_20201209.html?utm_source=Eloqua&utm_medium=email&utm_campaign=CL_JOC%20Daily%20Newswire%2012%2F10%2F2020__e-production_E-84332_KB_1210_0617

Mongelluzzo, B. Asia-US import surge slowing slightly, but spreading to East, Gulf coasts Dec 14, 2020 https://www.joc.com/maritime-news/container-lines/asia-us-import-surge-slowing-slightly-spreading-east-gulf-coasts_20201214.html?utm_source=Eloqua&utm_medium=email&utm_campaign=CL_JOC%20Daily%20Newswire%2012%2F15%2F2020__e-production_E-84893_KB_1215_0617

Mongelluzzo, B. US East Coast ports avoid gridlock despite rising volumes. Dec 16, 2020. https://www.joc.com/port-news/us-ports/us-east-coast-ports-avoid-gridlock-despite-rising-volumes_20201216.html?utm_source=Eloqua&utm_medium=email&utm_campaign=CL_JOC%20Daily%20Newswire%2012%2F17%2F2020__e-production_E-85162_KB_1216_2139

Mongelluzzo, B.  Increasing vessel sizes a red flag for US ports. Dec 21, 2020 https://www.joc.com/maritime-news/container-lines/increasing-vessel-sizes-red-flag-us-ports_20201221.html?utm_source=Eloqua&utm_medium=email&utm_campaign=CL_JOC%20Daily%2012%2F22%2F20_JOC%20Daily%20Newswire_e-production_E-85422_KB_1222_0617

Mongelluzzo, B. US imports from Asia hit record December level. Jan 19, 2021 https://www.joc.com/maritime-news/container-lines/us-imports-asia-hit-record-december-level_20210119.html?utm_source=Eloqua&utm_medium=email&utm_campaign=CL_JOC%20Daily%201%2F20%2F21_PC00000_e-production_E-87262_KB_0120_0617

Mongeluzzo, B. Additional port capacity alone can’t solve congestion issues: LA-LB. Journal of Commerce. April 2021 https://www.joc.com/port-news/us-ports/additional-port-capacity-alone-can%E2%80%99t-solve-congestion-issues-la-lb_20210407.html?utm_source=Eloqua&utm_medium=email&utm_campaign=CL_JOC%20Daily%204%2F8%2F21_PC00000_e-production_E-95420_KB_0408_0837

Posted by Faith Campbell

We welcome comments that supplement or correct factual information, suggest new approaches, or promote thoughtful consideration. We post comments that disagree with us — but not those we judge to be not civil or inflammatory.

For a detailed discussion of the policies and practices that have allowed these pests to enter and spread – and that do not promote effective restoration strategies – review the Fading Forests report at http://treeimprovement.utk.edu/FadingForests.htm


Korea seeks (again!) to export high-risk trees to America

dwarfed Ulmus davidiana; photo by Krzsztof Zianek; Wikipedia Commons

USDA APHIS is seeking public input on a risk assessment that is intended to evaluate the risk of allowing importation of dwarf elm trees (bunjae) from South Korea. Importation of these trees is currently prohibited under APHIS’ authority to require a risk assessment before importation under the NAPPRA program. Upon receiving the Korean request, APHIS must decide whether to maintain the prohibition, or alter it. The risk assessment can be obtained here.  Comments are due January 11, 2021.

I urge those with expert knowledge about phytophagous insects, nematodes, and fungal and other pathogens to prepare your own comments to APHIS.

[A year ago, Korea sought permission to export dwarfed maple trees to the U.S. CISP commented on APHIS’ risk assessment at that time; see my blog here. I believe APHIS has not yet decided whether to allow such imports. Many of the same issues apply here.]

After reviewing the risk assessment, I conclude that there are too many high-risk pests to support removing the taxon from the current restrictions. The history of introductions on dwarfed trees in the past supports this conclusion. The most conspicuous is the citrus longhorned beetle (Anoplophora chinensis) – the reason for the original NAPPRA listing – but there have been others, too.

The risk assessment has some strengths. I applaud the assessors for noting in each pest review that since the proposed imports are propagative material, all the pests will arrive on living hosts. The assessment then discusses – briefly! – the mechanisms by which the pest or pathogen could disperse to infest new trees – e.g., flight, rain splash, irrigation water. However, I think the assessment is sometimes too cautious in describing probable invasive risks.

I also find several important weaknesses in both the risk assessment process generally and specific findings.

Weaknesses of the Risk Assessment Process

The assessors do not discuss the potential efficacy of pest-management actions taken by the exporter or by USDA at ports of entry. They outlined production and harvesting practices that they assumed would apply to the exported plants. They warned that the risk assessment finding could not be applied to plants produced or handled other under conditions.

I am troubled by the assessors’ decision not to consider the plants’ ages and sizes. There is evidence that age and size are very important in determining the likelihood of pest presence. Perhaps the decision reflects the assumption that the exported plants would be less than four years old. Still, the assessors should have been transparent about the reasoning behind this decision.

The assessment underestimates “uncertainty”. One manifestation is the decision to provide little information about whether pests or pathogens known to attack several Eurasian species of Ulmus might also attack North American elm species. This gap arises, I believe, from the International Plant Protection Organization (IPPC) and APHIS requirement that risk analysts consider only pest-host relationships described in the literature or inferred from port interception data. I find this narrow approach to be a weakness, given how many unknown pest-host relationships have proved to be highly damaging. This issue arises specifically in the reviews of the nematode Meloinema kerongense and several powdery mildews (Erysiphe kenjiana, E. ulmi and Podosphaera spiralis) – all of which are identified as affecting at least some elm species.  

Perhaps the missing information has fewer consequences here, since the NAPPRA process does not require that APHIS prove the pest-host relationship for every pest evaluated in order to justify retaining the prohibition on importation. The well-documented history of detecting the citrus longhorned beetle in artificially dwarfed trees and as a pest of the Ulmus genus provides more than sufficient justification to retain trade restrictions. Still, if APHIS is conducting a formal risk assessment, it should be thorough. Anything else sets an unfortunate precedent.

Finally, in cases when some of the hosts considered are commercial crops – e.g., fruit trees – the assessment often does not include forest trees as economically important resources at risk.

Questions re: some of specific pests in the analysis

3.2.1. Cerambycidae (Coleoptera)

The risk assessment notes the minimal information available regarding several cerambycid beetles present in Korea that are capable of feeding on elm trees. Collectively, these beetles have a wide host range — Acer, Alnus, Citrus, Ficus, Hibiscus, Juglans, Malus, Morus, Quercus, Populus, Prunus, Pyrus, Salix, Sorbus, and Ulmus. The beetles can thrive in the climate present across most of the Lower 48 states (USDA Plant Hardiness Zones 6-9).  The risk assessment does mention the risk to urban and forest trees. It also mentions British detection of A. chinensis larvae in twigs of imported maple trees, but for some reason does not mention past U.S. detections and introductions of this beetle in maple bonsai/bunjae trees in Tukwila, Washington. Is this because the detections were 20 years ago? Does the passage of time make the detections any less relevant?

trees removed for CLB eradication in Tukwila, Washington

3.2.2. Archips xylosteana  (Lepidoptera: Tortricidae)

The analysis of this tortricid moth notes its broad host range, including Abies, Acer, Betula, Fraxinus, Populus, Quercus, Salix, Sorbus, Tilia, and Ulmus. Yet the analysis makes no mention of the potential impact of moth larval feeding on the buds and flowers of forest trees. Nor does it discuss the moth’s impact in Canada, where it is established. The Canadian experience seems quite pertinent and is an obvious omission.

3.2.3. Meloinema kerongens  

This nematode is present on elms in Korea. The assessors could find no information on the damage it causes to its hosts there. Again, there is no discussion of possible vulnerability of American elms. Apparently the nematodes are considered likely to survive the importation process, when the trees will be bare root. The assessors say that since the dwarfed trees (once imported) are likely to be planted in pots, that might limit the nematodes’ dispersal into native soil habitats and ability to infect new trees. This finding is troubling because it is likely that nematodes or their eggs could be present in the pots’ soil, and if that soil leaks from the pot or is disposed of during repotting or with other actions, pests could become established in native soil.

3.2.5. Helicobasidium mompa  

This fungus causes root rot on multiple genera in 44 plant families. The list of hosts includes Pinus spp., Populus spp., Prunus spp., and Quercus spp.  It appears to thrive in a wide climatic range covering virtually the entire Lower 48 states (USDA Plant Hardiness Zones 2-11). The fungus is spread via rain or irrigation water. I note that experience with the Phytophthora genus of brown algae has demonstrated how difficult it can be to control pathogens that spread in rain or irrigation water – in both nurseries and the wild.

Other Potential Pests

I urge experts to review the long list of pests not analyzed—especially the nematodes that inhabit the root and rhizosphere. Analysts did not analyze them because they are ectoparasites; they decided that ectoparasites were unlikely to remain with the dwarfed trees when they are shipped bare-root.

I also wonder whether the mistletoe Viscum album – a parasitic plant – might be spread onto the dwarfed trees by birds perching on branches or shelter structures above the production facilities. Assessors thought that dormant mistletoe on the plants would not be easily detected during visual inspection at the ports.  

Posted by Faith Campbell

We welcome comments that supplement or correct factual information, suggest new approaches, or promote thoughtful consideration. We post comments that disagree with us — but not those we judge to be not civil or inflammatory.

For a detailed discussion of the policies and practices that have allowed these pests to enter and spread – and that do not promote effective restoration strategies – review the Fading Forests report at http://treeimprovement.utk.edu/FadingForests.htm

Pests Associated with Imports: Rising Risk for Gulf States

Port of Mobile, Alabama Photo by Port of Mobile Authority

In August and September I blogged about the rapid increase in volumes of imports from Asia, especially China, in 2020. At the time, the information available to me focused on the Pacific coast ports, especially Long Beach and Los Angeles.

In the earlier blogs, I mentioned three concerns:

1.  Had the collapse in trade and travel during spring 2020 so reduced user fees that Department of Homeland Security Bureau of Customs and Border Protection (CBP) had to furlough Agriculture Quarantine Inspectors?  AQI inspections provide important incentives for importers to follow U.S. and international rules to reduce the risk that pests will be present in imports, for example, in wood packaging. 

2. The list of imports from China in the first half of 2020 includes $1 billion worth of nursery stock. This is down about 7% from 2019. However, from the perspective of preventing plant diseases and pests, these imports continue to be high risk and are still not adequately addressed by U.S. policy.

3. Other Asian regions are gaining in import share. Thus we can expect to see more pests arriving from countries other than China, like Vietnam.  

Cutbacks in Numbers of Inspectors?

CBP staff have told me that they are shifting AQI inspectors from covering incoming passengers – which are still far fewer than before the Pandemic – to inspecting cargo. By doing so, CBP has avoided cutting back on the total number of inspections of imported goods and associated wood packaging.

This is fortunate since Congress has not passed a new Covid-19 financing bill that might have included an increase in the appropriation for DHS CBP. The Continuing Resolution currently in effect funds the government only until December 11. So we have another chance to ask for an increase in appropriated funds for CBP (and APHIS!) for the remainder of Fiscal Year 2021 (which ends on October 1, 2021).

Volumes of Imports from Asia – Especially China  

As I reported in the earlier blog, while U.S. imports from China declined significantly in 2019  and early 2020 compared to earlier years, by the summer imports had rebounded — more than doubled (by value) between March and July.

Shifts in U.S. Ports

According to the Journal of Commerce, there is a gradual shift away from the twin ports of Los Angeles and Long Beach in the proportion of imported goods entering the country.  LA-LB handled 37.7% of the loaded twenty-foot equivalent containers (TEUs) entering the United States in 2018. This fell to 33.5% in July 2020. The initial reason was a decrease in imports from East Asia (including China, Hong Kong, Japan, South Korea, and Taiwan) compared to Southeast Asia, Europe, then South America and, finally, South Asia (primarily India).

Other source regions – e.g., the Caribbean, Middle East, Pacific, Africa, and Atlantic – were all below 2% of total numbers of TEU in all three years, and changed minimally over this period.

Another reason for the shift in ports utilized by importers is congestion and delays at North American Pacific coast ports, especially Los Angeles-Long Beach. U.S. imports from Asia moving through LA-LB increased 22% in both September and August from the same months last year – 828,880 TEU in September after 832,210 TEU in August.

Congestion is also a problem at the Canadian ports of Vancouver and Prince Rupert – which have actually seen small decreases in numbers of incoming containers.

One result is a small but significant shift to Gulf Coast ports, which have become more accessible through the widening of the Panama Canal in 2016. Before the Canal was widened, these ports handled less than 3% of total US imports from Asia. In the first nine months of 2020, US Gulf ports handled 608,387 TEU from Asia – or 5.2% of total US imports from Asia. This was a 5% increase from the same period last year.

These ports, stretching from Houston to Tampa, benefit from easy and relatively cheap rail transport to inland U.S. and even Canadian cities. Another factor is the heavy presence of Walmart – which has major distribution centers in Mobile and Houston.

The Gulf coast ports are expected to expand their importance as gateways for Asian imports as ocean carriers add more capacity between the two regions and ports upgrade and expand. New Orleans and Houston plan major expansions. Port Tampa Bay notes its proximity to markets around the Southeast. Already, import volumes into Tampa during the first nine months of 2020 were nearly double the prior year’s level. Tampa hopes to double its capacity over the next five years.

U.S. imports from Asia in October were 22.6% higher than a year ago. Imports through the East and Gulf coast ports jumped 14.6% and 48.4% from September 2020. Houston and Baltimore saw the greatest increases since September. There were also shifts in Pacific ports. Still, the Los Angeles-Long Beach port complex handled 49% of total US imports from Asia in October 2020.

Pest Risks to the Gulf Coast from Southeast Asia

Rising volumes of imports into the Gulf Coast present new opportunities for non-native insects and pathogens. The warm, wet climate of the region might be far more suitable to some insects and pathogens from tropical and subtropical Asia than the dry climate of southern California (except for areas that are irrigated artificially, such as golf courses, parks, and plant nurseries!).

redbay grove killed by laurel wilt; Photo by Scott Cameron

Already, the redbay ambrosia beetle and its associated pathogenic fungus has decimated native redbay and swamp bay trees and now threatens sassafras (see write-up under the “invasive species” tab here.)

Another Southeast Asian ambrosia beetle – the polyphagous shot hole borer with its associated pathogenic fungus – might also find the Gulf Coast states more inviting than southern California. In California, it is causing the greatest damage to trees that are artificially irrigated. Numerous tree species native to or grown in the Gulf states are known hosts, e.g., box elder, sweetgum, and southern magnolia. (PSHB is described under the “invasive species” tab here.) Both ambrosia beetles apparently were introduced via wood packaging material.

Southeast Asia is also the place of origin of other pathogens which – in this case – would more probably be introduced on imported plants rather than wood. These include the numerous species of Phytophthora recently detected in Vietnam.

As this region receives more goods from Asia, and as those goods arrive more rapidly so more likely to arrive alive, it is imperative that all stakeholders increase their vigilance to detect new invaders. And that they join others pressing for improved policies aimed at preventing introductions.

Posted by Faith Campbell

We welcome comments that supplement or correct factual information, suggest new approaches, or promote thoughtful consideration. We post comments that disagree with us — but not those we judge to be not civil or inflammatory.

For a detailed discussion of the policies and practices that have allowed these pests to enter and spread – and that do not promote effective restoration strategies – review the Fading Forests report here.

Projection: Alien Species Introductions Will Keep Going Up! Especially Arthropods!

Japanese knotweed

In 2017 I blogged about a study by Hanno Seebens and 44 coauthors that showed that the rate of new introductions of alien species has risen rapidly since about 1800 – and showed no sign of slowing down (a reference to the full article is at the end of this blog). Here’s a brief recap, followed by a 2020 update by Seebens and colleagues.

In 2017, Seebens et al. analyzed a database covering 45,813 first records of 16,926 alien species established in 282 distinct geographic regions. The year with the highest number of reported new detections was 1996 – 585, or an average of more than 1.5 sightings per day.

The authors found that the adoption of national and international biosecurity measures during the 20th Century had slowed introductions – but not sufficiently. Numbers of reported new introductions of fish and mammals had decreased since the early 1950s. However, first recorded introductions of vascular plant species remained high, and introductions of birds and reptiles also continued to rise, largely as pets in countries with strengthening economies.

For taxa introduced primarily accidentally on transport vectors or as contaminants of commodities (e.g., algae, insects, crustaceans, molluscs and other invertebrates), they found a strong correlation between their spread and the market value of goods imported into the region of interest – existing biosecurity regimes had not slowed down the accumulation of these alien taxa.

As a consequence, the authors expected that the numbers of new alien species would continue to increase.

As you are aware, since 2015 I have posted 15 blogs about the continued detections of tree pests in wood packaging, which remains one of the major pathways despite the international regulation ISPM#15. I have found it harder to track insect and pathogen introductions on imported plants, but it surely continues apace.

2020 Study Projects Continuing Rise in Introductions, Especially Arthropods 

Hanno Seebens and a smaller set of coauthors (see full reference at the end of this blog) have now produced an estimate of probable introduction rates in the future.  They looked at taxon–continent combinations for seven major taxonomic groups and eight continents (excluding Antarctica).

They found an overall increase in established alien species between 2005 and 2050 of 36%.

The study predicted that by the mid-21st Century, there will be distinct increases in alien species numbers, particularly for Europe, but also for Temperate Asia and North America, and for invertebrates in all regions. Europe ranked highest in absolute numbers of new alien species (~2,543; a 64% increase). Temperate Asia was projected to receive about 1,597 species (a 50% increase); North America about 1,484 (a 23% increase); South America about 1,391 (a 49% increase); and the Pacific Islands about 132. Only Australasia could expect a slower rise in introductions. The predicted trajectories of alien species numbers were surprisingly similar for mainland and island regions across taxonomic groups.

Invertebrates showed the highest relative increases. Rates of new detections of alien species were projected to accelerate for arthropods other than crustaceans worldwide, especially for North America (!). The study also projected higher relative increases for aquatic vascular plants and terrestrial insects

All drivers of introduction and invasion are predicted to intensify in the future. This is despite adoption of increasing numbers of countermeasures in recent decades. Most countries’ capacity to proactively counter the rising tide of invasive species is still poor. Furthermore, the principal drivers – intensification of trade and transport, land-use change, and access to new source pools – is expected to continue operating as now – “business as usual”.

spotted lanternfly Holly Ragusa, Pennsylvania Department of Agriculture

Current Status of “New” Detections

Seebens et al. (2020) relied on the Alien Species First Records Database for first detection records up to 2005. More than half (54%) of the first-detection records in the database are vascular plants. Arthropods other than crustaceans made up 28% of the total, birds 6%, fishes 4%, mammals 3%, molluscs 2%, and crustaceans 2%. The 2020 study confirmed the earlier finding that the observed first-record rates of mammals changed at around 1950 from an increasing to a decreasing trend. Finally, the total numbers of non-native species in the Database is much lower in aquatic habitats. (The authors do not discuss whether this reflects actual introductions or gaps in reporting.)

In the database, Europe recorded 38% of all first records, North America 16%, Australasia 15%, South America 9%, Temperate Asia 9%, Africa 6%, Pacific Islands 5% and Tropical Asia 2%.

A comparison to the immediate past (1960-2005) showed that the rates of emerging non-native species were projected to accelerate during 2005-2050, especially for arthropods. As I noted above, North America is predicted to have high increases in absolute numbers. Increases are also predicted for birds. Declines are predicted for mammals and fishes.  

Asian giant hornet; photo from University of Florida Department of Entomology

Projected increases for Australasia were consistently lower than in the past.          

Caveats:

1) The authors assumed that past patterns of alien species accumulation will continue in the future. They did not attempt to predict efforts to strengthen biosecurity regulations and mitigation strategies.  

2) Projections were calculated in the absence of data on many underlying drivers for the historic periods and some taxonomic groups. However, observed trends of newly-detected alien species numbers during the 20th century were surprisingly stable despite distinct political and socio-economic changes.

Seebens and colleagues conclude that implementation of targeted biosecurity efforts can reduce the numbers of new alien species becoming established. However, a significant decrease in rates of alien species numbers on a large scale can only be achieved by a coordinated effort that crosses political borders.

SOURCES

Seebens et al.  2017. No saturation in the accumulation of alien species worldwide available (free access!) at https://www.nature.com/articles/ncomms14435

Seebens, H., S. Bacher, T.M. Blackburn, C. Capinha, W. Dawson, S. Dullinger, P. Genovesi, P.E. Hulme, M. van Kleunen, I. Kühn, J.M. Jeschke, B. Lenzner, A.M. Liebhold, Z. Pattison, J. Perg, P. Pyšek, M. Winter, F. Essl. 2020. Projecting the continental accumulation of alien species through to 2050. Global Change Biology. 2020;00:1 -13 https://onlinelibrary.wiley.com/doi/10.1111/gcb.15333


Posted by Faith Campbell

We welcome comments that supplement or correct factual information, suggest new approaches, or promote thoughtful consideration. We post comments that disagree with us — but not those we judge to be not civil or inflammatory.

For a detailed discussion of the policies and practices that have allowed these pests to enter and spread – and that do not promote effective restoration strategies – review the Fading Forests report at http://treeimprovement.utk.edu/FadingForests.htm

Ash Mortality Accelerates – Population Regeneration Will Not Reverse Collapse

dead ash along Accotink Creek, Fairfax County, Virginia photo by F.T. Campbell

As we all know, the emerald ash borer (EAB) has killed millions of ash trees in its invaded range across eastern North America. However, field studies have detected robust regeneration of ash seedlings and saplings in various invaded areas. Ward et al. 2021 (full citation at end of blog) set out to determine whether this regeneration will result in recovery of mature ashes that can perform their ecological role. They conclude that it will not. Instead, they say, the EAB invasion will probably alter successional patterns and composition of large areas of naturally regenerating forests, causing a cascade of ecological impacts in ash-containing ecosystems

Ward and colleagues used USDA Forest Service Forest Inventory and Analysis (FIA data) to quantify ash recruitment and regeneration across the entire eastern United States. Theirs is the first study to evaluate trends across the region, rather than specific locations or stands. They related the FIA recruitment data to EAB spread, as measured by USDA Animal and Plant Health Inspection Service’ (APHIS) record of the first EAB detection in each county.

FIA inventories in 2002-2007 and 2013-2018 show large numbers of ash seedlings and saplings in counties invaded in the first wave of invasion, 2002–2006. These areas had higher densities of both seedlings and saplings than plots in other counties. The earliest-invaded counties were in areas that had extraordinarily high densities of ash before the EAB invasion, so the numbers of seedlings and saplings probably reflected that abundant seed source.

However, by the 2013-2018 inventory ash trees in the smallest overstory class (12.7 cm dbh) were dying at faster rates than they were recruited from seedlings or saplings in all 362 counties recorded by APHIS as EAB-infested before 2013. Ward and colleagues found these negative population trajectories on plots that have been invaded for more than about 10 years. This trend suggests that ash will continue to decline in abundance and may become functionally extinct across the invaded range.

Some U.S. Forest Service biologists are more optimistic about ash recovery in response to biocontrol of the EAB. See their podcast here.

In the risk of functional extinction, ash trees are unfortunately not unique. The authors note similar impacts from the invasion of the hemlock woolly adelgid and beech bark disease.

Data Reveal History of Invasion (spread)

Ward and colleagues focused on the risk of mortality for young ashes as they developed from seedlings to saplings, and, eventually, to overstory trees. The youngest “overstory” trees are 12.7 to 17 cm dbh. FIA data show that even the largest trees in this class are 3 cm smaller than trees that produce seeds.

Mortality was initially uniformly low – less than 2.1% — as measured by the first FIA inventory (2002–2007). This is not surprising because EAB was detected only in 2002, and then in only few counties. (EAB had probably been present for a decade before it was detected.)

By the 2013-2018 FIA inventory, mortality had quadrupled to 8–11% in counties invaded during the 2002–2006 period. In the counties invaded during the 2007–2012 period, morality also rose to 3-5%. Both measurements included all diameter classes. Annual mortality rates in the FIA 2013-2018 inventory were still highest for the counties invaded during 2002–2006 except for the largest trees (those greater than 40 cm dbh). By the time of the 2013-2018 FIA survey, overstory ash densities near the epicenter had since declined substantially. They had been nearly eliminated in some counties in southeastern Michigan. There were still sufficient numbers of smaller trees in the region to exhibit an elevated mortality rate – more than 10% per year in several counties in Michigan, Indian, and Ohio. By contrast, in the most recently invaded areas – those counties recorded by APHIS as infested after 2013 – there was very little change in ash densities compared to the 2002-2007 period. This is hardly surprising since it takes years for mortality to reach levels observable by the FIA process.

dead ash on edge of Pohick Bay, Fairfax County, Virginia photo by F.T. Campbell

Considering trees just entering the overstory category (those with diameters of 12.7 cm dbh), annual mortality increased substantially across the region. Between the first FIA inventory (conducted in 2002-2007) and the second inventory (conducted in 2013-2018), their average annual mortality rose more than four-fold, from 0.08 trees per ha to 0.37 trees per ha. By 2013-2018, recruitment in the 2002–2006 invasion cohort was about 50% less than tree mortality levels; recruitment and mortality were about equivalent for the counties invaded in the 2007–2012 period. Recruitment was [still] significantly higher than mortality for the counties recorded as invaded in 2013–2018. However, Ward and colleagues expect mortality rates of this cohort to accelerate over the next five to 10 years – even in areas with lower ash densities.

Ward and colleagues note that many of the young ash trees were dying before they could reach reproductive age – which they estimated to be about 20 years with a dbh of about 20 cm.

As the invasion progresses and hosts are depleted, mortality rates could slow, but, for ash to persist, it is critical that sufficient numbers of trees reach reproductive age before succumbing to residual EAB populations.

Other factors that might influence ash include competition with trees in other genera. The biocontrol agents now becoming established in young ash forests might increase the likelihood of ash persistence. Still, seed production and seedling survival will need to be frequent and widespread if they are to offset expected mortality. Resilience might also vary depending on individual species’ vulnerability to changes in the climate and to EAB (green and black ash are more vulnerable than white ash).

SOURCE

Ward, S.F., A.M. Liebhold, R.S. Morin, S. Fei. 2021. Population dynamics of ash across the eastern USA following invasion by emerald ash borer. Forest Ecology and Management 479 (2021) 118574

Posted by Faith Campbell

We welcome comments that supplement or correct factual information, suggest new approaches, or promote thoughtful consideration. We post comments that disagree with us — but not those we judge to be not civil or inflammatory.

For a detailed discussion of the policies and practices that have allowed these pests to enter and spread – and that do not promote effective restoration strategies – review the Fading Forests report at http://treeimprovement.utk.edu/FadingForests.htm