US invasive species — updated USGS database now on-line

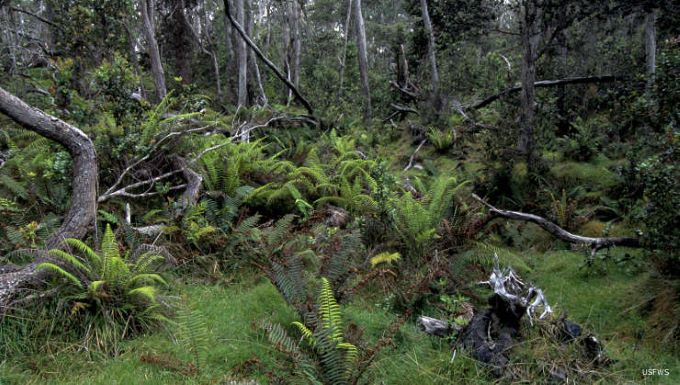
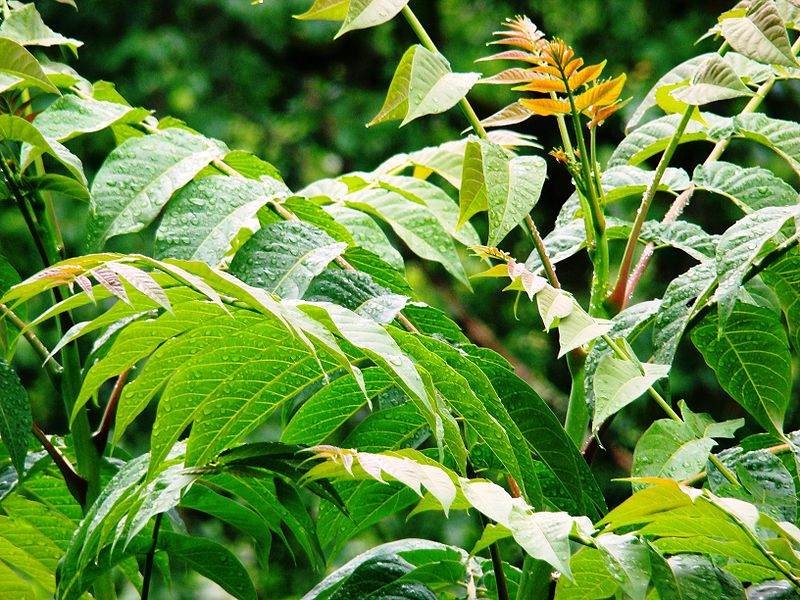
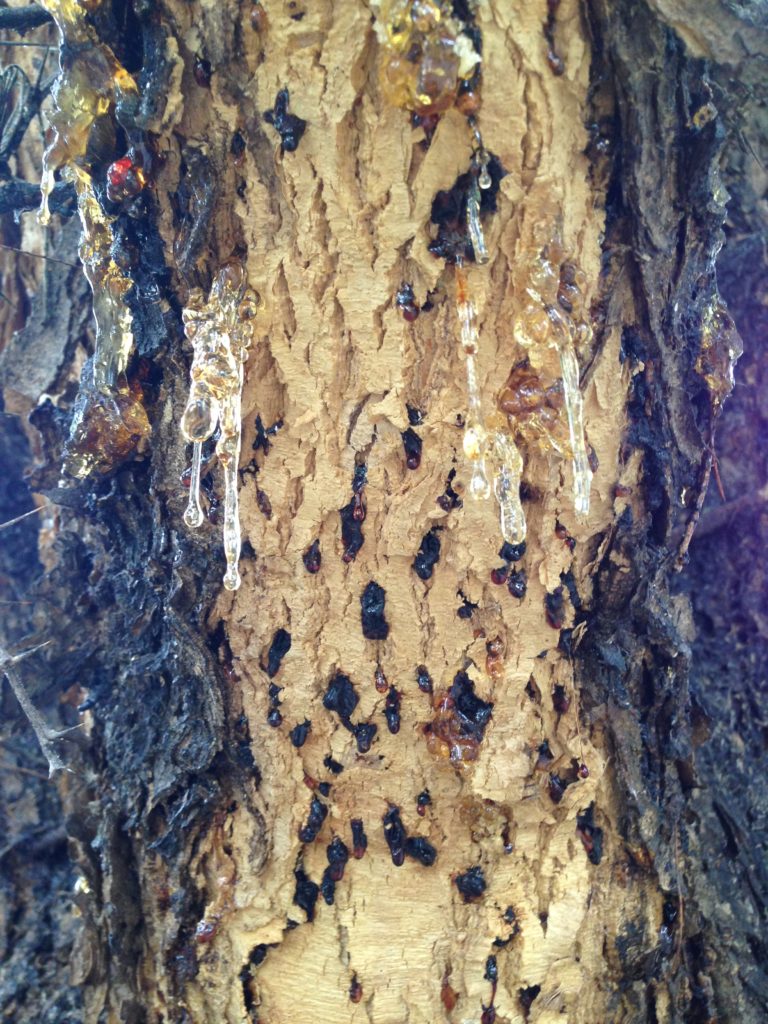
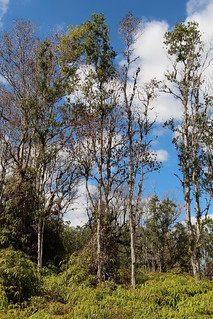
ōhiʻa rust on Hawai`i; photo by J.B. Friday

The U.S. Geological Survey (USGS) has published an updated register of introduced species in the United States. The master list contains 14,700 records, of which 12,571 are unique scientific names. The database is divided into three sub-lists: Alaska, with 545 records; Hawai`i, with 5,628 records; and conterminous (lower 48) United States, with 8,527 records.

The project tracks all introduced (non-native) species that become established, because they might eventually become invasive. The list includes all taxa that are non-native everywhere in the locality (Alaska, Hawai`i, or 48 conterminous states) and established (reproducing) anywhere in that locality.

Each record has information on taxonomy, a vernacular name, establishment means (e.g.,  unintentionally, or assisted colonization), degree of establishment (established, invasive, or widespread invasive), hybrid status, pathway of introduction (if known), habitat (if known), whether a biocontrol species, dates of introduction (if known; currently 47% of the records), associated taxa (where applicable), native and introduced distributions (when known), and citations for the authoritative source(s) from which this information is drawn. 

The 2022 version is more complete re: plant pathogens than earlier iterations; I thank the hard-working compilers for their efforts!

Hawai`i

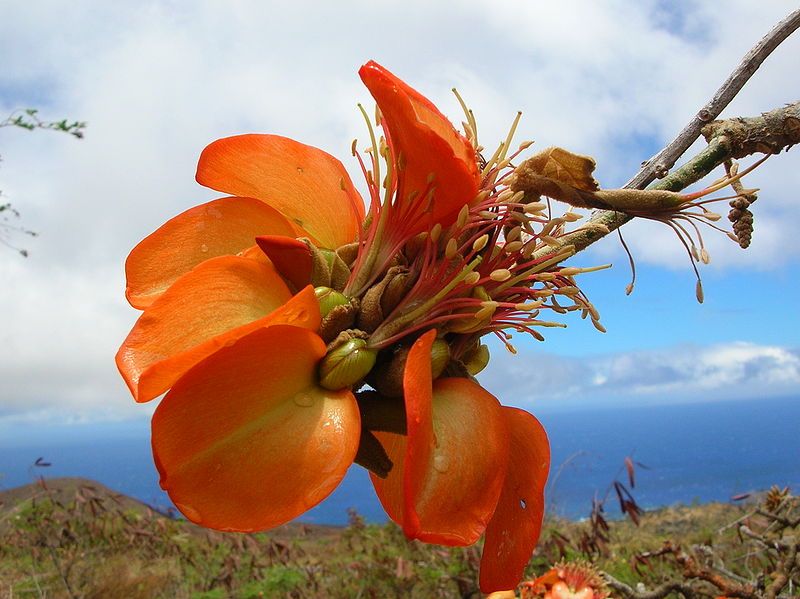
wiliwili tree (Erythrina sandwicensis); photo by Forest and Kim Starr

Among the non-native species listed as being in Hawai`i are 3,603 Arthropods, including the following about which I have blogged:

The list also includes 25 fungi, among them the two species of Ceratocystis that cause rapid ʻōhiʻa death; DMF & blog 270 and the ʻōhiʻa or myrtle rust, Austropuccinia psidii.

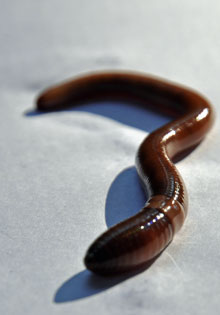
Also listed are 95 mollusk species and 20 earthworm species. I wonder who is studying the worms’ impacts? I doubt any is native to the Islands.

The Hawaiian list contains 1,557 non-native plant species. Families with largest representation are Poaceae (grass) – 223 species; Fabaceae (beans) – 156 species; and Asteraceae – 116 species. About a third of the plant species – 529 species – are designated as “widespread invaders”. This number is fifteen times higher than the numbers in lists maintained by either the Hawaiian Ecosystems At Risk project (106 species) [HEAR unfortunately had to shut down a decade ago due to lack of funds]; or Hawaiian Invasive Species Council (80 species). Furthermore, some of the species listed by HEAR and HISC are not yet widespread; the lists are intended to facilitate rapid responses to new detections.  We always knew Hawai`i was being overrun by invasive species!

Among the 529 most “widespread invaders” are the following from the most introduced families:

  • Poaceae – Agrostis stolonifera, 6 Cenchrus spp, 2 Cortaderia spp, 3 Eragrostis,8 Paspalum, 4 Setaria spp, 2 Urochloa (Poacae)
  • Fabaceae – 3 Acacia, 2 Prosopis

Other families have fewer introduced species overall, but notable numbers of the most widespread invaders:

  • Euphorbiaceae – 8 spp. of Euphorbia
  • Cyperaceae – 6 spp. of Cyperus
  • Myrtaceae – Melaleuca quinquenervia, 2 Psidium, Rhodomyrtus tomentosa rose myrtle, 3 Syzygium [rose myrtle has been hard-hit by the introduced myrtle rust fungus]
  • Zingiberaceae – 3spp. Hedychium (ginger)
  • Anacardiaceae — Schinus molle (Peruvian peppertree); USGS considers congeneric S. terebinthifolia to be somewhat less widespread.

Plus many plant taxa familiar to those of us on the continent: English ivy, privet, castor bean, butterfly bush, Ipomoea vines  … and in more limited regions, Japanese climbing fern Lygodium japonicum.
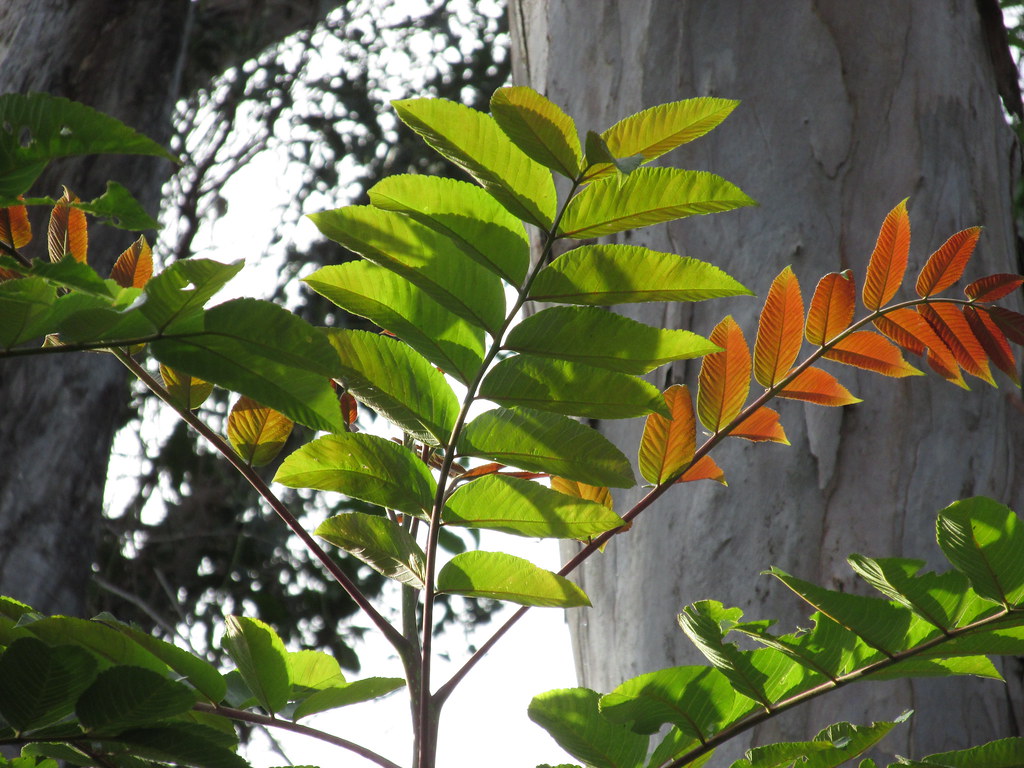
Rhus sandwicensis; photo by Forest and Kim Starr

I learned something alarming from the species profiles posted on the HISC website: the Hawaiʻi Division of Forestry and Wildlife and Hawaiʻi Department of Agriculture are considering introduction of a species of thrips, Pseudophilothrips ichini, as a biocontrol agent targetting S. terebinthifolia. I learned in early 2019, when preparing comments on Florida’s proposed release of this thrips, that Pseudophilothrips ichini can reproduce in low numbers on several non-target plant species, including two native Hawaiian plants that play important roles in revegetating disturbed areas. These are Hawaiian sumac Rhus sandwicensis and Dodonea viscosa. The latter in particular is being propagated and outplanted in large numbers to restore upland and dryland native ecosystems. While the environmental assessment prepared by the USDA Animal and Plant Service says the thrips causes minimal damage to D. viscosa, I am concerned because of the plant species’ ecological importance.  Of course, the two Schinus species are very damaging invasive species in Hawai`i … but I think introducing this thrips is too risky. [To obtain a copy of CISP’s comments, put a request in comments section. Be sure to include your email address in your comment; the section algorithm does not include email addresses (how inconvenient!).]

Continental (lower 48) states

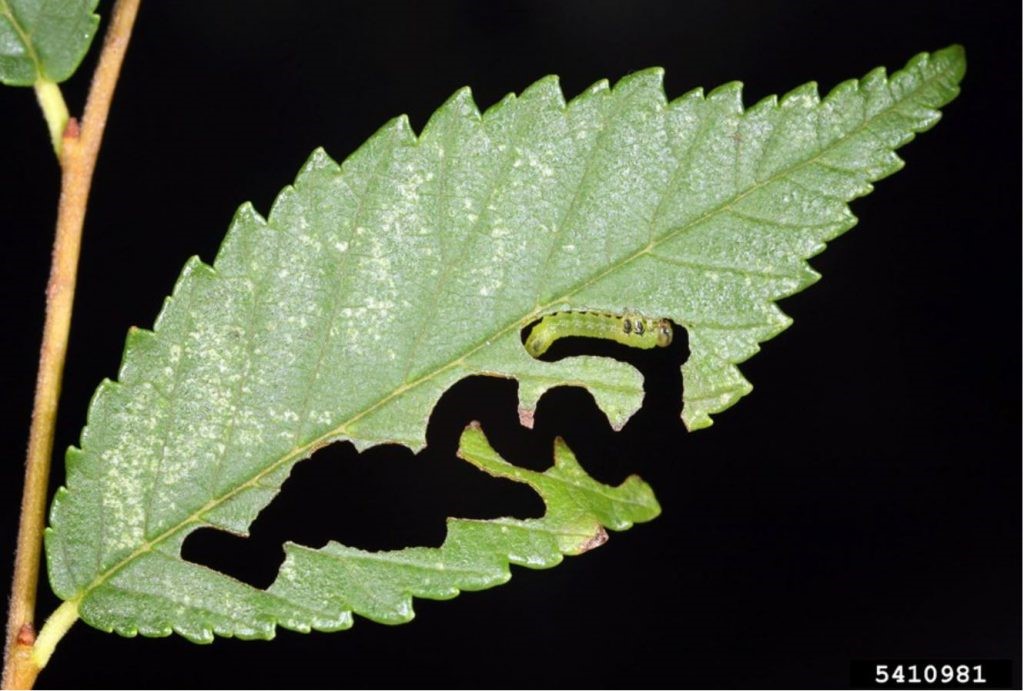
Among the 8,500 species listed in the USGS Register for the 48 continental states are 4,369 animals, among them 3,800 arthropods; 3,999 plants; and just 89 fungi. Among the arthropods, there are 1,045 beetles and 308 lepidopterans. The beetles listed include 12 Agrilus (the genus which includes emerald ash borer and goldspotted oak borer.) It does not include the elm zig-zag sawfly USGS staff have not found any publications documenting its U.S. occurrences. Among the microbes are six Phytophthora (P. cinnamomi, P. lateralis, P. pseudocryptogea, P. quercina, P. ramorum, P. tentaculata). Profiles of several of these species are posted at www.dontmovefirewood.org; click on “invasive species”, then scroll using either Latin or common name.

elm zig-zag sawfly; photo by Gyorgy Czoka via Bugwood

Citation:

Simpson, Annie, Pam Fuller, Kevin Faccenda, Neal Evenhuis, Janis Matsunaga, and Matt Bowser, 2022, United States Register of Introduced and Invasive Species (US-RIIS) (ver. 2.0, November 2022): U.S. Geological Survey data release, https://doi.org/10.5066/P9KFFTOD

United States Register of Introduced and Invasive Species; US-RIIS ver. 2.0, 2022

 If you would like to contribute to future versions of the US-RIIS, please email the project leaders at us-riis@usgs.gov

Posted by Faith Campbell

We welcome comments that supplement or correct factual information, suggest new approaches, or promote thoughtful consideration. We post comments that disagree with us — but not those we judge to be not civil or inflammatory.

For a detailed discussion of the policies and practices that have allowed these pests to enter and spread – and that do not promote effective restoration strategies – review the Fading Forests report at http://treeimprovement.utk.edu/FadingForests.htm

or
www.fadingforests.org

Invasions cost protected areas more than $22 billion in 35 years

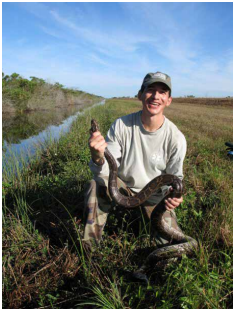
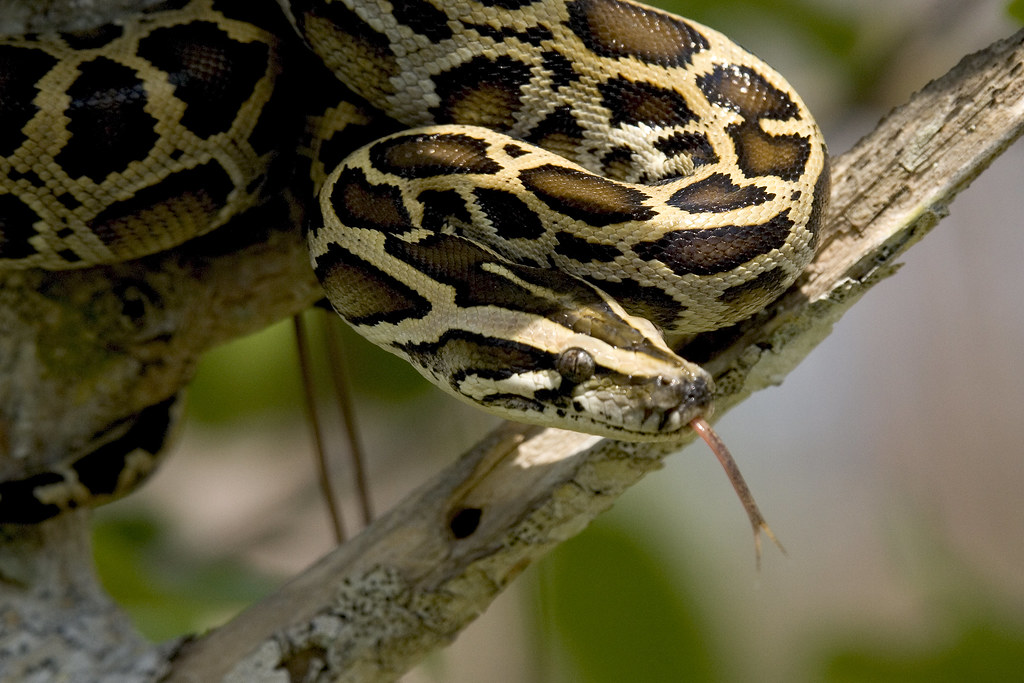
Burmese python in Everglades National Park; photo by Bob Reed, US FWS

Scientists continue to apply data collected in an international database (InvaCost; see “methods” section of Cuthbert et al.; full citation at end of this blog) to estimate the economic costs associated with invasive alien species (IAS). These sources reported $22.24 billion in economic costs of bioinvasion in protected areas over the 35-year period 1975 – 2020. Because the data has significant gaps, no doubt invasions really cost much more.

Moodley et al. 2022 (full citation at end of this blog) attempt to apply these data to analyze economic costs in protected areas. As they note, protected areas are a pillar of global biodiversity conservation. So it is important to understand the extent to which bioinvasion threatens this purpose. 

Unfortunately, the data are still too scant to support any conclusions. Such distortions are acknowledged by Moodley et al. I will discuss the data gaps below a summary of the study’s findings.

The Details

Of the estimated $22.24 billion, only 4% were observed costs; 96% were “potential” costs (= extrapolated or predicted based on models). Both had generally increased in more recent years, especially “potential” costs after 1995. As is true in other analyses of InvaCost data, the great majority (73%) of observed costs covered management efforts rather than losses due to impacts. The 24% of total costs ascribed to losses, or damage, exceeded the authors’ expectation. They had thought that the minimal presence of human infrastructure inside protected areas would result in low records of “economic” damages.

The great majority (83%) of reported management costs were reactive, that is, undertaken after the invasion had occurred. In terrestrial environments, there were significantly higher bioinvasion costs inside protected areas than outside (although this varied by continent). However, when considering predicted or modelled costs, the importance was reversed: expected management costs represented only 5% while these “potential” damages were 94%.

Higher expenditures were reported in more developed countries – which have more resources to allocate and are better able to carry out research documenting both damage and effort. 

More than 80% of management costs were shouldered by governmental services and/or official organizations (e.g. conservation agencies, forest services, or associations). The “agriculture” and “public and social welfare” sectors sustained 60% of observed “damage” and 89% of “mixed damage and management” costs respectively. The “environmental” and “public and social welfare” sectors together accounted for 94% of all the “potential” costs (predicted based on models) generated by invasive species in protected areas; 99% of damage costs. With the partial exception of the agricultural sector, the economic sectors that contribute the most to movement to invasive species are spared from carrying the resulting costs.

Lord Howe Island, Australia; threatened by myrtle rust; photo by Robert Whyte, via Flickr

Invasive plants dominated by numbers of published reports – 64% of reports of observed costs, 79% of reports of “potential”. However, both actual and “potential” costs allotted to plant invasions were much lower than for vertebrates and invertebrates. Mammals and insects dominated observed animal costs.

It is often asserted that protected areas are less vulnerable to bioinvasion because of the relative absence of human activity. Moodley et al. suggest the contrary: that protected areas might be more vulnerable to bioinvasion because they often host a larger proportion of native, endemic and threatened species less adapted to anthropogenic disturbances. Of course, no place on Earth is free of anthropogenic influences; this was true even before climate change became an overriding threat. Plenty of U.S. National parks and wilderness areas have suffered invasion by species that are causing significant change (see, for example, here, here, and here).

Despite Best Efforts, Data are Scant and Skewed

Economic data on invasive species in protected areas were available for only a tiny proportion of these sites — 55 out of 266,561 protected areas.

As Moodley et al. state, their study was hampered by several data gaps:

  1. Taxonomic bias – plants are both more frequently studied and managed in protected areas, but their reported observed costs are substantially lower than those of either mammals or insects.
  2. The data relate to economic rather than ecological effects. The costliest species economically might not cause the greatest ecological harm.
  3. Geographical bias – studies are more plentiful in the Americas and Pacific Islands. However, studies from Europe, Africa and South America more often report observed costs. The South African attention to invasive species (see blogs here, here, and here), and economic importance of tourism to the Galápagos Islands exacerbate these data biases.
  4. Methodological bias – although reporting bioinvasion costs has steadily increased, it is still erratic and dominated by “potential” costs = predictions, models or simulations.

I note that, in addition, individual examples of high-cost invasive species are not representative. The highest costs reported pertained to one agricultural pest (mango beetle) and one human health threat (mosquitoes).

Great Smokey Mountains National Park; threatened by mammals (pigs), forest pests, worms, invasive plants … Photo by Domenico Convertini via Flickr

As these weaknesses demonstrate, a significant need remains for increased attention to the economic aspects of bioinvasion – especially since political leaders pay so much greater attention to economics than to other metrics. However, the reported costs – $22.24 billion over 35 years, and growing! – are sufficient in the view of Moodley et al. to support advocating investment of more resources in invasive species management in protected areas, including – or especially – it is not quite clear — preventative measures.

SOURCES

Cuthbert, R.N., C Diagne, E.J. Hudgins, A. Turbelin, D.A. Ahmed, C. Albert, T.W. Bodey, E. Briski, F. Essl, P.J. Haubrock, R.E. Gozlan, N. Kirichenko, M. Kourantidou, A.M. Kramer, F. Courchamp. 2022. Bioinvasion cost reveals insufficient proactive management worldwide. Science of The Total Environment Volume 819, 1 May, 2022, 153404

Moodley, D., E. Angulo, R.N. Cuthbert, B. Leung, A. Turbelin, A. Novoa, M. Kourantidou, G. Heringer, P.J. Haubrock, D. Renault, M. Robuchon, J. Fantle-Lepczyk, F. Courchamp, C. Diagne. 2022.  Surprisingly high economic costs of bioinvasions in protected areas. Biol Invasions. https://doi.org/10.1007/s10530-022-02732-7

Posted by Faith Campbell

We welcome comments that supplement or correct factual information, suggest new approaches, or promote thoughtful consideration. We post comments that disagree with us — but not those we judge to be not civil or inflammatory.

For a detailed discussion of the policies and practices that have allowed these pests to enter and spread – and that do not promote effective restoration strategies – review the Fading Forests report at http://treeimprovement.utk.edu/FadingForests.htm

or www.fadingforests.org
Plants Depend on Animals – and They are Disappearing

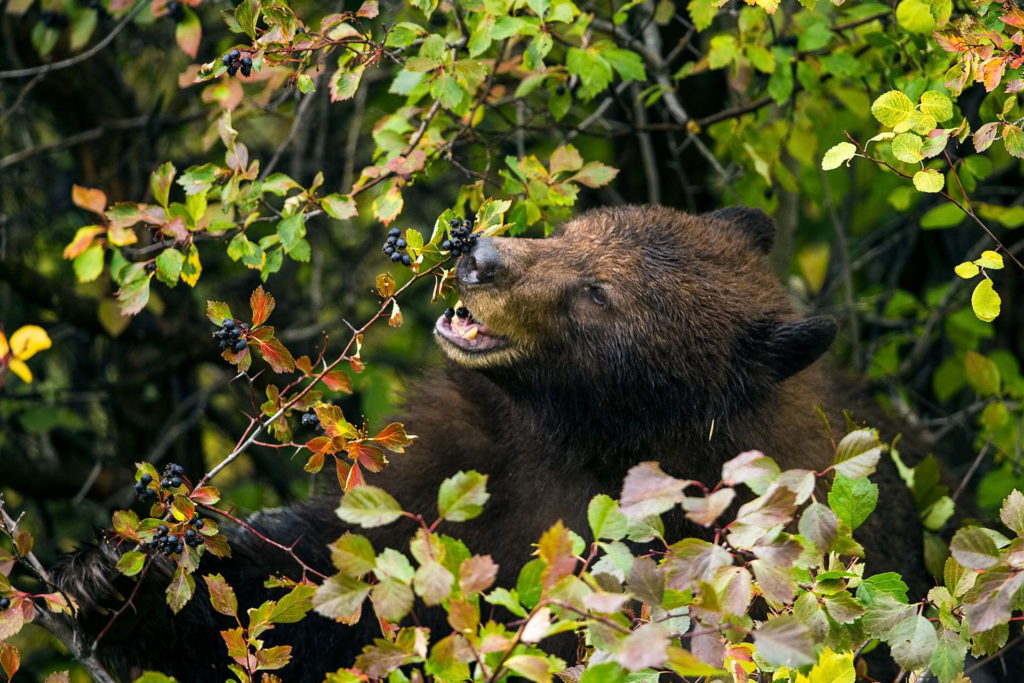
black berry eating hawthorn berries; photo by Paul D. Vitucci

Articles by Evan Fricke and colleagues remind us to look more broadly at bioinvasion to consider the impact on ecosystem function and evolution. They focus on animal interactions with plants in the shared environment, especially animals’ role as seed dispersers.

The authors also remind us that natural barriers explain why there are different species in different areas and thus how evolution and speciation follow different paths in different places. Think of Galapagos finches evolving in isolation from a few ancestors that somehow made it over the ocean from mainland South America.

These points are made in two recent articles.

In the first, Fricke and Svenning 2020 (full citation at end of this blog) note that about half of all plant species depend on animals to disperse their seeds. Animal seed dispersal is influenced by several drivers of global change, including local or generalized extinction (= defaunation); bioinvasion; and habitat fragmentation. The decline of large vertebrates has a particularly important role in these interactions.

Their study focused on fleshy-fruited plants that are dispersed by animals. (The study does not include nuts, e.g., acorns, which are presumably subject to some of the same pressures.) They expect evolution of the affected plants and animals to proceed differently as a result of the new partnerships, but they did not study any such interactions.

Their study covered animal seed-dispersal interactions with plants at 410 locations. The data encompassed 24,455 unique animal-plant pairs involving 1,631 animal and 3,208 plant species. Three quarters of the animals were birds; most of the rest were mammals, primarily bats and primates. Only 1% were in other animal groups – lizards, tortoises, or fish.

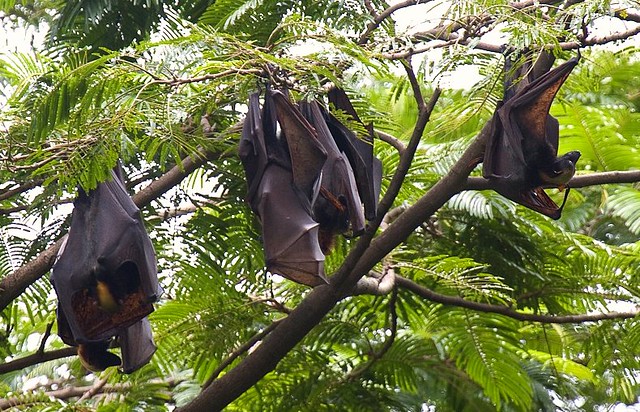
fruit bats on Luzon, Philippines; photo by Francesco Vernonesi; Flickr.com

They found that introduced plants and animals are twice as likely as native species to interact with introduced partners. The resulting interactions are likely to amplify biotic homogenization in future ecosystems. Already, introduced species have largely replaced missing native frugivore species in some places. In fact, mutualisms in which either or both the plant and animal is an introduced species are now about seven times higher than decades ago.

These mutual-benefit interactions of introduced species are even more prevalent in areas where human modification of the environment is greater. The proportion of introduced species and of novel interactions caused by introduced plant or animal species was higher for oceanic island systems than for continental bioregions. This finding adds a new dimension to the already recognized heightened susceptibility of remote islands to invasion and their loss of native species. Continental bioregions’ networks typically had few introduced animals and a greater prevalence of intro plants than animals.

Fricke and colleagues think plant-frugivore networks are likely to increasingly favor a relatively few introduced generalists over many native species, reducing the uniqueness of future biotas. The result might be to reduce resilience of terrestrial ecosystems by, first, allowing perturbations to propagate more quickly; and, second, by exposing disparate ecosystems to similar drivers. They called for giving higher priority to managing increasing ecological homogenization.

In the second article, Fricke, Ordonez, Rogers, and Svenning (2022) note that climate change requires many plant species to shift their populations hundreds of meters to tens of kilometers per year to track their climatic niche. Earth is also experiencing the formation of novel communities as species introductions and shifting ranges result in co-occurrence of species that do not share co-evolutionary history. They conclude that the novel mutualistic interaction networks will influence whether certain plant species persist and spread.

These authors examined four scenarios to assess how current long-distance dispersal has been affected by past defaunation and invasion and how it is threatened by species endangerment. These scenarios are as follows:

1st scenario (current scenario) = natural and introduced ranges of extant species today.

2nd scenario (natural scenario) = mammal and bird ranges as they would be if unaffected by extinctions, range contractions, or introductions.

3rd scenario (extinction scenario) = those bird and mammal species listed as vulnerable or endangered by the IUCN go extinct.

4th scenario (extirpation of introduced species scenario) = introduced species are extirpated.

Fricke and colleagues estimate that extinction of at least local populations of seed-dispersing mammals and birds has already reduced the capacity of plants to track climate change by 60% globally. The effect is strongest in temperate regions and regions with little topographic complexity. Two examples are eastern North America and Europe. These regions face a double threat: rapid climate change and loss of large mammals that provided long-distance dispersal.

The extinction scenario is most evident in Southeast Asia and Madagascar. The remaining animal seed dispersers are already threatened or endangered. Fricke and colleagues project that future loss of vulnerable and endangered species from their current ranges would result in a further reduction of 15% in the capacity of plants to track climate change.

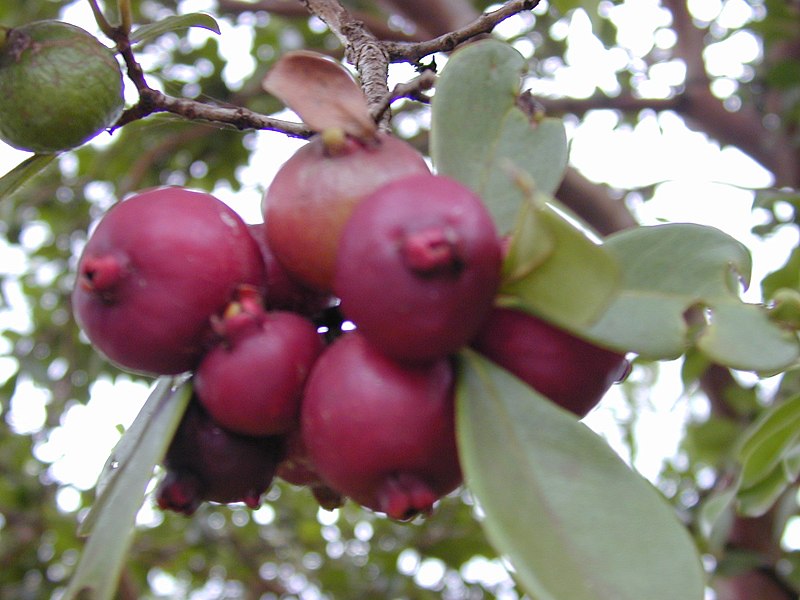
The contrary situation is found on islands which have few native mammals. Introduced species are now important long-distance seed dispersers. In some cases, the introduced animals are dispersing invasive plant seeds, e.g., on Hawai`i feral hogs are spreading the invasive plant strawberry guava (Psidium cattleianum).

strawberry guava on Maui; photo by Forest and Kim Starr

People’s actions have resulted in ecoregions disproportionately losing the species that provide long-distance seed dispersal function, i.e., large mammals. In other words, human activities have caused not only rapid climate change—requiring broad-scale range shifts by plants—but also defaunation of the birds and mammals needed by plants to do so. Habitat fragmentation and other land-use changes will likely amplify existing constraints on plant range shifts.

Fricke and colleagues say their findings emphasize the importance of not only promoting habitat connectivity to maximize the functional potential of current seed dispersers but also restoring biotic connectivity through the recovery of large-bodied animals to increase the resilience of vegetation communities under climate change.

SOURCES

Fricke, E. C., & Svenning, J. C. (2020). Accelerating homogenization of the global plant–frugivore meta-network. Nature585(7823), 74-78. https://www.nature.com/articles/s41586-020-2640-y

Fricke, E. C., Ordonez, A., Rogers, H. S., & Svenning, J. C. (2022). The effects of defaunation on plants’ capacity to track climate change. Science375(6577), 210-214. https://www.science.org/doi/full/10.1126/science.abk3510

Posted by Faith Campbell

We welcome comments that supplement or correct factual information, suggest new approaches, or promote thoughtful consideration. We post comments that disagree with us — but not those we judge to be not civil or inflammatory.

For a detailed discussion of the policies and practices that have allowed these pests to enter and spread – and that do not promote effective restoration strategies – review the Fading Forests report at http://treeimprovement.utk.edu/FadingForests.htm

What Do Invasive Species Cost?

brown tree snake Boiga irregularis; via Wikimedia; one of the species on which the most money is spent on preventive efforts

In recent years a group of scientists have attempted to determine how much invasive species are costing worldwide. See Daigne et al. 2020 here.

Some of these scientists have now gone further in evaluating these data. Cuthbert et al. (2022) [full citation at end of blog] see management of steadily increasing numbers of invasive, alien species as a major societal challenge for the 21st Century. They undertook their study of invasive species-related costs and expenditures because rising numbers and impacts of bioinvasions are placing growing pressure on the management of ecological and economic systems and they expect this burden to continue to rise (citing Seebens et al., 2021; full citation at end of blog).

They relied on a database of economic costs (InvaCost; see “methods” section of Cuthbert et al.) It is the best there is but Cuthbert et al. note several gaps:

  • Only 83 countries reported management costs; of those, only 24 reported costs specifically associated with pre-invasion (prevention) efforts.
  • Data comparing regional costs do not incorporate consideration of varying purchasing power of the reporting countries’ currencies.  
  • Data available are patchy so global management costs are probably substantially underestimated. For example, forest insects and pathogens account for less than 1% of the records in the InvaCost database, but constitute 25% of total annual costs ($43.4 billion) (Williams et al., in prep.) .

Still, their findings fit widespread expectations.  

These data point to a total cost associated with invasive species – including both realized damage and management costs – of about $1.5 trillion since 1960.  North America and Oceania spent by far the greatest amount of all global money countering bioinvasions. North America spent 54% of the total expenditure of $95.3 billion; Oceania spent 30%. The remaining regions each spent less than $5 billion.

Cuthbert et al. set out to compare management expenditures to losses/damage; to compare management expenditures pre-invasion (prevention) to post-invasion (control); and to determine potential savings if management had been more timely.

Economic Data Show Global Efforts Could Be – But Aren’t — Cost-Effective

The authors conclude that countries are making insufficient investments in invasive species management — particularly preventive management. This failure is demonstrated by the fact thatreported management expenditures ($95.3 billion) are only 8% of total damage costs from invasions ($1.13 trillion). While both cost or losses and management expenditures have risen over time, even in recent decades, losses were more than ten times larger than reported management expenditures. This discrepancy was true across all regions except the Antarctic-Subantarctic. The discrepancy was especially noteworthy in Asia, where damages were 77-times higher than management expenditures.

Furthermore, only a tiny fraction of overall management spending goes to prevention. Of the $95.3 billion in total spending on management, only $2.8 billion – less than 3%  – has been spent on pre-invasion management. Again, this pattern is true for all geographic regions except the Antarctic-Subantarctic. The divergence is greatest in Africa, where post-introduction control is funded at more than 1400 times preventive efforts. It is also significant for Asia and South America.

Even in North America – where preventative actions were most generously funded – post-introduction management is funded at 16 times that of prevention.

Cuthbert et al. worry particularly about the low level of funding for prevention in the Global South. They note that these conservation managers operate under severe budgetary constraints. At least some of the bioinvasion-caused losses suffered by resources under their stewardship could have been avoided if the invaders’ introduction and establishment had been successfully prevented.

While in the body of the article Cuthbert et al. seem uncertain about why funding for preventive actions is so low, in their conclusions they offer a convincing (to me) explanation. They note that people are intrinsically inclined to react when impact becomes apparent. It is therefore difficult to motivate proactive investment when impacts are seemingly absent in the short-term, incurred by other sectors, or in different regions, and when other demands on limited funds may seem more pressing. Plus efficient proactive management will prevent any impact, paradoxically undermining evidence of the value of this action!

Aedes aegypti mosquito; one of the species on which the most money is spent for post-introduction control; photo by James Gathany; via Flickr

Delay Costs Money

The reports contained in the InvaCost database indicate that management is delayed an average of 11 years after damage was first been reported. Cuthbert et al. estimate that these delays have caused an additional cost of about $1.2 trillion worldwide. Each $1 of management was estimated to reduce damage by $53.5 in this study. This finding, they argue, supports the value of timely invasive species management.

They point out that the Supplementary Materials contain many examples of bioinvasions that entail large and sustained late-stage expenditures that would have been avoided had management interventions begun earlier.

Although Cuthbert et al. are not as clear as I would wish, they seem to recognize also that stakeholders’ varying perceptions of whether an introduced species is causing a detrimental “impact” might also complicate reporting – not just whether any management action is taken

Cuthbert et al. are encouraged by two recent trends: growing investments in preventative actions and research, and shrinking delays in initiating management. However, these hopeful trends are unequal among the geographic regions.

Which Taxonomic Groups Get the Most Money?

About 42% of management costs ($39.9 billion) were spent on diverse or unspecified taxonomic groups. Of the costs that were taxonomically defined, 58% ($32.1 billion) was spent on invertebrates [see above re: forest pests]; 27% ($14.8 billion) on plants; 12% ($6.7 billion) on vertebrates; and 3% ($1.8 billion) on “other” taxa, i.e. fungi, chromists, and pathogens. For all of these defined taxonomic groups, post-invasion management dominated over pre-invasion management.  

When considering the invaded habitats, 69% of overall management spending was on terrestrial species ($66.1 billion); 7% on semi-aquatic species ($6.7 billion); 2% on aquatic species ($2.0 billion); the remainder was “diverse/unspecified”. For pre-invasion management (prevention programs), terrestrial species were still highest ($840.4 million). However, a relatively large share of investments was allocated to aquatic invaders ($624.2 million).

Considering costs attributed to individual species, the top 10 targetted for preventive efforts were four insects, three mammals, two reptiles, and one alga. Top expenditures for post-invasion investments went to eight insects [including Asian longhorned beetle], one mammal, and one bird.

Asian longhorned beetle

Just two of the costliest species were in both categories: insects red imported fire ant(Solenopsis invicta) and Mediterranean fruitfly (Ceratitis capitate). None of the species with the highest pre-invasion investment was among the top 10 costliest invaders in terms of damages. However, note the lack of data on fungi, chromists, and pathogens. (I wrote about this problem in an earlier blog.)

Discussion and Recommendations

Cuthbert et al. conclude that damage costs and post-invasion spending are probably growing substantially faster than pre-invasion investment. Therefore, they call for a stronger commitment to enhancing biosecurity and for more reliance on regional efforts rather than ones by individual countries. Their examples of opportunities come from Europe.

Drawing parallels to climate action, the authors also call for greater emphasis on during decision-making to act collectively and proactively to solve a growing global and inter-generational problem.

Cuthbert et al. focus many of their recommendations on improving reporting. One point I found particularly interesting: given the uneven and rapidly changing nature of invasive species data, they think it likely that future invasions could involve a new suite of geographic origins, pathways or vectors, taxonomic groups, and habitats. These could require different management approaches than those in use today.

As regards data and reporting, Cuthbert et al. recommend:

1) reducing bias in cost data by increasing funding for reporting of underreported taxa and regions;

2) addressing ambiguities in data by adopting a harmonized framework for reporting expenditures. For example, agriculture and public health officials refer to “pest species” without differentiating introduced from native species. (An earlier blog also discussed the challenge arising from  these fields’ different purposes and cultures.)

3) urging colleagues to try harder to collect and integrate cost information, especially across sectors;

4) urging countries to report separately costs and expenditures associated with different categories, i.e., prevention separately from post-invasion management; damage separately from management efforts; and.

5) creating a formal repository for information about the efficacy of management expenditures.

While the InvaCost database is incomplete (a result of poor accounting by the countries, not lack of effort by the compilers!), analysis of these data points to some obvious ways to improve global efforts to contain bioinvasion. I hope countries will adjust their efforts based on these findings.

SOURCE

Cuthbert, R.N., C. Diagne, E.J. Hudgins, A. Turbelin, D.A. Ahmed, C. Albert, T.W. Bodey, E. Briski, F. Essl, P. J. Haubrock, R.E. Gozlan, N. Kirichenko, M. Kourantidou, A.M. Kramer, F. Courchamp. 2022. Bioinvasion costs reveal insufficient proactive management worldwide. Science of The Total Environment Volume 819, 1 May 2022, 153404

Seebens, H. S. Bacher, T.M. Blackburn, C. Capinha, W. Dawson, S. Dullinger, P. Genovesi, P.E. Hulme, M.van Kleunen, I. Kühn, J.M. Jeschke, B. Lenzner, A.M. Liebhold, Z. Pattison, J. Perg, P. Pyšek, M. Winter, F. Essl. 2021. Projecting the continental accumulation of alien species through to 2050. Glob Change Biol. 2021;27:970-982.

Williams, G.M., M.D. Ginzel, Z. Ma, D.C. Adams, F.T. Campbell, G.M. Lovett, M. Belén Pildain, K.F. Raffa, K.J.K. Gandhi, A. Santini, R.A. Sniezko, M.J. Wingfield, and P. Bonello 2022. The Global Forest Health Crisis: A Public Good Social Dilemma in Need of International Collective Action. submitted

Posted by Faith Campbell

We welcome comments that supplement or correct factual information, suggest new approaches, or promote thoughtful consideration. We post comments that disagree with us — but not those we judge to be not civil or inflammatory.

For a detailed discussion of the policies and practices that have allowed these pests to enter and spread – and that do not promote effective restoration strategies – review the Fading Forests report at http://treeimprovement.utk.edu/FadingForests.htm

Global Loss of Floristic Uniqueness

Hakalau Forest, Hawai“i; nearly 90% of Hawaiian flora is unique to the Islands

A recent article by Yang et al. 2021 (full citation at the end of this blog) seeks to determine the extent to which introduced plants reduce the uniqueness of regional floras. They analyzed data from 658 regions covering about 65.7% of the Earth’s ice-free land surface and about 62.3% of the planet’s known plant species.

They found strong homogenization of plant species’ taxonomic and phylogenetic diversity results from introductions of plant species to ecosystems beyond their native range. Homogenization caused by regional extinctions of native floral species occurs much less frequently.

There are two aspects of a region’s floral uniqueness. One is the number of species that it shares with other regions. This is taxonomic uniqueness. The other is the distinctiveness of the evolutionary history of the region. When several species are endemic to a region’s flora, and lack close relatives in other regions, that equals phylogenetic uniqueness.

The effect of a species introduction differs depending on which of these aspects one focuses on. Thus, naturalization of a species closely related to native species (e.g., a congeneric species) will have less impact on the phylogenetic floristic uniqueness of the region than naturalization by a distantly related species. Taxonomic uniqueness, however, will be affected to the same degree, irrespective of the phylogenetic distance between the naturalized and native species.

Yang et al. found strong homogenization of plant diversity. They found that species introductions increased the taxonomic similarity in 90.7% of all regional pairs and phylogenetic similarity in 77.2% of all region pairs. Most homogenization results from introductions of plant species to ecosystems beyond their native range. Homogenization caused by regional extinctions of native floral species occurs much less frequently.

This loss of regional biotic uniqueness or distinctiveness changes biotic interactions and species assemblages. These, in turn, have ecological and evolutionary consequences at larger scales and higher levels.

The degree of homogenization between regions’ floras depends on three factors:

1) The distance between the donor and recipient regions. Since nearby regions share more species, an introduction from a more distant origin is more likely to be a novel species and so contribute to homogenization of “donor” and “receiving” floras.

2) Climatic similarity, especially temperature. A plant species introduced from a climatically similar but geographically distant place is more likely to establish than a species from a different climatic zone. As a result, the recipient area’s flora is changed to more closely resemble the flora of the donor region with which it shares climatic conditions – regardless of the distance between them.

3) The level of exchange of goods and people between two regions. The higher the rate of exchange between two regions, the greater the chance that a species will be introduced and become established. Yang et al. used the existence of current or past administrative relationships (e.g., colonial relationship) between two regions as a proxy for intensity of trade and transport between donor and recipient regions. They found that floras of regions with current or past administrative links have taxonomically become more similar to each other than the floras of regions with no such links.

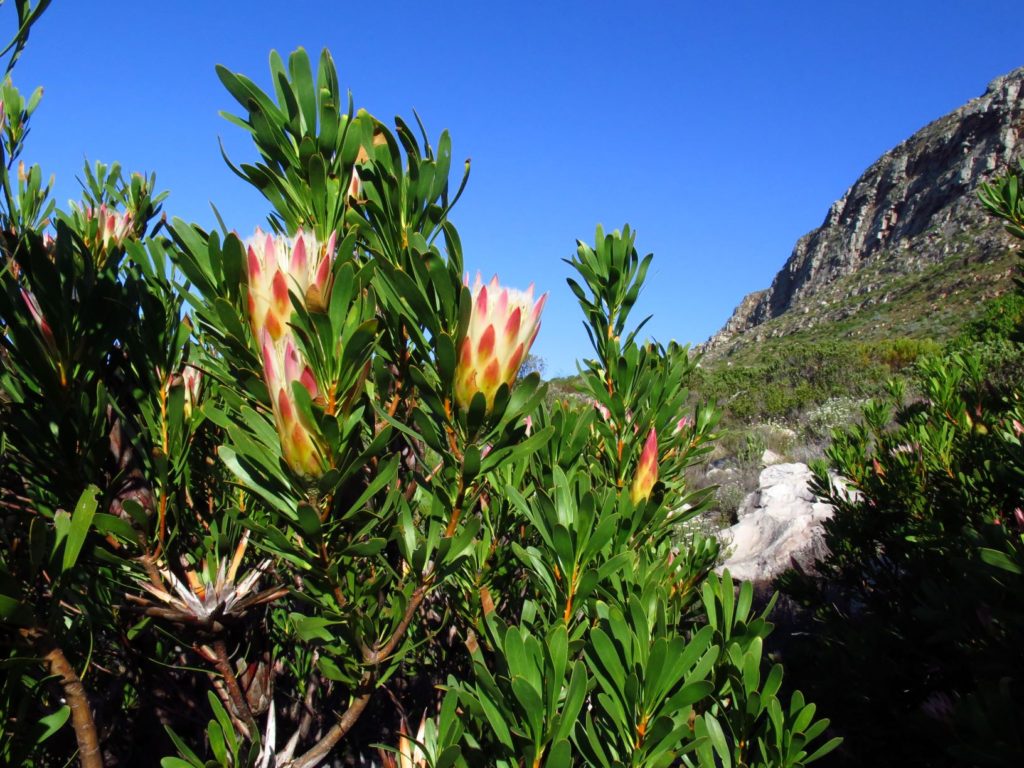
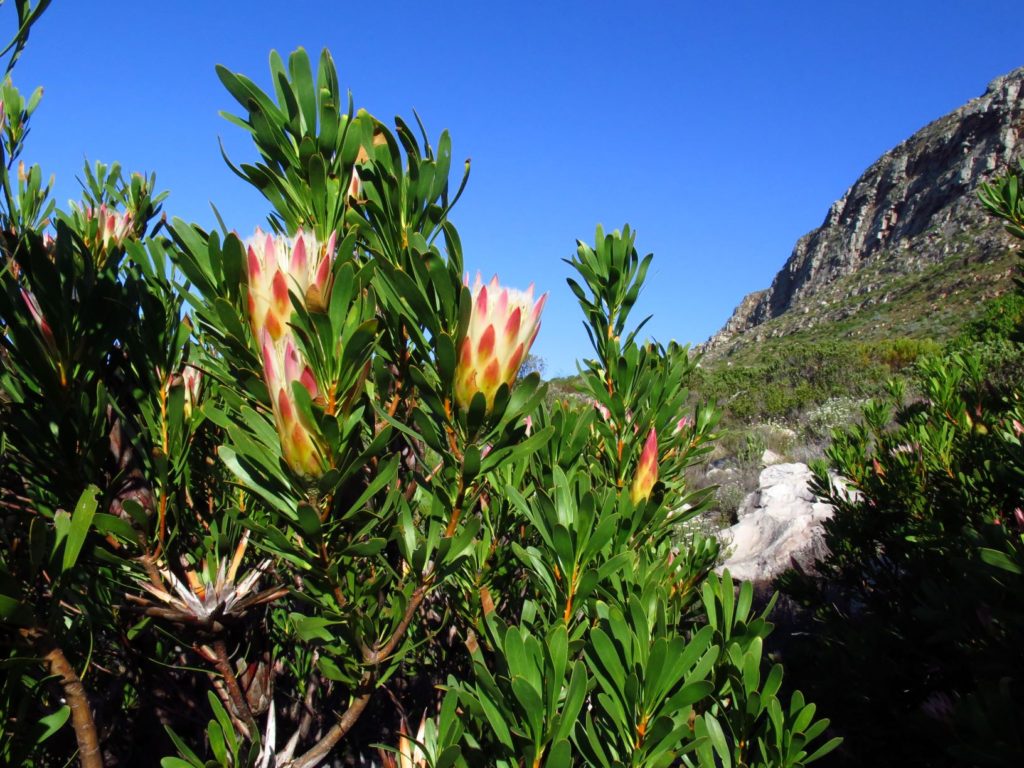
flora of the Cape Floral Kingdom – South Africa; photo from Michael Wingfield

Establishment of introduced species can increase floristic similarity of the donor and recipient regions (= floristic homogenization) when the species is native to one of the two regions and naturalizes in the other, or when it is not native to both regions and naturalizes in both. On the other hand, a species introduction can decrease the floristic similarity of the two regions (i.e., enhance floristic differentiation) when the species is not native to both regions but naturalized in only one.  

Homogenization hotspots differed slightly depending on whether one focused on taxonomic or phylogenetic aspects.

The regions with the greatest average increase in taxonomic similarity with other regions due to naturalized alien species were New Zealand, portions of Australia, and many oceanic islands. The Australasian situation probably reflects its long biogeographic isolation from other parts of the globe and its highly unique native flora. As a result, nearly all non-native plants introduced to Australasia strongly increase levels of its floristic similarity to the rest of the world. Oceanic islands have species-poor floras with large proportions of unique endemics. They have also received high numbers of naturalized alien plants.

Hotspots of phylogenetic homogenization on continents are the same as those for taxonomic homogenization, but this is not true for islands. Yang et al. think this is because islands’ native floras were established by natural colonization from nearby continental floras so – despite subsequent speciation – they retain their phylogenetic relationship to the donor areas’ floras.  

Yang et al. concede that they lacked high-quality data on native and naturalized alien species lists for a third of Earth’s ice-free terrestrial surface, especially Africa, Eastern Europe, and tropical Asia. They believe, however, that data from these regions are unlikely to change the overall finding.  (Scientists are beginning to compile lists of forest pests in Africa). link to blog

Yang et al. note that introduction and naturalization of alien species are likely to increase in the future, thusaccelerating floristic homogenization. The ecological, evolutionary and socioeconomic consequences are largely unknown.They call for stronger biosecurity regulations of trade and transport and other measures to protect native vegetation.

SOURCE

Yang, Q., P. Weigelt, T.S. Fristoe, Z. Zhang, H. Kreft, A. Stein, H. Seebens, W. Dawson, F. Essl, C. König, B. Lenzner, J. Pergl, R. Pouteau, P. Pyšek, M. Winter, A.L. Ebel, N. Fuentes, E.L.H. Giehl, J. Kartesz, P. Krestov, T. Kukk, M. Nishino, A. Kupriyanov, J.L. Villaseñor, J.J. Wieringa, A. Zeddam, E. Zykova  and M. van Kleunen. 2021. The global loss of floristic uniqueness. NATURE COMMUNICATIONS (2021) 12:7290. https://doi.org/10.1038/s41467-021-27603-y

Posted by Faith Campbell

We welcome comments that supplement or correct factual information, suggest new approaches, or promote thoughtful consideration. We post comments that disagree with us — but not those we judge to be not civil or inflammatory.

For a detailed discussion of the policies and practices that have allowed these pests to enter and spread – and that do not promote effective restoration strategies – review the Fading Forests report at http://treeimprovement.utk.edu/FadingForests.htm

In the News: Big, Colorful Joro Spider

Joro spider; photo by Dorothy Kozlowski, University of Georgia

Lately there has been lots of media attention to an introduced spider which has attracted attention because it is large and showy – and very numerous in 2021. The Joro spider, (Trichonephila (formerly Nephila) clavata) is — like so many introduced organisms — from East Asia (Japan, China, Korea, and Taiwan) (Hoebeke, Huffmaster and Freeman 2015; full citation at the end of the blog).

The spider was originally found in 2013 at several locations in three counties of northeast Georgia. All were near warehouses and other facilities associated with Interstate-85, a major transport corridor (Hoebeke, Huffmaster and Freeman 2015).

The Joro spider is one of about 60 species of non-indigenous spiders (Araneae) that have been detected in North America. The majority originated in Europe and Asia (species list posted here; see Araneae).

The Joro spider is one of the golden orb-web spiders, a group with conspicuously large and colorful females that weave exceptionally large, impressive webs. One species of the genus, N. clavipes (L.), occurs in the Western Hemisphere. It is found throughout Florida, the West Indies, as far north as North Carolina, across the Gulf States, through Central America, and into South America as far south as Argentina. It is also known as the “banana spider” or “golden silk spider.” (Hoebeke, Huffmaster and Freeman 2015)

Hoebeke, Huffmaster and Freeman (2015) describe both the spider’s discovery in Georgia (by Huffmaster) and how to distinguish it from other large spiders in the southeastern U.S. South Carolina has posted a fact sheet here.

In Asia and northeast Georgia, the spider apparently overwinters as eggs. Spiderlings emerge from the egg cocoons in the spring. Males reach maturity by late August. Females become sexually mature in September and early October. Oviposition occurs from mid-October to November resulting in the production of only a single egg sac. Large, mature females were first observed beginning in late September and persisted until mid-November when temperatures began to cool significantly. Most spiders were found in large webs attached to the exterior of homes near porch lights, on wooden decks, or among shrubs and flowering bushes near homes (Hoebeke, Huffmaster and Freeman 2015). By 2021 the webs were so numerous as to be consider major nuisances.

Probable Introduction Pathways

Hoebeke, Huffmaster and Freeman (2015) think the spiders are frequently transported (as adults or egg masses) in cargo containers, on plant nursery stock, and on crates and pallets. If accidental transport were to occur in late August to early October from East Asia, then the spiders’ reproduction would be at its height and there would be a greater likelihood that egg masses might be deposited on structures or plant material being exported.

This thought is supported by an email sent to Hoebeke in 2016 that a Joro spider had been seen on the outside of a freight container in Tacoma, Washington.  There has been no report of additional sightings in Washington State (Hoebeke pers. comm.)

Spread within the United States

By 2021, the Joro spider had been detected in at least 30 counties in north and central Georgia, adjacent South Carolina; Hamilton and Bradley counties in Tennessee; and Rutherford and Jackson counties in North Carolina (Hoebeke pers. comm.).  See the map here.

Spread in the United States is probably associated with major transport routes. The original detections were 64 km northeast of Atlanta near a thriving business location on the I-85 business corridor,

It is also possible that spiderlings balloon, that is, ride air currents to move some distance. This distance can be miles, depends on the spider’s mass and posture, air currents, and on the drag of the silk parachute (Hoebeke, Huffmaster and Freeman 2015). The 2014 Madison County detection in northeast Georgia was not near transport corridors but in a rural mixed farm landscape, downwind from the other sites. Males also use ballooning to find females for mating (Gavriles 2020).

How might the Joro spider affect the local ecosystem?

Many questions exist about the Joro spiders’ impact. Will they outcompete other orb weaving spiders – either native or nonnative? Will they reduce other insect populations through predation? Scientists do not yet see  indication of displacement of native spiders or depletion of prey species (Gavriles 2020; Hoebeke pers. comm.) 

Potential Range – update

In March 2022, two University of Georgia scientists (Andy Davis and Benjamin Frick) published a study that evaluated the Joro spider’s cold tolerance by studying the spider’s physiology and survival during a brief (2 minute) freeze. They found that the Joro spider’s more rapid metabolic and heart rates means it could probably survive throughout most of the Eastern Seaboard. The scientists reiterate earlier information that the Joro spider does not appear to have much of an effect on local food webs or ecosystems.

SOURCES

Cannon, J. Palm-sized, invasive spiders are spinning golden webs across Georgia in ‘extreme numbers’ https://www.usatoday.com/story/news/nation/2021/09/29/scientists-say-invasive-joro-spiders-here-stay-georgia/5917913001/  accessed 21-11/5

Gavrilles, B. Like it or not, Joro spiders are here to stay. October 26, 2020 https://news.uga.edu/joro-spiders-are-here-to-stay/

Hoebeke, E. Richard. University of Georgia Department of Entomology

Hoebeke, E.R., W. Huffmaster, and B.J. Freeman. 2015 Nephila clavata L. Koch, the Joro Spider of East Asia, newly recorded from North America (Araneae: Nephilidae) PeerJ https://peerj.com/articles/763/#

Posted by Faith Campbell

We welcome comments that supplement or correct factual information, suggest new approaches, or promote thoughtful consideration. We post comments that disagree with us — but not those we judge to be not civil or inflammatory.

For a detailed discussion of the policies and practices that have allowed these pests to enter and spread – and that do not promote effective restoration strategies – review the Fading Forests report at http://treeimprovement.utk.edu/FadingForests.htm

The Lacey Act – Can It Protect US from Invasive Species?

Sean Connery as Hotspur, Shakespeare Henry IV Part I (BBC, “Age of Kings”)

[Starlings – one of the agricultural pests that prompted adoption of the Lacey Act – were introduced to the U.S. because they were mentioned by Shakespeare: Hotspur says “Nay, I’ll have a starling shall be taught to speak nothing but ‘Mortimer,’ and give it him, to keep his anger still in motion.”]

Americans are increasingly aware of the damage caused by invasive species. The law that ostensibly protects our environment from most potentially invasive animals is the Lacey Act – more specifically, the “injurious wildlife” sections of the law, now known as 18 U.S.C. 42 or title 18.

When it was adopted 120 years ago, the Lacey Act was not intended to protect the environment from the full range of possible animal bioinvaders. While Congress amended it several times in the first 60 years of its existence, the law still has many gaps that impede its usefulness for that purpose.

Rep. John F. Lacey via Wikimedia Commons

When first adopted in 1900, the injurious wildlife provisions of the Lacey Act prohibited importation only of wild mammals and birds that posed a threat to agriculture and horticulture. The statute was quite broad in that it prohibited importation of any wild bird or mammal without a permit; there was no requirement that a species be designated as “injurious” to be regulated. The Act was then administered by the U.S. Department of Agriculture. [For a detailed discussion of the Lacey Act’s changing provisions, see Jewell 2020; full reference at the end of this blog.]

In 1960 the Act was amended to expand the list of taxa eligible for designation as “injurious” to include fishes, mollusks, crustaceans, reptiles, and amphibians. Congress also expanded the justifications for listing a species as injurious. It added harm to people, to forestry, or to wildlife or US wildlife resources to the law’s original concerns for agriculture and horticulture. This second change brought the purposes of the Lacey Act closer to the mandate of the U.S. Fish and Wildlife Service (USFWS) – which had assumed responsibility for implementing the Act in 1939.

Unfortunately, Congress simultaneously took other action that greatly weakened USFWS’ ability to use the Act to protect the environment from introduced animals. First, it dropped the requirement that the Secretary approve, with a permit, any importation of a wild bird or mammal.

Second, the 1960 amendment clouded the originally clear prohibition of movement of listed species across state lines. The new language prohibits “any shipment between the continental United States, the District of Columbia, Hawaii, the Commonwealth of Puerto Rico, or any possession of the United States …”

For the next 57 years, the USFWS and Congress sometimes interpreted that language as continuing to prohibit transport between the states within the continental United States. However, this situation could not last. In 2017, acting in a case that had challenged the 2012 listing of several nonnative constrictor snakes as “injurious,” the D.C. Circuit court found that the plain language of §18 U.S.C. 42(a)(1) does not prohibit the transportation of injurious wildlife between states within the continental United States. So now, transportation of injurious wildlife among the continental states is not prohibited by the statute in most circumstances.

Burmese python; photo by R. Cammauf, Everglades National Park via Flickr

The Law’s Strengths

Some aspects of the law have been strengths. Since the term “injurious” has never been defined, the USFWS has been able to use its discretion to list species that are not necessarily invasive themselves but that might cause harm in some other way. For example, the salmon family and 20 genera of salamanders have been listed because they are vectors of harmful wildlife pathogens.

In addition, USFWS has listed entire genera or families of organisms – as long as each species within the taxon has been shown to possess the “injurious” trait(s). This flexibility has probably helped listings aimed at precluding importers from switching from the species that initially raised concerns to related species.

The Law’s Inherent Weaknesses

1) Legal shortfalls

Due to the confusion created by the 1960 amendment, the USFWS now lacks authority to prohibit interstate transport of species listed as “injurious”. This gap undermines the law’s efficacy in controlling spread of listed species once they are established within the U.S.

Also, the law does not prohibit other human actions that pertain to the presence and spread of species listed as “injurious,” e.g., sale, possession, or intra-state transport. Addressing these other aspects of invasive species policy was left to other players, such as states or resource managers.

2) Funding shortfall

Neither the Executive Branch nor Congress has ever provided specific funding for implementation of the Lacey Act. Only one USFWS staffer has the job of listing species under the Act. This situation might change now, since the American Rescue Plan Act adopted in spring 2021 does provide funding over the next five years for listing species that can vector pathogens harmful to people.

Staff’s Evaluation of Its Implementation of the Lacey Act

Since USFWS took over implementation of the Lacey Act in 1939, 36 taxonomic groups have been added to the “injurious wildlife” list. Seven of these listings comprise multiple species – either as genera or families. 

Two mammals have been listed since the late 1960s – brushtail possum in 2002 and raccoon dog in 1983. Recent listings have strongly focused on aquatic organisms. This is because the staff is housed in the Fish and Aquatic Conservation program and their expertise is in these species.

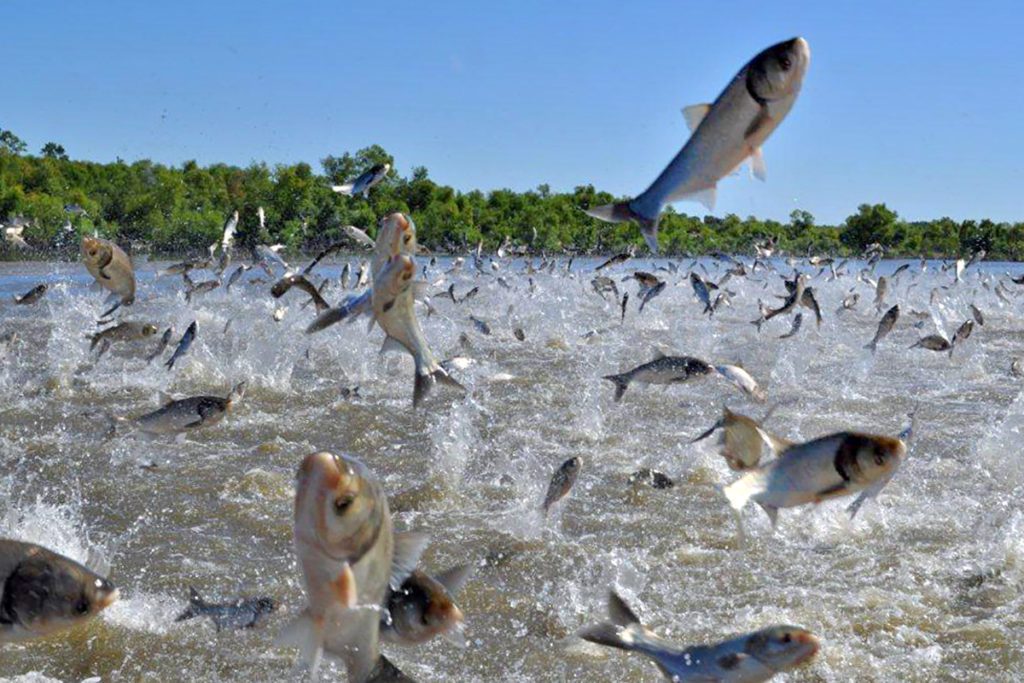
silver carp; photo by University of Illinois

Listing activity appeared to be building in the second decade of the 21st Century, with multi-species listings of fish, snakes, and salamanders between 2012 and 2016. However, there has been only one listing action since 2016 – and that was by an act of Congress (listing of the quagga mussel).

In two peer reviewed papers, the USFWS’ Jewell and Fuller provide a history of the Lacey Act’s injurious wildlife title and analyze the effects of listing of 307 species (those listed since 1952). They conclude that 98% of the species listings were “effective” because the listed species either had not been introduced subsequent to listing [288 species; 94% of the total number of listed species] or had not spread to additional states [12 species, 4% of the total]. Another way to calculate the latter figure is to say that 63% of all established species have remained within the state(s) where they were established at the time of listing. Only three species have been spread to additional states by human actions. In these cases, Jewell and Fuller considered the Lacey Act measures to be “ineffective”. For further details on the Jewell and Fuller evaluations of listing efficacy, see their article – full citation given at the end of this blog.

Jewell and Fuller do not evaluate the impacts of animal species introduced to the U.S. after 1960 that have never been listed under the Lacey Act, or speculate about whether listing those species might have minimized the risk of their introduction.

Jewell and Fuller consider listing of species not yet established in the U.S. to be most effective for two reasons. First, listing minimizes the probability that the species will be imported intentionally or unintentionally. Second, listing provides states with risk analyses and other information on which to rely in adopting their own restrictions, including possible prohibitions on sale or possession.

Jewell and Fuller also argue that even in the absence of legal authority to regulate interstate transport of listed species among the continental states, it is still worthwhile to list species that are already established in the U.S. They give six reasons. I summarize those reasons (placing them in my order, not Jewell and Fuller’s):

1) Listing can protect the islands of Hawai`i, Puerto Rico, and the Caribbean and Pacific territories. All are extremely vulnerable to invasive species.

2) If a species shares the traits of injuriousness with other species, particularly those in the same genus or family, then including the already-invasive species demonstrates why the related species should also be listed.

3) Many imported animals carry parasites and pathogens harmful to native species, and stopping the continued importation can reduce those threats that cause disease.

4) Prohibiting further importation of the invasive species can prevent individuals from being introduced to new areas where the species would not otherwise have arrived and can reduce propagule pressure that could introduce hardier individuals.

5) Listing can provide states and other jurisdictions with the technical information they need to pursue additional restrictions not federally authorized under 18 U.S.C. 42, such as transport into a state, possession, and sale.

6) Listing reduces propagule pressure and might enhance the efficacy of any eradication or control measures.

How to Improve the Lacey Act

1) Amend the Lacey Act to restore authority to regulate interstate movement of listed species – including among the continental states and emergency listing authority. Also establish a more streamlined listing process.

2) Strengthen implementation of the law by providing a specific, adequate appropriation to hire additional staff. Utilize the enhanced resources to assess species proactively using risk assessment tools.

It is not yet clear whether the Biden Administration will initiate a more active listing process, especially beyond the zoonotic disease vectors that are the subject of the American Rescue Plan Act.

Note: The “injurious wildlife” section of the Lacey Act (18 U.S.C. 42, or title 18) is separate from another part of the Lacey Act (16 U.S.C. 3371-3378) that is has always been more widely known. This provision regulates wildlife trafficking across State lines. It was later broadened to include plants and trafficking of wildlife and plants from foreign countries.

SOURCES

Jewell S.D. (2020) A century of injurious wildlife listing under the Lacey Act: a history. Management of Biological Invasions. Volume 11, Issue 3: 356–371, https://doi.org/10. 3391/mbi.2020.11.3.01 https://www.reabic.net/journals/mbi/2020/3/MBI_2020_Jewell.pdf

Jewell S.D., P.L. Fuller (2021) The unsung success of injurious wildlife listing under the Lacey Act. Management of Biological Invasions. Volume 12, Issue 3:527-545 https://www.reabic.net/journals/mbi/2021/3/MBI_2021_Jewell_Fuller.pdf

Alternative view – that Lacey Act implementation has failed to protect the U.S. – presented by the following authors:

Fowler, A.J., D.M. Lodge and J. Hsia. 2007. Failure of the Lacey Act to protect US ecosystems against animal invasions. Frontiers in Ecology and the Environment.

Springborn, M. C.M. Romagosa and R.P. Keller. 2011. The value of nonindigenous species risk assessment in international trade. Ecological Economics

Jenkins, P.T. 2012. Invasive animals and wildlife pathogens in the United States: the economic case for more risk assessments and regulation. Biological Invasions

Posted by Faith Campbell

We welcome comments that supplement or correct factual information, suggest new approaches, or promote thoughtful consideration. We post comments that disagree with us — but not those we judge to be not civil or inflammatory.

USFS invasive species report: Herculean effort that could have had greater impact

In February the USFS published a lengthy analysis of invasive species: Invasive Species in Forests and Rangelands of the United States. A Comprehensive Science Synthesis for the US Forest Sector (Poland et al. 2021; full citation at the end of the blog). More than 100 people contributed to the book; I helped write the chapters on legislation and regulations and international cooperation. The book is available for download at no cost here.

Chapters address impacts in terrestrial and aquatic systems; impacts on ecosystem processes; impacts on various sectors of the economy and cultural resources; interactions with climate change and other disturbances; management strategies for species and landscapes; tools for inventory and management. Each chapter evaluates the current status of knowledge about the topic and suggests research needs. There are also summaries of the invasive species situation in eight regions.

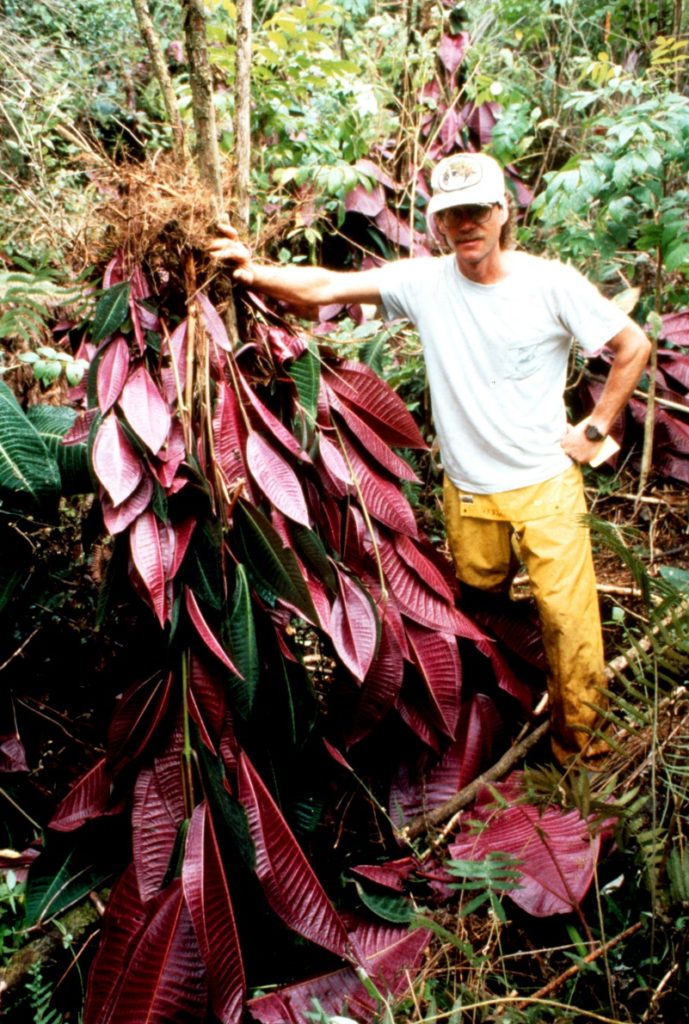
Miconia – one of many invasive plants damaging ecosystems in Hawai`i

I greatly appreciate the effort. Authors first met in 2015, and most chapters were essentially written in 2016. The long delay in its appearance came largely from negotiations with the publisher. The delay means some of the information is out of date. I am particularly aware that several experts – e.g., Potter, Guo, and Fei – have published about forest pests since the Aukema source cited. I wonder whether inclusion of their findings might change some of the conclusions about the proportion of introduced pests that cause noticeable impacts.

Since the report’s publication in February I have struggled with how to describe and evaluate this book. What is its purpose? Who is its audience? The Executive Summary says the report is a sector-wide scientific assessment of the current state of invasive species science and research in the U.S.

However, the Introduction states a somewhat different purpose. It says the report documents invasive species impacts that affect ecosystem processes and a wide range of economic sectors. This would imply an intention to enhance efforts to counter such effects– not just to shape research but also to change management. Indeed, the Conclusion of the Executive Summary (pp. xvi-xvii) is titled “An Imperative for Action”.

Tom Vilsack, Secretary of Agriculture

I am not the author to evaluate how effectively the book sets out research agendas. Regarding its usefulness in prompting policy-makers to do more, I regretfully conclude that it falls short.

Getting the balance right between an issue’s status and what needs to be done is difficult, perhaps impossible. I appreciate that the report makes clear how complex bioinvasion and ecosystem management and restoration are. Its length and density highlight the difficulty of making progress. This daunting complexity might well discourage agency leadership from prioritizing invasive species management.

On the other hand, summary sections sometimes oversimplify or bury important subtleties and caveats. The question of whether some key questions can ever be resolved by science is hinted at – but in detailed sections that few will read. The same is true regarding the restrictions imposed by funding shortfalls.

The Report Would Have Benefitted from Another Round of Editing

Editing this tome was a Herculean task. I feel like a curmudgeon suggesting that the editors do more! Nevertheless, I think the report would have been improved by the effort. One more round of editing – perhaps involving a wider range of authors – could have pulled together the most vital points to make them more accessible to policymakers. It could also have tightened the ecosystem-based descriptions of impacts, which are currently overwhelmed by too much information.

A precis for policymakers

A precis focused on information pertinent to policymakers (which the current Executive Summary does not) should contain the statement that the continued absence of a comprehensive investigation of invasive species’ impacts hampers research, management, and policy (mentioned only in §16.5, on p. 332). It should note situations in which insufficient funding is blocking recommended action. I note three examples: programs aimed at breeding trees resistant to non-native pests (resource issues discussed only in §§8.3.1 and 8.3.2, p. 195); sustaining “rapid response” programs (§6.4.3, p. 125); costs of ecosystem restoration, especially for landscape-level restoration (§16.4). I am sure there are additional under-funded activities that should be included!

cross-bred ash seedlings being tested for vulnerability to EAB; photo courtesy of Jennifer Koch

 Other important information that should be highlighted in such a precis includes the statement that many ecosystems have already reached a point where healthy functions are in a more tenuous balance due to invasive species (p. 51). Effective carbon storage and maintaining sustainable nutrient and water balance are at risk. Second, costs and losses caused by invasive forest pests generally fall disproportionately on a few economic sectors and households. They cannot be equated to governmental expenditures alone (p. 305).  Third, even a brief estimate of overall numbers of invasive species appears only in §7.4. Information about individual species is scattered because it is used as example of particular topic (e.g., impacts on forest or grassland ecosystems, or on ecosystem services, or on cultural values).

Ecosystem Impacts Overwhelmed

As noted above, the report laments the absence of a comprehensive investigation of invasive species’ impacts. Perhaps the editors intended this report to partially fill this gap. To be fair, I have long wished for a “crown to root zone” description of invasive species’ impacts at a site or in a biome. Concise descriptions of individual invasive species and their impacts are not provided by this report, but they can be found elsewhere. (The regional summaries partially address the problem of too much information – but they do not provide perspective on organisms that have invaded more than one region, e.g., emerald ash borer or white pine blister rust.) Another round of editing might have resulted in a more focused presentation that would be more easily applied by policymakers.

Welcome Straightforward Discussion of Conceptual Difficulties

I applaud the report’s openness about some important overarching concepts that science cannot yet formulate.  If supportable theories could be conceived, they would assist in the development of policies:

  • Despite decades of effort, scientists have not established a clear paradigm to explain an ecosystem’s susceptibility to invasion (p. 85). Invasibility is complex: it results from a dynamic interplay between ecosystem condition and ecological properties of the potential invader, especially local propagule pressure.
  • Scientists cannot predict how climate warming will change distributions of invasive species [see Chapter 4] and alter pathways. This inability hampers efforts to develop effective prevention, control, and restoration strategies (p. xi). Climate change and invasive species need to be studied together as interactive drivers of global environmental change with evolutionary consequences.

The Report’s Recommendations

Policy-oriented recommendations are scattered throughout the report. I note here some I find particularly important:

  • Measures of progress should be based on the degree to which people, cultures, and natural resources are protected from the harmful effects of invasive species.
  • Managers should assess the efficacy of all prevention, control, and management activities and their effect upon the environment. Such an evaluation should be based on a clear statement of the goals of the policy or action. [I wish the report explicitly recognized that both setting goals and measuring efficacy are difficult when contemplating action against a new invader that is new to science or when the impacts are poorly understood. Early detection / rapid response efforts are already undermined by an insistence on gathering information on possible impacts before acting; that delay can doom prospects for success.]
    • Risk assessment should both better incorporate uncertainty and evaluate the interactions among multiple taxa. Risk assessment tools should be used to evaluate and prioritize management efforts and strategies beyond prevention and early detection/rapid response.
    • Economic analyses aimed at exploring tradeoffs need better tools for measuring returns on invasive species management investments (§16.5).
  • Actions that might be understood as “restoration” aim at a range of goals along the gradient between being restored to a known historic state and being rehabilitated to a defined desired state. The report stresses building ecosystem resilience to create resistance to future invasions, but I am skeptical that this will work re: forest insects and disease pathogens.
  • Propagule pressure is a key determinant of invasion success. Devising methods to reduce propagule pressure is the most promising to approach to prevent future invasions (p. 115). This includes investing in quarantine capacity building in other countries can contribute significantly to preventing new invasions to the US.
  • Resource managers need additional studies of how invasive species spread through domestic trade, and how policies may differ between foreign and domestic sources of risk.

I appreciate the report’s attention to such often-ignored aspects as non-native earthworms and soil chemistry. I also praise the report’s emphasis on social aspects of bioinvasion and the essential role of engaging the public. However, I think the authors could have made greater use of surveys conducted by the Wisconsin Department of Natural Resources and The Nature Conservancy’s Don’t Move Firewood program.

Lost Opportunities

I am glad that the report makes reference to the “rule of 25” rather than “rule of 10s”. I would have appreciated a discussion of this topic, which is a current issue in bioinvasion theory. As noted at the beginning of this blog, the long time between when the report was written and when it was published might have hampered such a discussion

Also, I wish the report had explored how scientists and managers should deal with the “black swan” problem of infrequent introductions that have extremely high impacts. The report addresses this issue only through long discussions of data gaps, and ways to improve models of introduction and spread.

I wish the section on the Northwest Region included a discussion of why an area with so many characteristics favoring bioinvasion has so few damaging forest pests. Admittedly, those present are highly damaging: white pine blister rust, sudden oak death, Port-Orford cedar root disease, balsam woolly adelgid, and larch casebearer. The report also notes the constant threat that Asian and European gypsy moths will be introduced. (The Entomological Society of America has decided to coin a new common name for these insects; they currently to be called by the Latin binomial Lymatria dispar).

And I wish the section on the Southeast and Caribbean discussed introduced forest pests on the Caribbean islands. I suspect this reflects a dearth of research effort rather than the biological situation. I indulge my disagreement with the conclusion that introduced tree species have “enriched” the islands’ flora.

SOURCE

Poland, T.M., P. Patel-Weynand, D.M Finch, C.F. Miniat, D.C. Hayes, V.M Lopez, editors. 2021. Invasive species in Forests and Rangelands of the United States. A Comprehensive Science Synthesis for the US Forest Sector. Springer

Posted by Faith Campbell

We welcome comments that supplement or correct factual information, suggest new approaches, or promote thoughtful consideration. We post comments that disagree with us — but not those we judge to be not civil or inflammatory.

For a detailed discussion of the policies and practices that have allowed these pests to enter and spread – and that do not promote effective restoration strategies – review the Fading Forests report at http://treeimprovement.utk.edu/FadingForests.htm

The South African Report as a Model: U.S. Falls Short

Ailanthus – one of the invasive species shared by South Africa and the U.S.

A few years ago, I posted a blog in which I pointed to a report on South Africa’s response to bioinvasion as a model for the U.S. and other countries. South Africa has published its second report. This report outlines the country’s status as of December 2019 and trends since the first report (i.e. since December 2016). (I describe the report’s findings on South Africa’s invasive species situation in a companion blog.) Again, I find it a good model of how a country should report its invasive species status, efforts, and challenges. In comparison, many U.S. efforts comes up short.

U.S. Reports Need to Be More Comprehensive

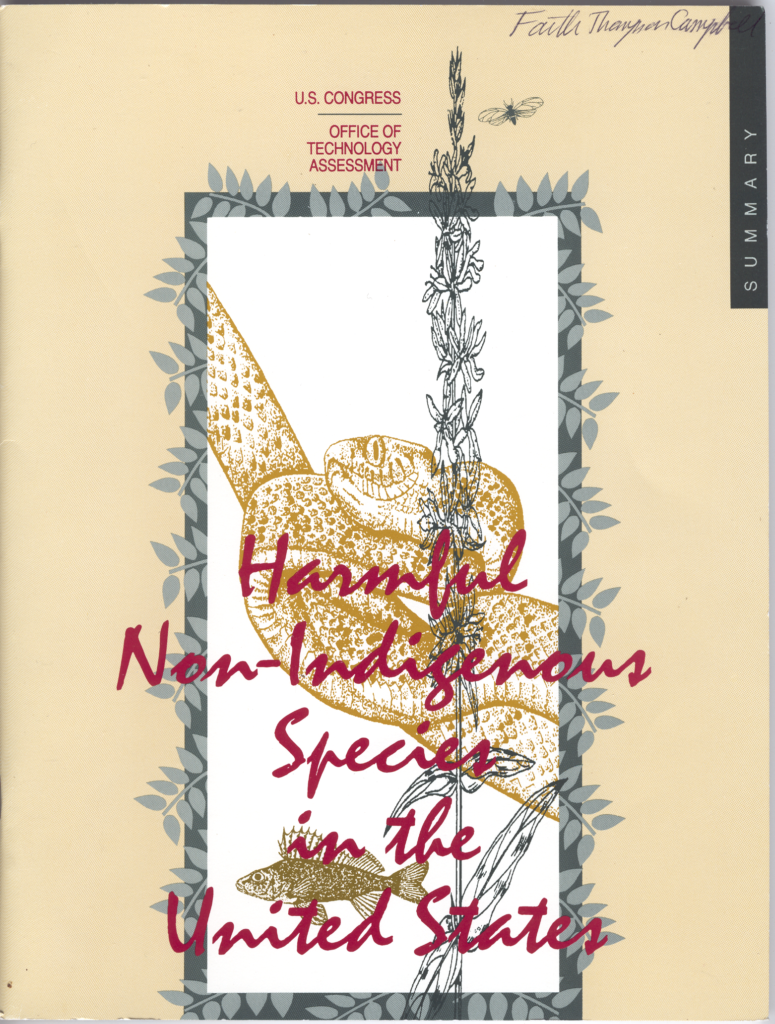
The South African report provides a national perspective on all taxa. Various United States agencies have attempted something similar a few times. The report issued by the Office of Technology Assessment in 1993  summarized knowledge of introduced species and evaluated then-current management programs.

The 2018 report by the U.S. Geological Service focused on data: the authors concluded that 11,344 species had been introduced and described the situation in three regions – the “lower 48” states, Alaska, and Hawai`i. However, the USGS did not evaluate programs and policies. The new USDA Forest Service report (Poland et al. 2021) describes taxa and impacts of invasive species in forest and grassland biomes, including associated aquatic systems. Again, it does not evaluate the efficacy of programs and policies.

The biennial national reports required by the Executive Order establishing the National Invasive Species Council (NISC) are most similar to the South African ones in intent. However, none has been comprehensive. For example, the most recent, issued in 2018, strives to raise concern by stating that invasive species effect a wide range of ecosystem services that underpin human well-being and economic growth. Some emphasis is given to damage to infrastructure. The report then sets out priority actions in six areas: leadership and prioritization, coordination, raising awareness, removing barriers, assessing federal capacities, and fostering innovation. NISC also issued a report in 2016 – this one focused on improving early detection and rapid response. NISC posted a useful innovation – a “report card” updating progress on priority actions — in October 2018.   It listed whether actions had been completed, were in progress, or were no longer applicable. However, the “report card” gave no explanation of the status of various actions; the most notable omissions concerned the actions dismissed as “not applicable”. Worse, no report cards have been posted since 2018. I doubt if those or any more comprehensive reports will be forthcoming. This reflects the increasing marginalization of NISC. The Council has never had sufficient power to coordinate agencies’ actions, and now barely survives.

U.S. Reports Need to Be More Candid

The authors of the South African report made an impressive commitment to honest evaluation of the country’s gaps, continuing problems, progress, and strengths. As in the first report, they are willing to note shortcomings, even of programs that enjoy broad political support (e.g., the Working for Water program).

It is not clear whether decision-makers have acted — or will act — on the report’s findings. That is true in many countries, including the United States. However, that is separate whether decision-makers have an honest appraisal on which to base action.

Assessment of South Africa’s Invasive Species Programs

Here is a summary of what the authors say about South Africa’s invasive species program. I want to state clearly that my intention is not to criticize South Africa’s efforts. No country has a perfect program, and South Africa faces many challenges. These have been exacerbated by COVD-19.  

The report identifies the areas listed below as needing change or improvement.

1) Absence of a comprehensive policy on bioinvasion. Such a policy would provide a vision for what South Africa aspires to achieve, clarify the government’s position, guide decision-makers, and provide a basis for coordinating programs by all affected parties (e.g., including conservation and phytosanitary agencies).

2) As in the first report, the authors call for monitoring program outcomes (results) rather than inputs (money, staffing, etc.) or outputs (e.g., acres treated). The authors also say data must be available for scrutiny. In those cases when data are adequate for assessing programs’ efficacy, they indicate that the control effort is largely ineffective.

3) Inadequate data in several areas. The report notes progress in developing and applying transparent and science-based criteria to species categorization as invasive (as distinct from relying on expert opinion). However, this change is taking time to implement, and sometimes results in species receiving a different rating. [I agree with the report that data gaps undermine understanding of the extent and impacts of bioinvasion, domestic pathways of spread, justification of expenditures, assessment of various programs’ efficacy (individually or overall), priority setting, and identifying changes needed to overcome programs’ weaknesses. However, I think filling these data gaps might demand time and resources that could better be utilized to respond to invasions – even when those invasions are not fully understood.]

4) Funding of bioinvasion programs by the National Department of Forestry, Fisheries, and the Environment has been fairly constant over 2012–2019, but this is a decline in real terms. The figure of 1 billion ZAR does not include spending by other government departments, national and provincial conservation bodies, municipalities, non-governmental organizations, and the private sector. Authors of the report expect funding to decrease in the future because of competing needs.

While at least 237 invasive species are under some management (see Table 5.1), funding is heavily skewed – 45% of funding goes to management of one invasive plant (black wattle); 72% to management of 10 species.

5) Need for policies to address the threat emerging from rising trade with other African countries, especially considering the probable adoption of the proposed African Continental Free Trade Area. Under this agreement, imported goods will only be inspected for alien species at the first port of entry, and most African countries have limited inspection capacity. [European pathologists Brasier, Jung, and others have noted the same issue arising in Europe, where imported plants move freely around the European Union once approved for entry by one member state.]

The authors of the South African report say programs’ efficacy would be considerably improved if species and sites were prioritized, and species-specific management plans developed. They warn that, in the absence of planning and prioritization, there is a risk that funding could be diluted by targeting too many species, leading to ineffective control and a concomitant increase in impacts.

In South Africa, regulations, permits, and other measures aimed at regulating legal imports of listed species are increasingly effective. However, there is still insufficient capacity to prevent accidental or intentional illegal introductions of alien species. There is also more enforcement of regulations requiring landowners to control invasive species. Six criminal cases have been filed and – as of December 2019, one conviction (guilty plea) obtained. However, the data do not allow an assessment of the overall level of compliance.

The report found little discernable progress on the proportion of pathways that have formally approved management plans. Management is either absent or ineffective for 61% of pathways. There has been no action to manage the ballast water pathway. On the other hand, in some cases, other laws focus explicitly on pathways, e.g., agricultural produce is regulated under the Agricultural Pests Act of 1983.

During the period December 2016 – December 2019, the Plant Inspection Services tested more than 12,000 plant import samples for quarantine pests and made 62 interceptions. The report calls for more detailed information from the various government departments responsible for managing particular pathways (e.g., the phytosanitary service), and for an assessments of the quality of their interventions.

The number of non-native taxa with some form of management has grown by 40% since December 2016 – although – as I have already noted — spending is highly skewed to a few plant species. The number and extent of site-specific management plans has also increased, apparently largely due to a few large-scale plans developed by private landowners. However, few of these plans have been formally approved by some unspecified overseer.

Citing the strengths and weaknesses described above, the current (second) report downgraded its assessment of governmental programs from “substantial” to “partial”.  

Comparison to U.S.

How does the United States measure up on the elements that need change or improvement?  I know of no U.S. government report that is as blunt in assessing the efficacy of our programs –individually or as a whole.

Nevertheless, each of the five weaknesses identified for South Africa also exist in the United States:

  1. Re: lack of a comprehensive policy, I think the U.S. also suffers this absence. This is regrettable since the National Invasive Species Council (NISC) was set up in 1999.
  2. Re: monitoring outcomes to assess programs’ efficacy, I think U.S. agencies do seem to be more focused on collecting data on programs’ results – see the Forest Service’ budget justification. However, I think too often the data collected focus on inputs and outputs.
  3. Re: data gaps, I think all countries – including the U.S. — lack data on important aspects of bioinvasion. I differ from the South African report, however, in arguing for funding research aimed at developing responses rather than monitoring to clarify the extent of a specific invasive species. Information that does not lead to action seems to me to be a luxury given the low level of funding.
  4. Re: funding, I find that, despite the existence of NISC, it remains difficult to get an overall picture of U.S federal funding of invasive species programs. Indeed, the cross-cut budget was dropped in 2018 at the Administration’s request. I expect all agencies are under-funded; I have often said so as regards key USDA programs. As in South Africa, funding is skewed to a few species that I think should be lower in priority (e.g., gypsy moth). 
  5. Re: upgrading invasive species programs to counter free-trade policies, I think U.S. trade policies place too high a priority on promoting agricultural exports to the detriment of efforts to prevent forest pest introductions. This imbalance might be present with regard to other taxa and pathways. See Fading Forests II here.

South African and U.S. agencies also face the same over-arching issues. For example, the U.S. priority-setting process seems to be a “black box.” Several USFS scientists (Potter et al. 2019) spent considerable effort to develop a set of criteria for ranking action on tree species that are hosts of damaging introduced pests. Yet there is no evidence that this laudable project influenced priorities for USFS funding.

SOURCES

Poland, T.M., P. Patel-Weynand, D.M Finch, C.F. Miniat, D.C. Hayes, V.M Lopez, editors. 2021. Invasive Species in Forests and Rangelands of the United States. A Comprehensive Science Synthesis for the US Forest Sector. Springer

Potter, K.M., Escanferla, M.E., Jetton, R.M., Man, G., Crane, B.S. 2019. Prioritizing the conservation needs of United States tree species: Evaluating vulnerability to forest P&P threats, Global Ecology and Conservation (2019), doi: https://doi.org/10.1016/j.gecco.2019.e00622.

SANBI and CIB 2020. The status of bioinvasions and their management in South Africa in 2019. pp.71. South African National BD Institute, Kirstenbosch and DSI-NRF Centre of Excellence for Invasion Biology, Stellenbosch. http://dx.doi.org/10.5281/zenodo.3947613

Posted by Faith Campbell  

We welcome comments that supplement or correct factual information, suggest new approaches, or promote thoughtful consideration. We post comments that disagree with us — but not those we judge to be not civil or inflammatory.

For a detailed discussion of the policies and practices that have allowed these pests to enter and spread – and that do not promote effective restoration strategies – review the Fading Forests report at http://treeimprovement.utk.edu/FadingForests.htm

South Africa & Invasive Species: Threats to High Value Biodiversity and Human Well-Being

Protea repens and fynbos vegetation near Table Mountain; photo by Mike Wingfield

South Africa is a country of immense biological diversity. It is also one that recognizes the threat invasive species pose to its natural wealth – and to the economy and livelihoods of ordinary people.

Also, South Africans are trying hard to improve the country’s invasive species program. It recently released the second national report assessing how well it is curtailing introductions and minimizing damage. As I describe in a companion blog, I find these reports to contain exceptionally thorough and honest appraisals of South Africa’s invasive species programs. I address that value in the companion blog, where I compare the South African report — and its findings — to U.S. government reports on our invasive species programs.

In South Africa, bioinvasion ranks third – after cultivation and land degradation – as a threat to the country’s impressive biodiversity. Invasive species are responsible for 25% of all biodiversity loss. Certain taxa are at particular risk: native amphibians and freshwater fishes, and some species of plants and butterflies.

Particularly disturbing is the bioinvasion threat to the Fynbos biome. The report notes that 251 non-native species have been identified in this system. This finding causes concern because the Fynbos is a unique floral biome. In fact, it constitutes the principal component of one of only six floral kingdoms found on Earth: the Cape Floral Kingdom (or region). For more information, go here.

map of South Africa showing fynbos biome

Not surprisingly, invasive bird and plant species are most numerous around major urban centers. The report concludes that this is probably because most non-native birds are commensal with humans; most birds and plants were first introduced to urban centers; and there is greater sampling effort there. Indeed, the patterns of (detected) invasive plant richness are still highly sensitive to sampling effort.

South Africa is considered a leader on invasive species management. However, its record is spotty.

Successes

Biocontrol interventions are considered a success. South Africa has approved release of 157 biocontrol agents, including seven since 2016. All the recent agents (and probably most others) target invasive plants. The South African biocontrol community conducts a comprehensive review of their effectiveness at roughly 10-year intervals. The fourth assessment is currently under way. Also, the report considers eradication of non-native fish (primarily sport species) from several wetlands and river reaches to have been successful. (However, opposition by sport fishermen has delayed listing of some trout species as invasive.)

Failures

On the other hand, strategies to combat invasive plants, other than by biocontrol, appear to be having little success. Even the extent of plant invasions in national parks is poorly documented. Also, the report highlights ballast water as an inadequately managed pathway of invasion.

The report estimates that three new non-native species arrive in South Africa accidentally or illegally every year. Interestingly, reported species arrivals have declined in the current decade compared to the preceding one. The report’s authors consider this to probably be an underestimate caused by the well-known lag in detecting and reporting introductions. The apparent decline also is contrary to global findings. Table 1 in Seebens et al. 2020 (full citation at end of blog) projected that the African continent would receive approximately 767 new alien species between 2005 and 2050.

Even the introductory pathways are poorly known: the pathway for 54% of the taxa introduced to South Africa are unknown. Of the species for which the introductory pathway is known, horticultural or ornamental introductions of plants dominate – 15% of that total. A second important pathway – for accidental introductions – is shipping (5% of all introductions). Other pathways thought to be prominent during 2017–2019 are the timber trade, contaminants on imported animals, and natural dispersal from other African countries where they had previously been introduced.

PSHB symptoms on Vachellia sieberiana; photo by Trudy Paap

Polyphagous shothole borer

The report highlights as an example of a recent introduction that of the polyphagous shothole borer (PSHB, Euwallacea fornicatus). https://www.dontmovefirewood.org/pest_pathogen/polyphagous-shot-hole-borer-html/        http://nivemnic.us/south-africas-unique-flora-put-at-risk-by-polyphagous-shot-hole-borer/ See Box 3.1 in the report. This species is expected to have huge impacts, especially in urban areas. While most of the trees affected so far are non-native (e.g., maples, planes, oaks, avocadoes), several native trees are also reproductive hosts.  https://www.fabinet.up.ac.za/pshb  In response to the introduction, the government established an interdepartmental steering committee, which has developed a consolidated strategy and action plan. However, as of October 2020 the shot hole borer had not been listed under invasive species regulations, even on an emergency basis. It had been listed as a quarantine pest of agricultural plants (e.g., avocado) per the Agricultural Pests Act 1983.

As note in my blog assessing the report, the report bravely concludes that the government’s regulatory regime is only partially successful (whereas three years ago it graded it as “substantial”). The downgrade is the result of a more thorough evaluation of the regulatory regime’s effectiveness.

SOURCES

SANBI and CIB 2020. The status of bioinvasions and their management in South Africa in 2019. pp.71. South African National BD Institute, Kirstenbosch and DSI-NRF Centre of Excellence for Invasion Biology, Stellenbosch. http://dx.doi.org/10.5281/zenodo.3947613  

Seebens, H., S. Bacher, T.M. Blackburn, C. Capinha, W. Dawson, S. Dullinger, P. Genovesi, P.E. Hulme, M. van Kleunen, I. Kühn, J.M. Jeschke, B. Lenzner, A.M. Liebhold, Z. Pattison, J. Perg, P. Pyšek, M. Winter, F. Essl. 2020. Projecting the continental accumulation of alien species through to 2050. Global Change Biology. 2020;00:1 -13 https://onlinelibrary.wiley.com/doi/10.1111/gcb.15333

Posted by Faith Campbell

We welcome comments that supplement or correct factual information, suggest new approaches, or promote thoughtful consideration. We post comments that disagree with us — but not those we judge to be not civil or inflammatory.

For a detailed discussion of the policies and practices that have allowed these pests to enter and spread – and that do not promote effective restoration strategies – review the Fading Forests report at http://treeimprovement.utk.edu/FadingForests.htm