Canada’s 64th Forest Pest Management Forum — in Short

spruce budworm; photo by Jerry E. Dewey, USFS; via Bugwood

The 64th Forest Pest Management Forum was held in December 2021. This is the largest and most significant gathering of forest pest management experts, managers, and practitioners in Canada. The proceedngs are available here. I summarize the contents. (This is my third review of recent reports on invasive species by Canadians. See also here and here. I appeciate the opportunity to learn about forest pest issues across such a large proportion of North America!

As usual, much of the attention was given to native pests, e.g.,

  • mountain pine beetle (Dendroctonus ponderosae) in Yukon, Alberta [declining numbers and areas affected]; Saskatchewan [none found in boreal forest]
  • Jack pine budworm (Choristoneura pinus) – Saskatchewan, Manitoba, Ontario.  [damage to jack pine in the Northwest Territories is caused by an unknown agent]
  • spruce pests, including spruce budworm (Choristoneura fumiferana) across the country: from  Yukon and Northwest Territories to New Brunswick; Nova Scotia; Newfoundland and Labrador
  • aspen defoliators – British Columbia; Northwest Territories; Alberta; Saskatchewan;
  • Swiss Needle Cast – British Columbia
  • Septoria leaf and stem blight in hybrid poplars (Populus genus) spreading in British Columbia; fears it could threaten black cottonwood, a keystone species in riparian ecosystems
hemlock mortality caused by HWA in Nova Scotia; photo by Celia Boone, NSDLF

The meeting also reported the following on non-native forest pests:

  • Asian longhorned beetle (Anoplophora glabripennis) — Canada has been declared free of ALB; national grid-based detection surveys continue – visual surveys at 10 sites; none found
  • emerald ash borer (Agrilus planipennis) trapping focused on high-risk locations and urban centers outside established regulated areas with no new detections in 2021. Saskatchewan continues to regulate EAB as a quarantine pest – after its detection in Winnipeg in November 2017. In New Brunswick, EAB has spread throughout the region where it was originally discovered in early 2021. In Nova Scotia, EAB remains undetected outside of the regulated area of Halifax
  • spongy moth (Lymantria dispar dispar) – trapping continues across Canada; detections in all provinces except Newfoundland – Labrador. Officials think they have eradicated an incipient population in Manitoba. Outbreaks are intensifying in Ontario and Québec (spongy moth is also expanding in northern US)
  • brown spruce longhorned beetle (Tetropium fuscum) – widespread trapping in Nova Scotia detected no new finds.
  • hemlock woolly adelgid (Adelges tsugae) is a priority species. Hemlock is a major component of the forested regions in the eastern provinces and HWA threatens to cause potentially irreparable damage to hemlock-dominated areas. Visual detection surveys were conducted at more than 180 high risk locations in eastern Canada. HWA has been confirmed in 7 counties of Nova Scotia – 2 of them new; plus a new infestation in Ontario.
  • beech leaf-mining weevil (Orchestes fagi continues to spread, with 22,129 ha of damage and mortality in areas near Halifax, Nova Scotia. The report makes no mention of beech leaf disease and here.
  • Dutch elm disease (Ophiostoma ulmi & O.novo-ulmi) – spreading rapidly in parts of Saskatchewan; major control effort in Manitoba, where 38 communities are participating in a provincial program and Winnipeg has its own program.
  • elm zig zag sawfly (Aproceros leucopoda) – Canadian authorities are apparently considering what their response should be  [see also Martel et al. 2022. (open access!) 
elm zigzag sawfly; photo by Gyorgy Csoka Hungarian Forest Research Organization; via Bugwood

Canadian authorities have active surveillance programs targetting three species established in the U.S. which they worry will enter Canada:

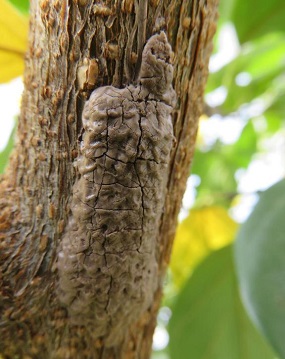
spotted lanternfly eggs; New York Dept. of Environmental Conservation photo
  • oak wilt (Ceratocystis fagacearum) – visual surveys at more than 60 sites in Ontario, Québec, New Brunswick and Nova Scotia; so far, no detections.
  • spotted lanternfly (Lycorma delicatula) authorities noted the many possible pathways of introduction
  • brown-tail moth (Euproctis chrysorrhoea) – rising population in Maine; several additional public reports of sightings in New Brunswick.

Policy

Canada has a National Forest Pest Strategy adopted by the Canadian Council of Forest Ministers (CCFM) in 2007. The CCFM Forest Pest Working Group (FPWG) plays a major role in advancing this Strategy. It also provides a national forum for generating ideas and exchanging information about forest pest management among federal, provincial, and territorial government agencies.

According to officials of the Canadian Food Inspection Agency (CFIA), the government has initiated limited pathway-based surveys to detect introduced pests associated with wood packaging material (crates, pallets, etc.). [See additional blogs posted here under “wood packaging” category. E.g., this one.  The agency is also developing an efficient, safe and feasible management program for handling shipborne dunnage. CFIA expected to publish a revised directive in spring 2022, then fully implement it by fall 2022.

Presentations on Individual Pests

The Proceedings include abstracts of presentations on individual species. The abstracts rarely provide the final findings.

Emma J. Hudgins, of Carleton University, reported on ways to optimize control of EAB in the U.S. She found that the best management strategy combined site-focused activities – such as biocontrol — and spread-focused (quarantine) management measures. This combined strategy vastly outperformed efforts based on limiting propagule pressure or managing single sites. In other words, quarantines should be refined rather than abandoned – as the US has done.

Oregon ash forest on the Willamette River, Oregon; photo by W. Williams, Oregon Dept. of Forestry

Chris MacQuarrie of the Canadian Forest Service reviewed use of biocontrol agents targetting EAB. Canada has approved release of three agents also approved in the United States: Tetrastichus planipennisi in 2013; Oobius agrili in 2015; Spathius galinae in 2017. Canada began trying to evaluate their impacts in 2018 – but the results are not included in the abstract.

Lucas Roscoe, also of the Canadian Forest Service, reviewed biocontrol efforts targetting hemlock woolly adelgid. The abstract doesn’t provide conclusions.

Kevin Porter and James Brandt assessed the risk of the spruce budworm (Choristoneura fumiferana) outbreaks in Eastern Canada’s Forests. The insect is the most widely distributed and destructive pest of spruce-fir forests in Canada; it is native to much of boreal and hemiboreal North America. Outbreaks occur periodically. Cumulative tree defoliation and mortality can result in significant losses of important timber and non-timber resources, affecting the forest industry and forest-dependent communities.

Stefan Zeglen and Nicolas Feau reported on the importance of environmental conditions in causing one disease. Swiss Needle Cast (caused by the usually innocuous endophyte Nothophaeocryptopus gaeumannii) has become pathogenic on Douglas-fir, causing up to 60% growth loss. This results from changing climate – and is expected to worsen with rising temperatures and humidity.

Posted by Faith Campbell

We welcome comments that supplement or correct factual information, suggest new approaches, or promote thoughtful consideration. We post comments that disagree with us — but not those we judge to be not civil or inflammatory.

For a detailed discussion of the policies and practices that have allowed these pests to enter and spread – and that do not promote effective restoration strategies – review the Fading Forests report at http://treeimprovement.utk.edu/FadingForests.htm

or
www.fadingforests.org

Search for Asian giant hornet

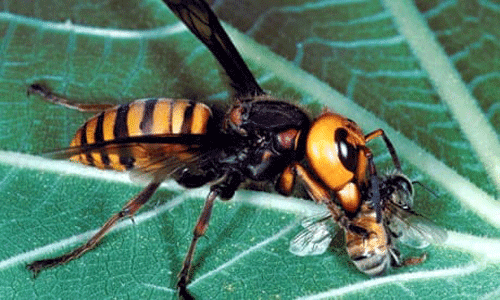
Asian giant hornet (Vespa mandarinia); photo by University of Florida Dept. of Entomology

Washington State’s “Giant Hornet – Hornet Herald” for June asks people to help with detecting this pest by monitoring paper wasp nests (hornets attack them). Hornet visits last 5 – 10 minutes while the hornet removes paper wasp larvae.  How to help:

  • Locate paper wasp nests that you have access to and can monitor through October. Then log the nest locations using the form here
  • Visit the nests each week, observe them, and then log your nest activity on a different form – here. Please monitor the nests for at least 5 minutes during the day once per week, but you can check the nests for as long and as often as you would like.

If you would like guidance on how to become a citizen-science monitor or trapper of Asian giant hornets – or presumably other bioinvaders – go here

Meanwhile, Washington State Department of Agriculture entomologists are in South Korea testing several hornet attractants and studying hornet foraging behavior. The goal  is to improve Washington’s trapping and tracking techniques.

Of course, 2022 is only half over, but so far neither Washington nor British Columbia has confirmed any detections.

Posted by Faith Campbell

We welcome comments that supplement or correct factual information, suggest new approaches, or promote thoughtful consideration. We post comments that disagree with us — but not those we judge to be not civil or inflammatory.

For a detailed discussion of the policies and practices that have allowed these pests to enter and spread – and that do not promote effective restoration strategies – review the Fading Forests report at http://treeimprovement.utk.edu/FadingForests.htm

or
www.fadingforests.org

Boxwood Blight – Another Failure of the Global Phytosanitary System

boxwood garden at Gunston Hall – home of founding father George Mason; Virginia; photo by Roger 4336 via Wikimedia

Boxwood blight is a disease caused by a group of fungal pathogens. While boxwoods are horticultural plants in the U.S. – important ones! – they are keystone forest species in several regions of the tropics and subtropics.

The situation with boxwood blight is yet another example of a too-frequent pattern for plant pathogens. This pattern applies even to plant taxa that are important to the ornamental horticulture industry – not only plants that are important in natural ecosystems. [See other blogs posted here under the category “plants as pest vectors”, e.g., here. The boxwood blight pathogens:  

  • are of unknown origin;
  • have a wide range of known hosts; additional hosts probable;
  • have been introduced to many new sites over about 30 years;
  • have caused considerable economic, aesthetic, and ecological harm;
  • are a threat to centers of endemism;
  • have no known methods to treat plants in forests;
  • are spread by international plant trade;
  • complicate detection by having hosts that sometimes are asymptomatic; or symptoms can be suppressed by fungicides;
  • apparently few efforts to apply phytosanitary measures to prevent further spread.

Also typical: concerned scientists are trying to promote adoption of phytosanitary measures. This takes the form of a study by Barke, Coop and Hong (full citation at the end of the blog; unless otherwise stated, information in this blog is from this source). They use several models based largely on climatic factors to predict additional geographic areas where else boxwood blight might establish.

I think it is most unfortunate that the U.S. horticultural industry prefers to avoid federal regulation despite the significant costs to its members. Instead, it has advocated for a primarily voluntary response (see below). This undermines efforts to restructure regulatory programs to improve phytosanitary agencies’ management of pathogens. Since the U.S. is such a powerful player on this issue, reducing pressure on APHIS to find more effective measures has global implications. I recognize that preventing transmission of unknown and cryptic pathogens is an intrinsically difficult task. However, tackling this problem should be a top priority for people concerned about retaining healthy floral communities.

Specifics About Boxwood Blight

Boxwood blight is caused by two ascomycete fungi, Calonectria pseudonaviculata [synonym Cylindrocladium buxicola] and Calonectria henricotiae. Both can infect and blight boxwood foliage, resulting in rapid plant death. C. henricotiae is known from only five countries in Europe; C. pseudonaviculata is currently established in 24 countries in three geographic areas: Europe and western Asia; New Zealand; and North America (30 US states and British Columbia). The disease caused by C. pseudonaviculata could spread well beyond its currently invaded range in these regions.

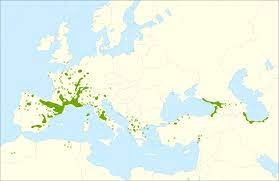
range of Buxus sempervirens; via Wikimedia

Native plants in the family Buxaceae grow in tropical or subtropical areas around the world. Plants in the genera Buxus, Didymeles, Haptanthus, Pachysandra, Sarcococca, and Styloceras are found in some areas of western and southern Europe; Turkey and the Caucuses into Iran; several countries in southeast and east Asia (China, Japan, South Korea, Vietnam, Indonesia); coastal Australia; high elevation areas of Africa, including Madagascar; parts of South America (southern Brazil, Uruguay, northern Argentina, and southern Chile, and foothills of the Andes); parts of Central America and the Caribbean. Asia is home to about 40 species of Buxus, four species of Pachysandra, and 11 species of Sarcococca.  In the Andes region, all five species of Styloceras are endemic. Central America and the Caribbean are home to about 50 species of Buxus; there are 37 species endemic to Cuba! Madagascar has nine endemic Buxus species.

Many Buxus species occur in small and isolated distributions resulting from both natural causes (e.g., island endemism) and anthropogenic disturbances (including deforestation and invasions of by other non-native pests, such as the box tree moth Cydalima perspectalis in Europe and western Asia).

In native stands of Buxus sempervirens in Georgia and northern Iran, where C. pseudonaviculata was detected in 2010, the disease has caused rapid and intensive defoliation of boxwood plants of different ages. [See also Lehtijarvi, Dogmus-Lehtijarvi and Oskay. Boxwood Blight in Turkey: Impact on Natural Boxwood Populations and Management Challenges. Baltic Forestry 2017, vol. 23(1)] Infected plants are also vulnerable to attacks by secondary opportunistic pathogens that can lead to eventual death. Damage to these forests could lead to reductions in soil stability and subsequent declines in water quality and flood protection, changes in forest structure and composition, and declines in Buxus-associated biodiversity (at least 63 species of lichens, fungi, chromista and invertebrates might be obligate).

Barke, Coop and Hong expect excessive heat and seasonal dryness at one extreme and excessive cold at the other to limit areas in North America and Europe/central Asia where the disease can establish. Areas with oceanic rather than continental climates are probably more vulnerable. However, heat and aridity barriers could be overcome by artificial irrigation of horticultural plantings.

Indeed, the conditions favoring C. pseudonaviculata establishment – warm temperatures and high humidity or water on the leaves – are commonly found in production nurseries. Overhead irrigation exacerbates the risk. Production nurseries also have large numbers of host plants in close proximity – so it is easy for disease to spread (Douglas). 

I am reminded that the causal agent of sudden oak death, Phytophthora ramorum,  has been spread from production nurseries located in hot, dry areas that were considered unsuitable to the pathogen – because conditions inside the nursery were suitable.

wild Buxus on island of Corsica; photo by Sten Porse via Wikimedia

As I noted, the origin of C. pseudonaviculata is unknown. Barke, Coop and Hong think it is most likely in eastern Asia, which is thought to be the likely native region of box tree moth. However, they cannot rule out some other center of diversity for Buxaceae species e.g., the Caribbean or Madagascar.

Barke, Coop and Hong call for additional studies to

  1. Explore potential effects of climate change on establishment risk, especially higher latitude areas expected to see increasing humidity, precipitation, and rising temperatures.
  2. Determine ability of C. pseudonaviculata microsclerotia to survive higher temperatures, e.g. in parts of the U.S. Deep South that may have ideal growing conditions during cool seasons.
  3. Modify the CLIMEX model developed for this study to predict the potential distribution of C. henricotiae, a closely related but genetically distinct species with greater tolerance of higher temperatures.

They call for a strict phytosanitary protocol for risk mitigation of accidental intro, with effective surveillance for early detection, and development of a recovery plan.

Regulatory (non) Response

Boxwood blight was first detected in the United Kingdom in mid-1990s; then in New Zealand in 2002. Only then was the causal agent determined. It was first detected in the U.S. in October 2011 (in Connecticut). It was quickly determined to be established in the mid-Atlantic region. Apparently the British, other European countries, and APHIS all decided the pathogen was too widespread to regulate (Douglas).

The U.S. is relying on a voluntary program. The nursery industry, through its Horticultural Research Institute (HRI), and the National Plant Board developed guidance for best management practices – updated as recently as 2020. 

boxwood blight symptoms; Oregon State University; via Flickr

In contrast, APHIS has acted to regulate the boxwood tree moth, Cydalima perspectalis. The moth was first detected in North America near Toronto in 2018. U.S. nurseries in six states received infected plants in spring 2021. On May 26, 2021, APHIS prohibited importation of host plants from Canada, including boxwood (Buxus spp), Euonymus (Euonymus spp), and holly (Ilex spp).

In July 2021, the moth was detected in Niagara County, New York. It was thought that the moths had flown or been blown into the area from Canada.  New York adopted an intrastate quarantine of three counties (Erie, Niagara, and Orleans) in December 10, 2021. APHIS followed with an interstate quarantine on March 23, 2022.

SOURCES

Barke, B.S., L. Coop and C. Hong. 2022.  Potential Distribution of Invasive Boxwood Blight Pathogen (Calonectria pseudonaviculata) as Predicted by Process-Based and Correlative Models. Biology 2022, 11, 849. https://doi.org/10.3390/biology11060849 www.mdpi.com/journal/biology

Douglas, S.M. Fact sheet; Connecticut Agricultural Experiment Station https://portal.ct.gov/-/media/CAES/DOCUMENTS/Publications/Fact_Sheets/Plant_Pathology_and_Ecology/2020/Boxwood-Blight-(1).pdf?la=en&hash=A4C6AF39765F27FDDEB5B4DC3FD3B6F3

Posted by Faith Campbell

We welcome comments that supplement or correct factual information, suggest new approaches, or promote thoughtful consideration. We post comments that disagree with us — but not those we judge to be not civil or inflammatory.

For a detailed discussion of the policies and practices that have allowed these pests to enter and spread – and that do not promote effective restoration strategies – review the Fading Forests report at http://treeimprovement.utk.edu/FadingForests.htm

or

www.fadingforests.org

Invasions cost protected areas more than $22 billion in 35 years

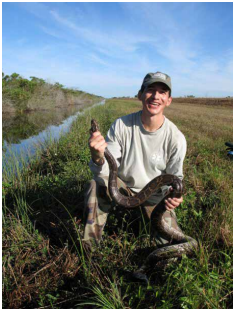
Burmese python in Everglades National Park; photo by Bob Reed, US FWS

Scientists continue to apply data collected in an international database (InvaCost; see “methods” section of Cuthbert et al.; full citation at end of this blog) to estimate the economic costs associated with invasive alien species (IAS). These sources reported $22.24 billion in economic costs of bioinvasion in protected areas over the 35-year period 1975 – 2020. Because the data has significant gaps, no doubt invasions really cost much more.

Moodley et al. 2022 (full citation at end of this blog) attempt to apply these data to analyze economic costs in protected areas. As they note, protected areas are a pillar of global biodiversity conservation. So it is important to understand the extent to which bioinvasion threatens this purpose. 

Unfortunately, the data are still too scant to support any conclusions. Such distortions are acknowledged by Moodley et al. I will discuss the data gaps below a summary of the study’s findings.

The Details

Of the estimated $22.24 billion, only 4% were observed costs; 96% were “potential” costs (= extrapolated or predicted based on models). Both had generally increased in more recent years, especially “potential” costs after 1995. As is true in other analyses of InvaCost data, the great majority (73%) of observed costs covered management efforts rather than losses due to impacts. The 24% of total costs ascribed to losses, or damage, exceeded the authors’ expectation. They had thought that the minimal presence of human infrastructure inside protected areas would result in low records of “economic” damages.

The great majority (83%) of reported management costs were reactive, that is, undertaken after the invasion had occurred. In terrestrial environments, there were significantly higher bioinvasion costs inside protected areas than outside (although this varied by continent). However, when considering predicted or modelled costs, the importance was reversed: expected management costs represented only 5% while these “potential” damages were 94%.

Higher expenditures were reported in more developed countries – which have more resources to allocate and are better able to carry out research documenting both damage and effort. 

More than 80% of management costs were shouldered by governmental services and/or official organizations (e.g. conservation agencies, forest services, or associations). The “agriculture” and “public and social welfare” sectors sustained 60% of observed “damage” and 89% of “mixed damage and management” costs respectively. The “environmental” and “public and social welfare” sectors together accounted for 94% of all the “potential” costs (predicted based on models) generated by invasive species in protected areas; 99% of damage costs. With the partial exception of the agricultural sector, the economic sectors that contribute the most to movement to invasive species are spared from carrying the resulting costs.

Lord Howe Island, Australia; threatened by myrtle rust; photo by Robert Whyte, via Flickr

Invasive plants dominated by numbers of published reports – 64% of reports of observed costs, 79% of reports of “potential”. However, both actual and “potential” costs allotted to plant invasions were much lower than for vertebrates and invertebrates. Mammals and insects dominated observed animal costs.

It is often asserted that protected areas are less vulnerable to bioinvasion because of the relative absence of human activity. Moodley et al. suggest the contrary: that protected areas might be more vulnerable to bioinvasion because they often host a larger proportion of native, endemic and threatened species less adapted to anthropogenic disturbances. Of course, no place on Earth is free of anthropogenic influences; this was true even before climate change became an overriding threat. Plenty of U.S. National parks and wilderness areas have suffered invasion by species that are causing significant change (see, for example, here, here, and here).

Despite Best Efforts, Data are Scant and Skewed

Economic data on invasive species in protected areas were available for only a tiny proportion of these sites — 55 out of 266,561 protected areas.

As Moodley et al. state, their study was hampered by several data gaps:

  1. Taxonomic bias – plants are both more frequently studied and managed in protected areas, but their reported observed costs are substantially lower than those of either mammals or insects.
  2. The data relate to economic rather than ecological effects. The costliest species economically might not cause the greatest ecological harm.
  3. Geographical bias – studies are more plentiful in the Americas and Pacific Islands. However, studies from Europe, Africa and South America more often report observed costs. The South African attention to invasive species (see blogs here, here, and here), and economic importance of tourism to the Galápagos Islands exacerbate these data biases.
  4. Methodological bias – although reporting bioinvasion costs has steadily increased, it is still erratic and dominated by “potential” costs = predictions, models or simulations.

I note that, in addition, individual examples of high-cost invasive species are not representative. The highest costs reported pertained to one agricultural pest (mango beetle) and one human health threat (mosquitoes).

Great Smokey Mountains National Park; threatened by mammals (pigs), forest pests, worms, invasive plants … Photo by Domenico Convertini via Flickr

As these weaknesses demonstrate, a significant need remains for increased attention to the economic aspects of bioinvasion – especially since political leaders pay so much greater attention to economics than to other metrics. However, the reported costs – $22.24 billion over 35 years, and growing! – are sufficient in the view of Moodley et al. to support advocating investment of more resources in invasive species management in protected areas, including – or especially – it is not quite clear — preventative measures.

SOURCES

Cuthbert, R.N., C Diagne, E.J. Hudgins, A. Turbelin, D.A. Ahmed, C. Albert, T.W. Bodey, E. Briski, F. Essl, P.J. Haubrock, R.E. Gozlan, N. Kirichenko, M. Kourantidou, A.M. Kramer, F. Courchamp. 2022. Bioinvasion cost reveals insufficient proactive management worldwide. Science of The Total Environment Volume 819, 1 May, 2022, 153404

Moodley, D., E. Angulo, R.N. Cuthbert, B. Leung, A. Turbelin, A. Novoa, M. Kourantidou, G. Heringer, P.J. Haubrock, D. Renault, M. Robuchon, J. Fantle-Lepczyk, F. Courchamp, C. Diagne. 2022.  Surprisingly high economic costs of bioinvasions in protected areas. Biol Invasions. https://doi.org/10.1007/s10530-022-02732-7

Posted by Faith Campbell

We welcome comments that supplement or correct factual information, suggest new approaches, or promote thoughtful consideration. We post comments that disagree with us — but not those we judge to be not civil or inflammatory.

For a detailed discussion of the policies and practices that have allowed these pests to enter and spread – and that do not promote effective restoration strategies – review the Fading Forests report at http://treeimprovement.utk.edu/FadingForests.htm

or www.fadingforests.org
Trees’ Value – High Although Major Benefits Not Addressed

loblolly pine – tree species showing highest value in this study; via Flickr

More scientists are examining the importance of American forests in providing ecosystem services – and the threat to those values raised by non-native pests and other factors. This is a broader perspective than used in the past – and it includes climate change.   also here  

Jeannine Cavender-Bareu and colleagues (full citation at the end of this blog) found that changes in the abundance and composition of US trees have the potential to undermine the benefits and societal values derived from those forests now. They examined threats associated with increasing invasive pests and pathogens, greater frequency of major fires, and climate change. Together, these constitute a complex set of global change drivers – and the impact of each is accelerating.

The authors tried to measure the impact of these forces on forests’ ability to provide five key ecosystem services. Two are “regulating” services—regulation of climate and air quality. The other three are “provisioning” services—production of wood products, food crops, and Christmas trees.

Unfortunately, they could not find sufficient data to analyze five other ecosystem services, which are equally or more important. They include both regulatory and provisioning services: water management, such as erosion control, flood and storm surge regulation; urban heat island regulation and energy savings; providing habitats for species (biodiversity); recreation; or ornamental, spiritual, and aesthetic values.

Cavender-Bareu and colleagues concluded that the value of the five analyzed services provided by 400 tree species across the contiguous United States over the years 2010-2012 is $114 billion per year. The non-market “regulatory” values far exceeds their current commercial value. 

  • Climate regulation via carbon storage in tree biomass provides 51% of this net annual value;
  • Human health improvements linked to trees’ filtering of air pollution provide an additional 37% of the annual net value.
  • Provisioning services, such as wood products, fruit and nut crops, and Christmas trees, provide only 12% of the net annual value. (By my calculation, wood products constituate almost three-quarters of this sum.)

The authors then tried to identify which tree lineages, e.g., taxonomic families, genera, or species, provide the greatest proportion of each of these ecosystem services. They also identified threats to these lineages. Together, this knowledge allows managers to target forestry management practices to the specific lineages within a landscape where ecosystem service are most at risk.

Table 1 in the article ranks 10 tree genera by the aggregate net value they provide: pine, oak, maple, Douglas-fir, hemlock, cherry/almond, spruce, hickories, yellow or tulip poplar, and ash. The table also provides separate dollar values for each of the five benefits.

Two lineages—pines and oaks — provide 42% of the value of these services (annually, pines = $25.4 billion; oaks = $22.3 billion). They note that these high values result from the large number of pine and oak species occupying diverse ecological niches. Oaks have the highest annual values for climate moderation or carbon storage ($10.7 billion) and air quality regulation ($11 billion). Oaks’ air quality regulation value reflects three factors: the genus’ abundance, the trees’ size, and the large numbers planted in cities and suburbs, that is, near human populations affected by pollution. Other than this issue of location, closely related tree species tend to have similar air quality regulation values.

Many lineages provide wood products, but the amounts vary widely among related species. Pines dominate annual net revenues from wood products at $7.4 billion, due in part to their high volume and higher than average price. The most valuable species in the context of this study’s set of ecosystem services are loblolly pine (Pinus taeda) and Douglas-fir (Pseudotsuga menziesii).

Edible fruits are concentrated in two lineages — family Rosaceae, especially genera Prunus and Malus; and family Rutaceae, genus Citrus. This category demonstrates the impact of disease: annual net returns from citrus products were actually negative during the 2010 – 2012 period due to abnormally low market prices and the prevalence of citrus greening disease in Florida, Arizona and California.

northern red oak – high value for timber & carbon sequestration; photo by dcrjsr via Wikimedia

Trees at Risk

As climate change progresses, the mix of tree species that provide critical ecosystem services will be altered—with unknown consequences. There could be increases in some services but also widely-expected losses in ecosystem benefits and human well-being.

An estimated 81% of tree species are projected to have at least 10% of their biomass exposed to climates outside their current climate envelope, impacting nearly 40% of total tree biomass in the contiguous U.S. An estimated 40% of species are projected to face increasing fire frequency. In both cases, individual species’ vulnerability depends more on where that species grows than on its genetic lineage. This analysis demonstrates a threatening interaction between these two disturbance agents: the species most valuable for carbon storage are also the most at risk from the increasing fire threat.

Known (established) pests threaten 16% of tree species and potentially affect up to 40% of total tree biomass. At greatest risk are the oak and pine genera (due to mountain pine beetle and oak wilt) plus most of the crop species. The authors cite chestnut blight and Dutch elm disease as examples of pests decimating once-dominant tree species — ones provided many services. In contrast to climate and fire risks, genetic relationships explain much of the risk of pest damage because most pests attack individual species, genera, or families.  (There are exceptions – sudden oak death and the Fusarium fungi vectored by invasive shot hole borers attack species across a wide range of families.)

Cavender-Bareu and colleagues conclude that major losses to pest attack of dominant species and lineages that currently provide high-value ecosystem services would undermine forest capacity to provide important benefits—at least for decades. They note that pest threats appear to be increasing partially as a consequence of climate change, demonstrating that multiple threats can interact and exacerbate outcomes. They say policy interventions aimed at slowing pests’ spread will probably be necessary to preserve the ecosystem service of climate and air quality regulation.

The high diversity of tree taxa in U.S. forests might buffer losses of ecosystem service if the most valuable lineages (oaks and pines) are compromised. However, other species will be needed to fill the voids their loss creates. Ensuring this possibility will require intentional management of forests and trees in the face of myriad and simultaneous threats.

The authors also show how tree-provided ecosystem services are distributed across the U.S. depending largely on the locations of forests, tree plantations, and orchards. Climate and air quality regulation occurs everywhere forests grow. Timber production is concentrated in a subset of the regions that also produce high climate regulation and air pollution removal, including the Southeast, Pacific Northwest, Northeast, and Upper Midwest.

The most valuable tree crops are grown on the coasts, often where forests do not grow—e.g., California; and in several Southwestern, Southern, and Eastern states.

Cavender-Bareu and colleagues found that climate change threatens species in all parts of the continent. Wildfires are expected to increase especially in California and the Intermountain West, which they say coincides with high annual storage of carbon. (This finding is opposite from those of Quirion et al. (2021) which pointed to the slow growth of pines in this region as reducing carbon storage potential.)

Cavender-Bareu and colleagues found that pest threats are highest in the Southwest and Southeast. These pests (native and non-native) are predicted to disproportionally affect species that generate high annual net values for climate regulation, air quality regulation, and wood products – e.g., pines and oaks. As noted above, these values are driven by their abundance. They note that mountain pine beetle and oak wilt have not yet reached areas with high wood product production in Northeast and Southeast.

Other studies (see Aukema et al. 2010) and here & here show that the greatest threats from non-native pests are to the Northeast/Midwest, and the Pacific coast – and Hawai`i & here.

Rock Creek Park, Washington, D.C. – an urban forest! photo by Bonnachaven

Cavender-Bareu and colleagues’ analysis advances our understanding of the threat several change drivers pose to benefits Americans receive from our forests. However, we must remember that some of the most important ecosystem services were not included because of insufficient data. Missing services:

1) most urban ecosystems. Inclusion of urban trees in the analysis would significantly increase the value of avoided health damage due to tree-based removal of air pollution. Urban trees also help regulate climate change (Nowak et al. estimate 643 M Mg of carbon are stored in urban areas, at a value of $2.31 billion annually).

2) many other regulating ecosystem services, such as erosion control, flood regulation, storm surge regulation, urban heat island regulation, energy savings due to shade, and species habitat / biodiversity.

3) recreation, ornamental, spiritual, and aesthetic values.

A complete accounting would also require estimates of the damage trees cause and the cost of their maintenance. For example, the full cost of irrigating almond trees; allergies and irritations due to tree pollen and sap; injuries to people and property caused by falling trees and limbs; trees’ role in spreading fires; trees’ contribution to volatile organic compounds (a pollutant).

The estimated annual values of the climate and air quality regulation have large uncertainty. These arise from uncertainty re: the social cost of carbon, the value of a statistical life, and uncertainty in the air pollution dose–mortality response function. The estimated annual values of the provisioning services are more precise because they are calculated from the market price for the per unit value of tree crops, wood products, and Christmas trees, as well as reliable data on production volume.

SOURCES

Aukema, J.E., D.G. McCullough, B. Von Holle, A.M. Liebhold, K. Britton, & S.J. Frankel. 2010. Historical Accumulation of Nonindigenous Forest Pests in the Continental United States. Bioscience. December 2010 / Vol. 60 No. 11

Cavender-Bareu, J.M., E. Nelson, J.E. Meireles, J.R. Lasky, D.A. Miteva, D.J.Nowak, W.D. Pearse, M.R. Helmus, A.E. Zanne, W.F. Fagan, C. Mihiar, N.Z. Muller, N.J.B. Kraft, S. Polasky. 2022. The hidden value of trees — Quantifying the ecosystem services of tree lineages and their major threats across the contiguous. PLOS Sustainability and Transformation April 5, 2022.  

Quirion BR, Domke GM, Walters BF, Lovett GM, Fargione JE, Greenwood L, Serbesoff-King K, Randall JM & Fei S (2021) Insect and Disease Disturbances Correlate With Reduced Carbon Sequestration in Forests of the Contiguous United States. Front. For. Glob. Change 4:716582.  Volume 4 Article 716582  doi: 10.3389/ffgc.2021.716582

Comment to APHIS on its Strategic Plan

APHIS is seeking stakeholder input to its new strategic plan to guide the agency’s work over the next 5 years.

The strategic plan framework is a summary of the draft plan; it provides highlights including the mission and vision statements, core values, strategic goals and objectives, and trends or signals of change we expect to influence the agency’s work in the future. APHIS is seeking input on the following questions:

  • Are your interests represented in the plan?
  • Are there opportunities for APHIS to partner with others to achieve the goals and objectives?
  • Are there other trends for which the agency should be preparing?
  • Are there additional items APHIS should consider for the plan?

range of American beech – should APHIS be doing more to protect it from 3 non-native pests?

The strategic plan framework is available at https://www.regulations.gov/document/APHIS-2022-0035-0001

To comment, please visit: https://www.regulations.gov/docket/APHIS-2022-0035

Comments must be received by July 1, 2022, 11:59pm (EST).

Posted by Faith Campbell

We welcome comments that supplement or correct factual information, suggest new approaches, or promote thoughtful consideration. We post comments that disagree with us — but not those we judge to be not civil or inflammatory.

For a detailed discussion of the policies and practices that have allowed these pests to enter and spread – and that do not promote effective restoration strategies – review the Fading Forests report at http://treeimprovement.utk.edu/FadingForests.htm

or www.fadingforests.org